D3: Data Driven Documents
Overview
Building blocks of charts
D3 overview
Appending elements, binding data
Example chart
Building blocks of charts
What elements constitute a chart?

What elements constitute a chart?
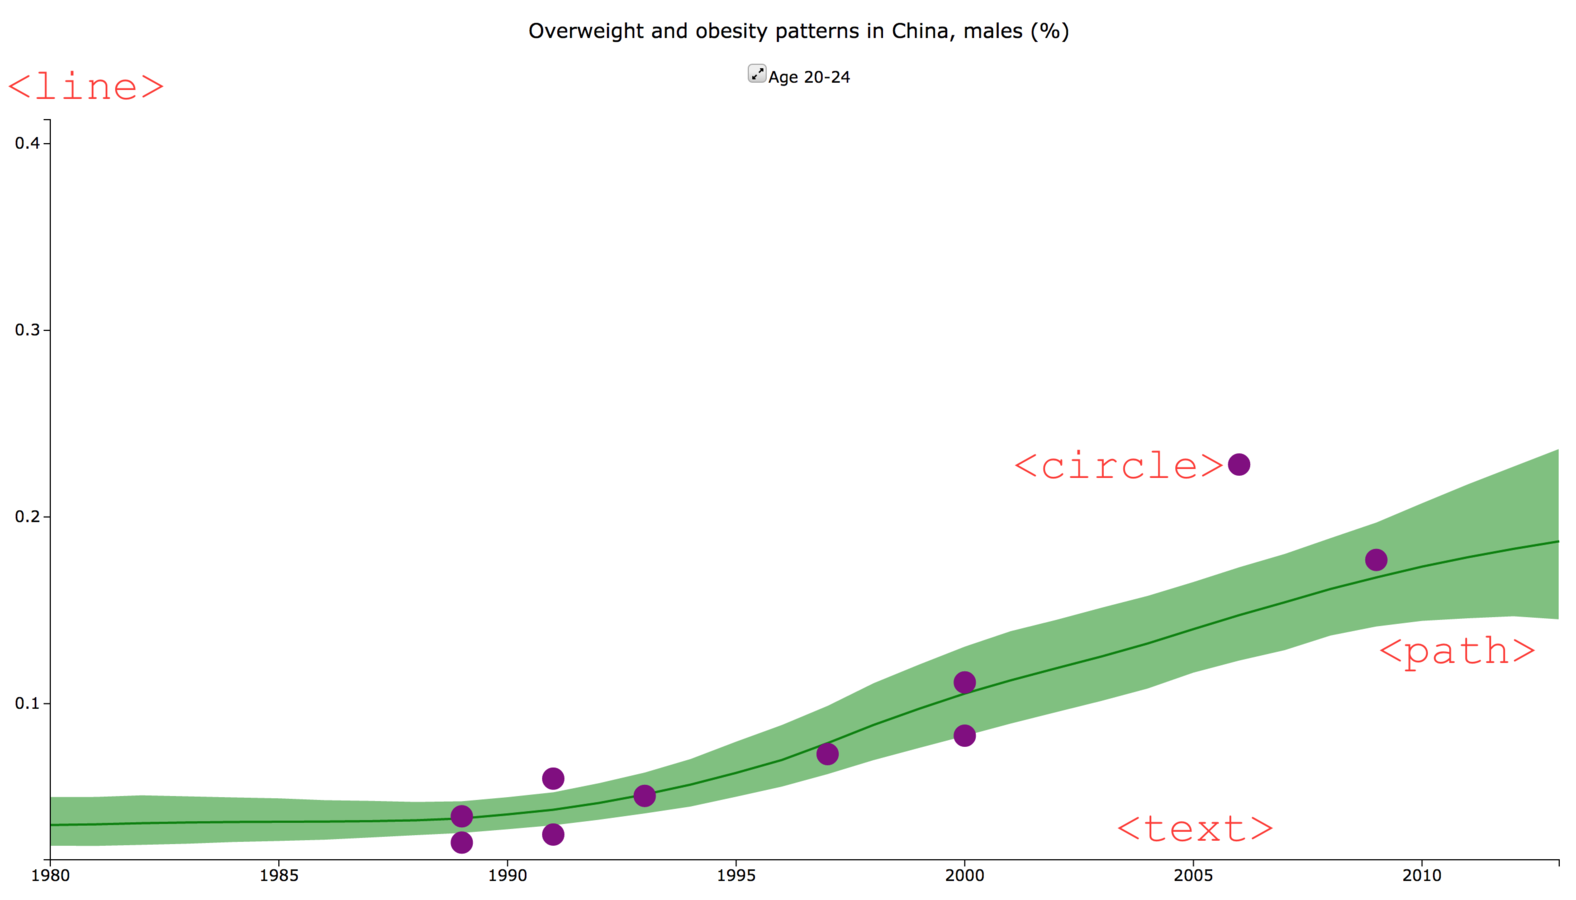
All you have to do is learn how to arrange these elements into charts
Building blocks of charts
<!-- Container Div -->
<div>
	<!-- Container svg for visual elements -->
	<svg>
		<!-- Rectangle element -->
		<rect x=10 y=10 height=20 width=100></rect>
	</svg>
</div>
Visual elements are part of the DOM
Elements are wrapped in a Scalable Vector Graphic (SVG)
Limitations
Tedious
Not scalable
Not flexible
Not dynamic
D3 Overview
What is D3?
A JavaScript library that makes charts
Not a charting library
DOM manipulation library
Binds data to visual elements
Easily included in HTML
<script src="http://d3js.org/d3.v3.min.js"></script>
So what can D3 do?


All you have to do is learn how to arrange these elements into charts
(and D3 can help!)
Appending elements to the page
Appending elements
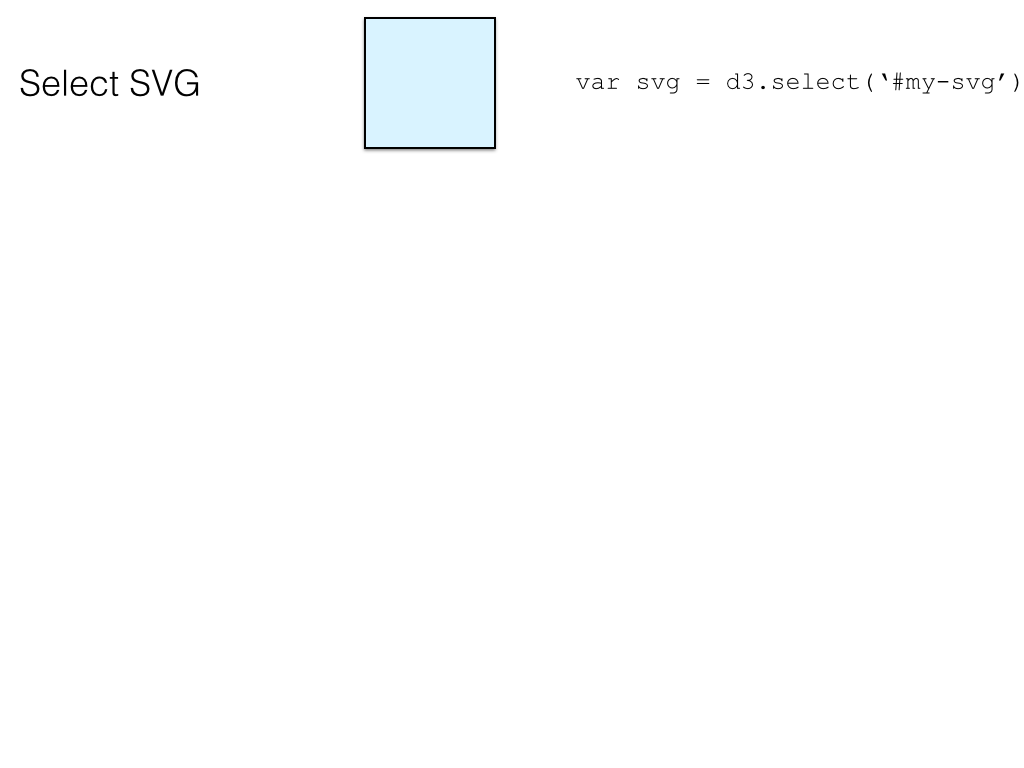
Select element
d3.select('#my-div')Append an element to your selection
d3.select('#my-div').append('svg')Assign attributes and styles
d3.select('#my-div').append('svg')
	.attr('width', 100)
	.attr('height', 100)
	.style('border', '1px solid black')
Binding data
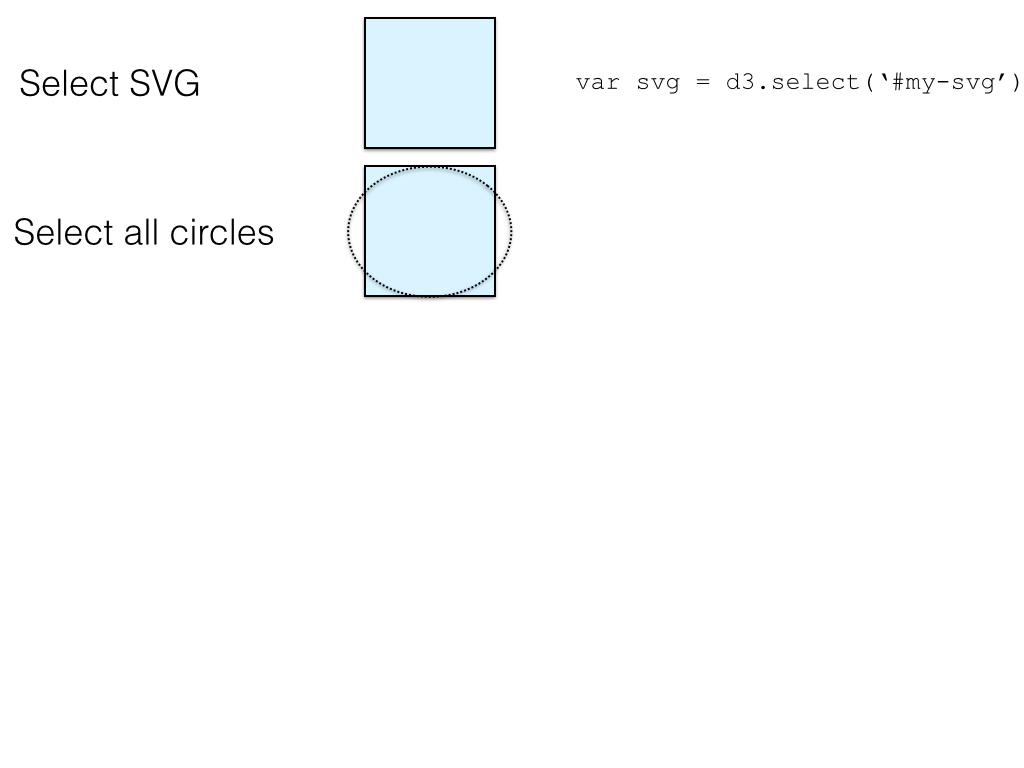
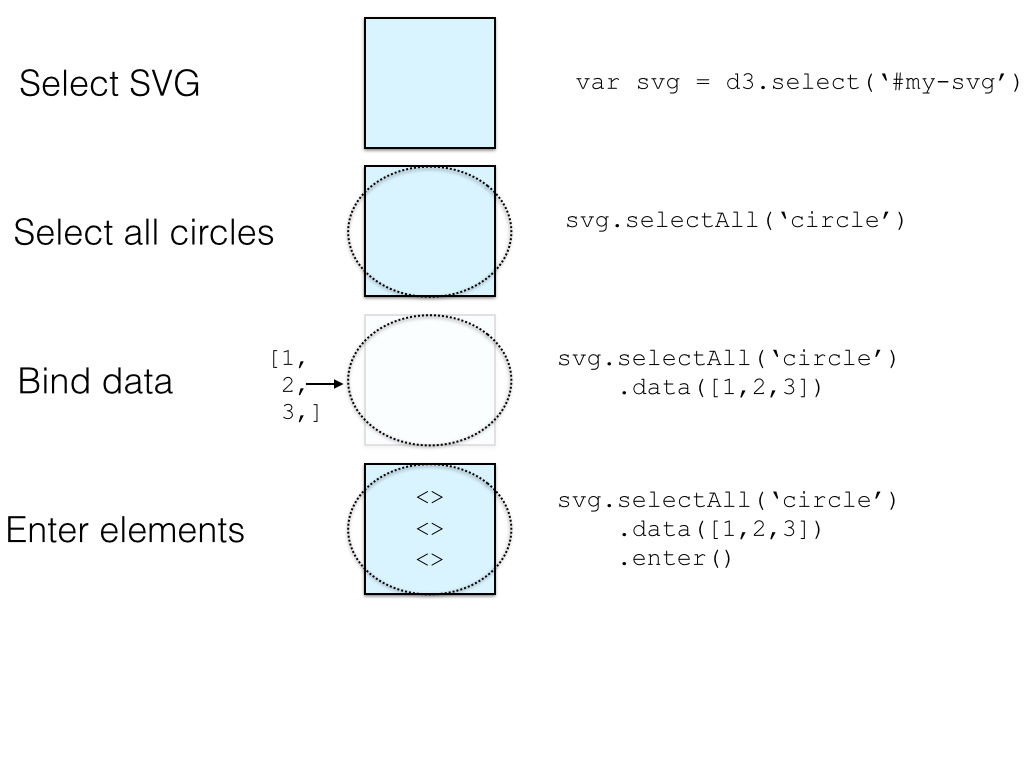
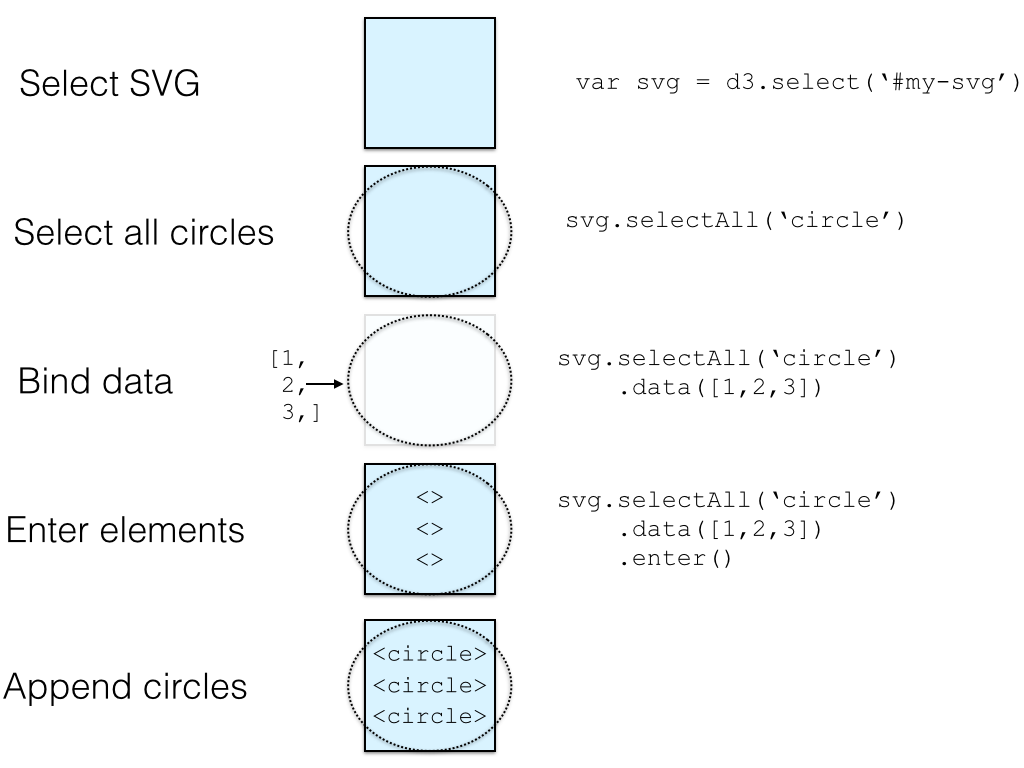
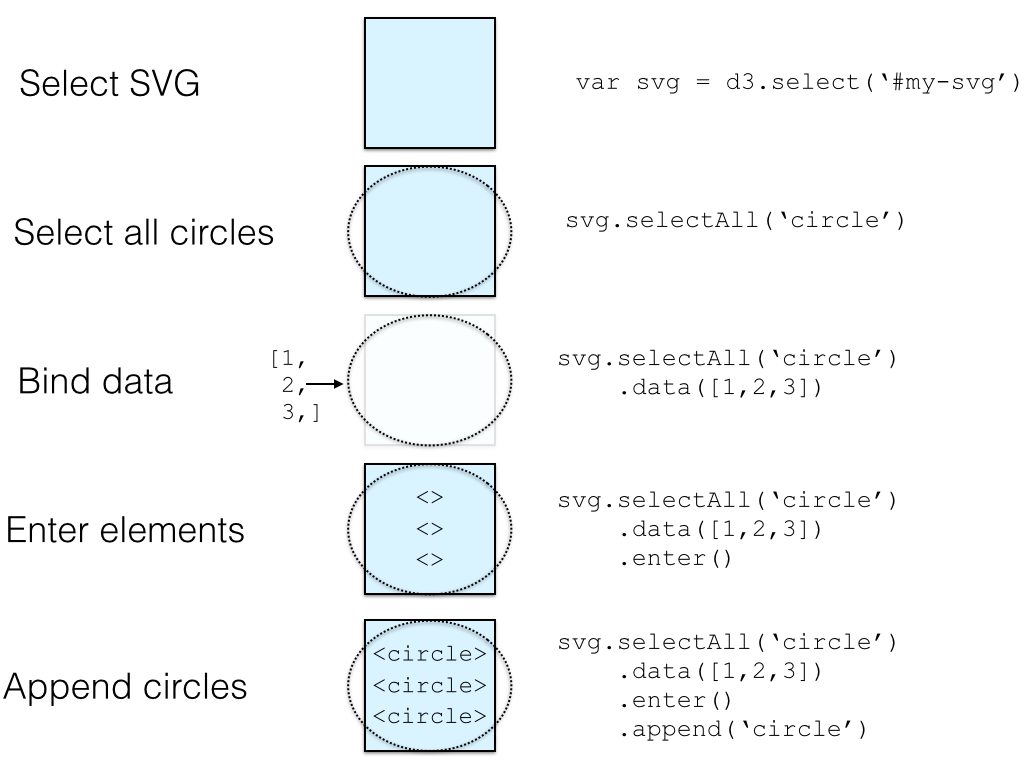
Entering, exiting
Binding data
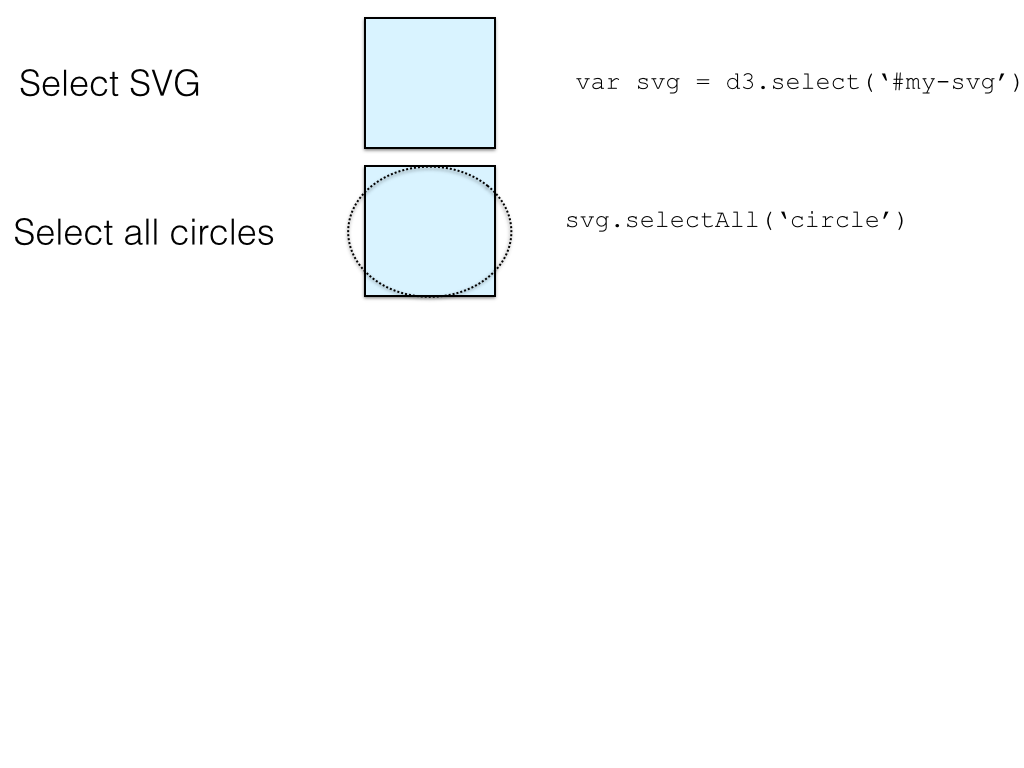
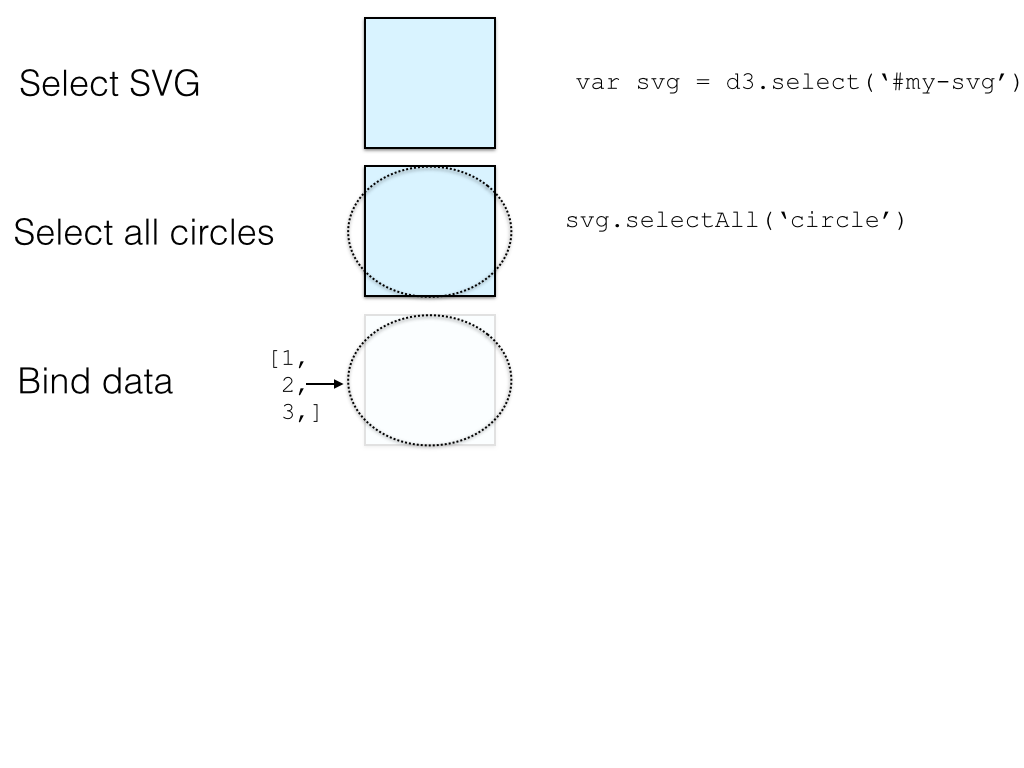
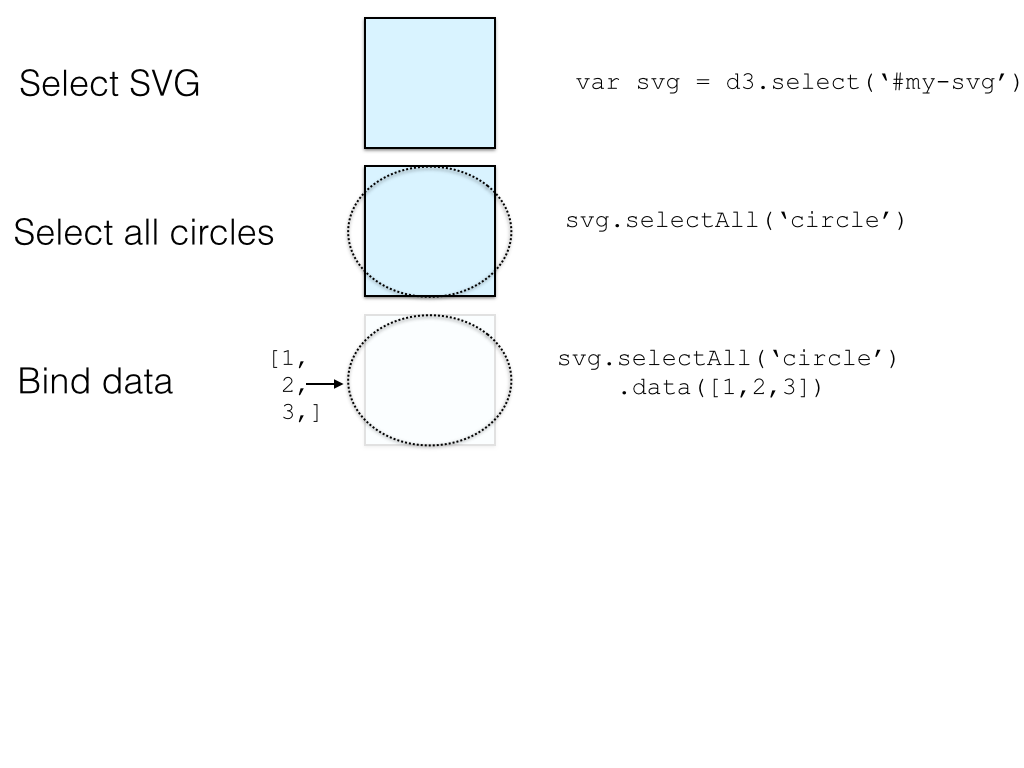
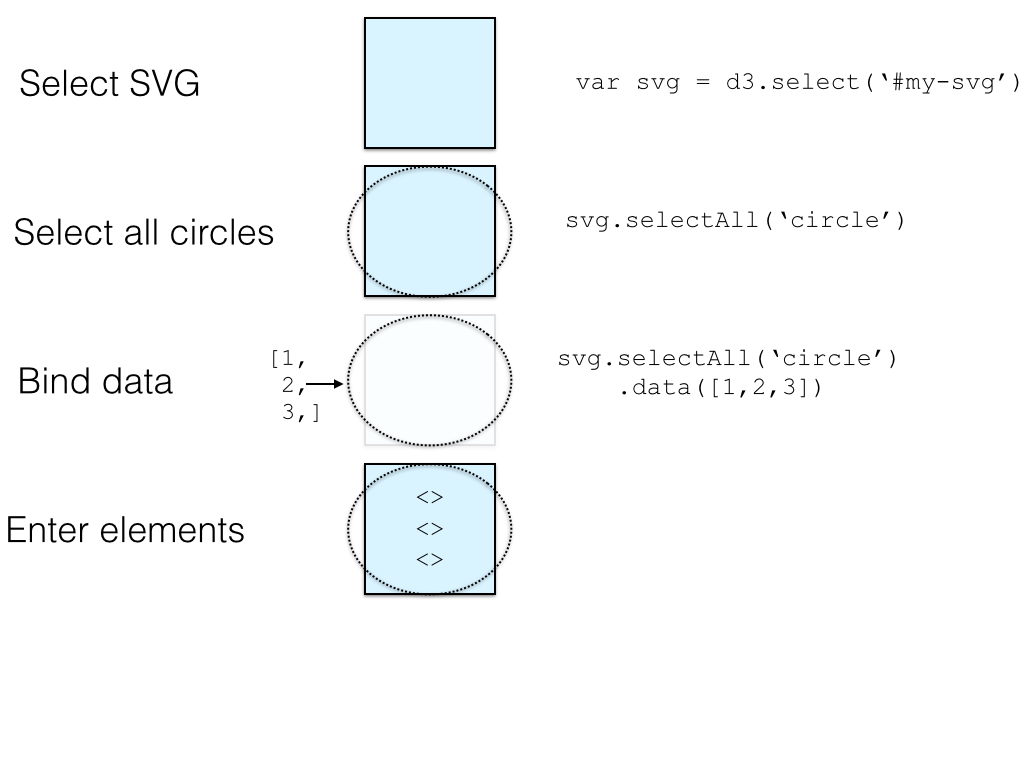
mySvg.selectAll('circle')
    .data([1,2,3]) // binds data to selection
Enter elements
mySvg.selectAll('circle')
    .data([1,2,3])
    .enter() // returns elements in data not on page
Exit elements
mySvg.selectAll('circle')
    .data([1,2,3])
    .exit() // returns elements on page not in data
Using .call()
Write a function to do your positioning
var circleFunc = function(circle) {
    circle.attr('r', 15)
          .attr('fill', 'blue')
          .attr('x', function(d) {d * 50})
          .attr('class', 'shape')
}
Pass elements to your positioning function
var circles = d3.selectAll('circle').data(myData)

circles.enter().append('circle')
      .call(circleFunc)
      // Passes each circle to your function
Generalizing
var draw = function(data) {
    // Bind data you pass in
    var circles = svg.selectAll('circle').data(data)

    // Enter new elements
    circles.enter().append('circle').call(circleFunc)

    // Exit elements that may have left
    circles.exit().remove()

    // Transition all circles to new position
    svg.selectAll('circle').transition()
        .duration(1500).call(circleFunc)
}
Scales
Translate from an input domain to an output range
var scale = d3.scale.linear()
                 .domain([0,10])
                 .range([0, 100])

scale(5) // returns 50
Use built in d3.min and d3.max functions
d3.min([1,2,3]) // returns 1
var data = [{x:1, y:1},{x:2, y:2},{x:3, y:5}]
d3.max(data, function(d) {return d.y}) // returns 5
Example application
Scatterplot exercise
Fork my repo
Clone in desktop
Start your local server
cd "d3-demo"
python -m SimpleHTTPServer 8080
Assignments
Project proposals (due before next class)
d3
By Michael Freeman
d3
- 1,938


