watch this presentation live on your phone

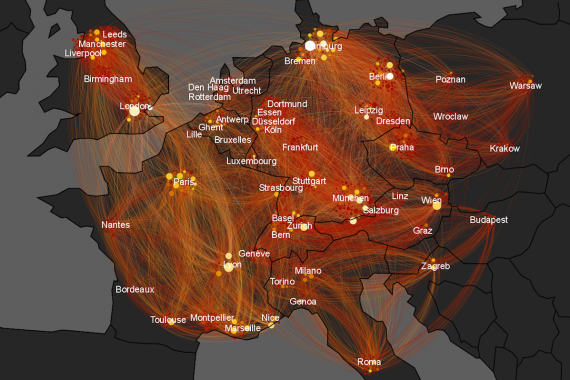
Christakis & Fowler NEJM 2007
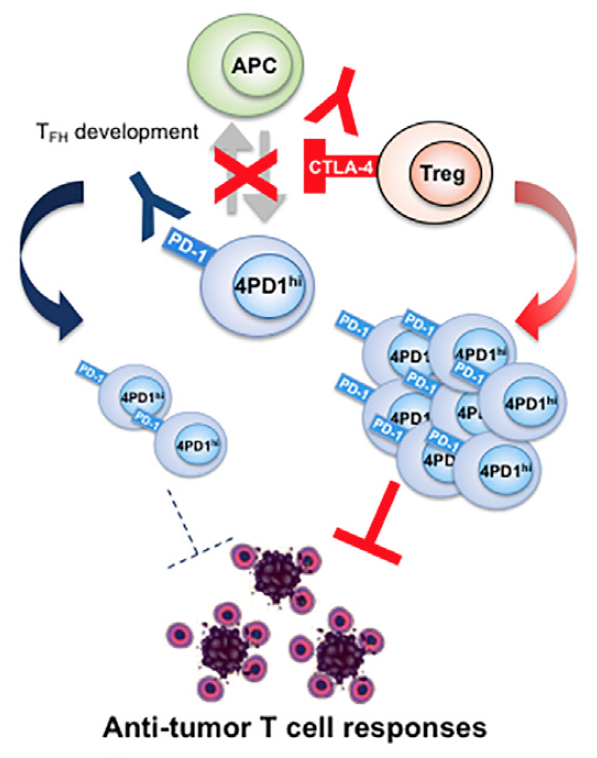
Zappasodi et. al. Cancer Cell 2018
quantitative
qualitative

eff
T
B
PD-1
CD4+
Foxp3-
T
fh
-like
CTLA
T
reg
(...maybe)
before/after
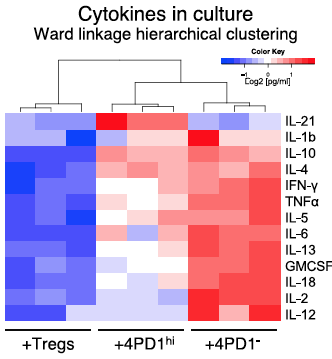
Zappasodi et. al. Cancer Cell 2018
from this:
to this:
current models = quantitative + qualitative layers
data sharing: why would I? ...no shared model
network topology helps us understand connectivity of cells
Why network analysis?
healthy immune network
what is a baseline "healthy" immune system?
is TBNK the best we can do (really)?
what drives differences between healthy individuals?


genomiccytometry.com

Van der Velde et al (2018), Swertz et al (2010) or Swertz & Jansen (2007)
are baseline immunological parameters correlated?
what is the impact of age/sex/BMI?
(how similar are healthy immune systems?)
are baseline immunological parameters in healthy individuals correlated?
age
count
bmi
PBMC
+
macrophages
+
whole blood
virus
TLR
non-mic
fungi
bacteria
n = 500
PBMC
mac
whole blood
Ig
mod
virus
TLR
non-mic
fungi
bacteria
TLR
fungi
bacteria
TLR
non-mic
fungi
bacteria
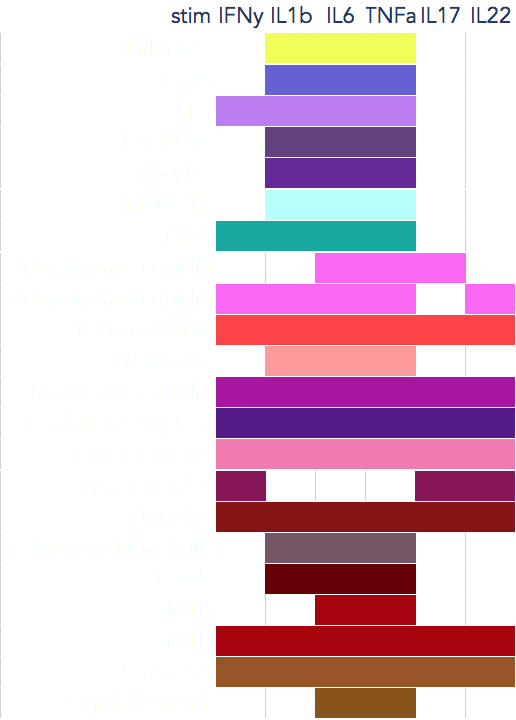
cytokines
n = 500
| IgG |
| IgA |
| IgM |
| IgG1 |
| IgG2 |
| IgG3 |
| IgG4 |
| IL-18BPx |
| Resistin |
| Leptin |
| Adiponectin |
| AAT |
| IL-18 |
| IL-1RA |
| Vitamin D |
| IL-1b |
| IL-6 |
| VEGF A |
CV
healthy people are <5% CV
PBMC
mac
whole blood
Ig
mod
virus
TLR
non-mic
fungi
bacteria
TLR
fungi
bacteria
TLR
non-mic
fungi
bacteria
cytokines
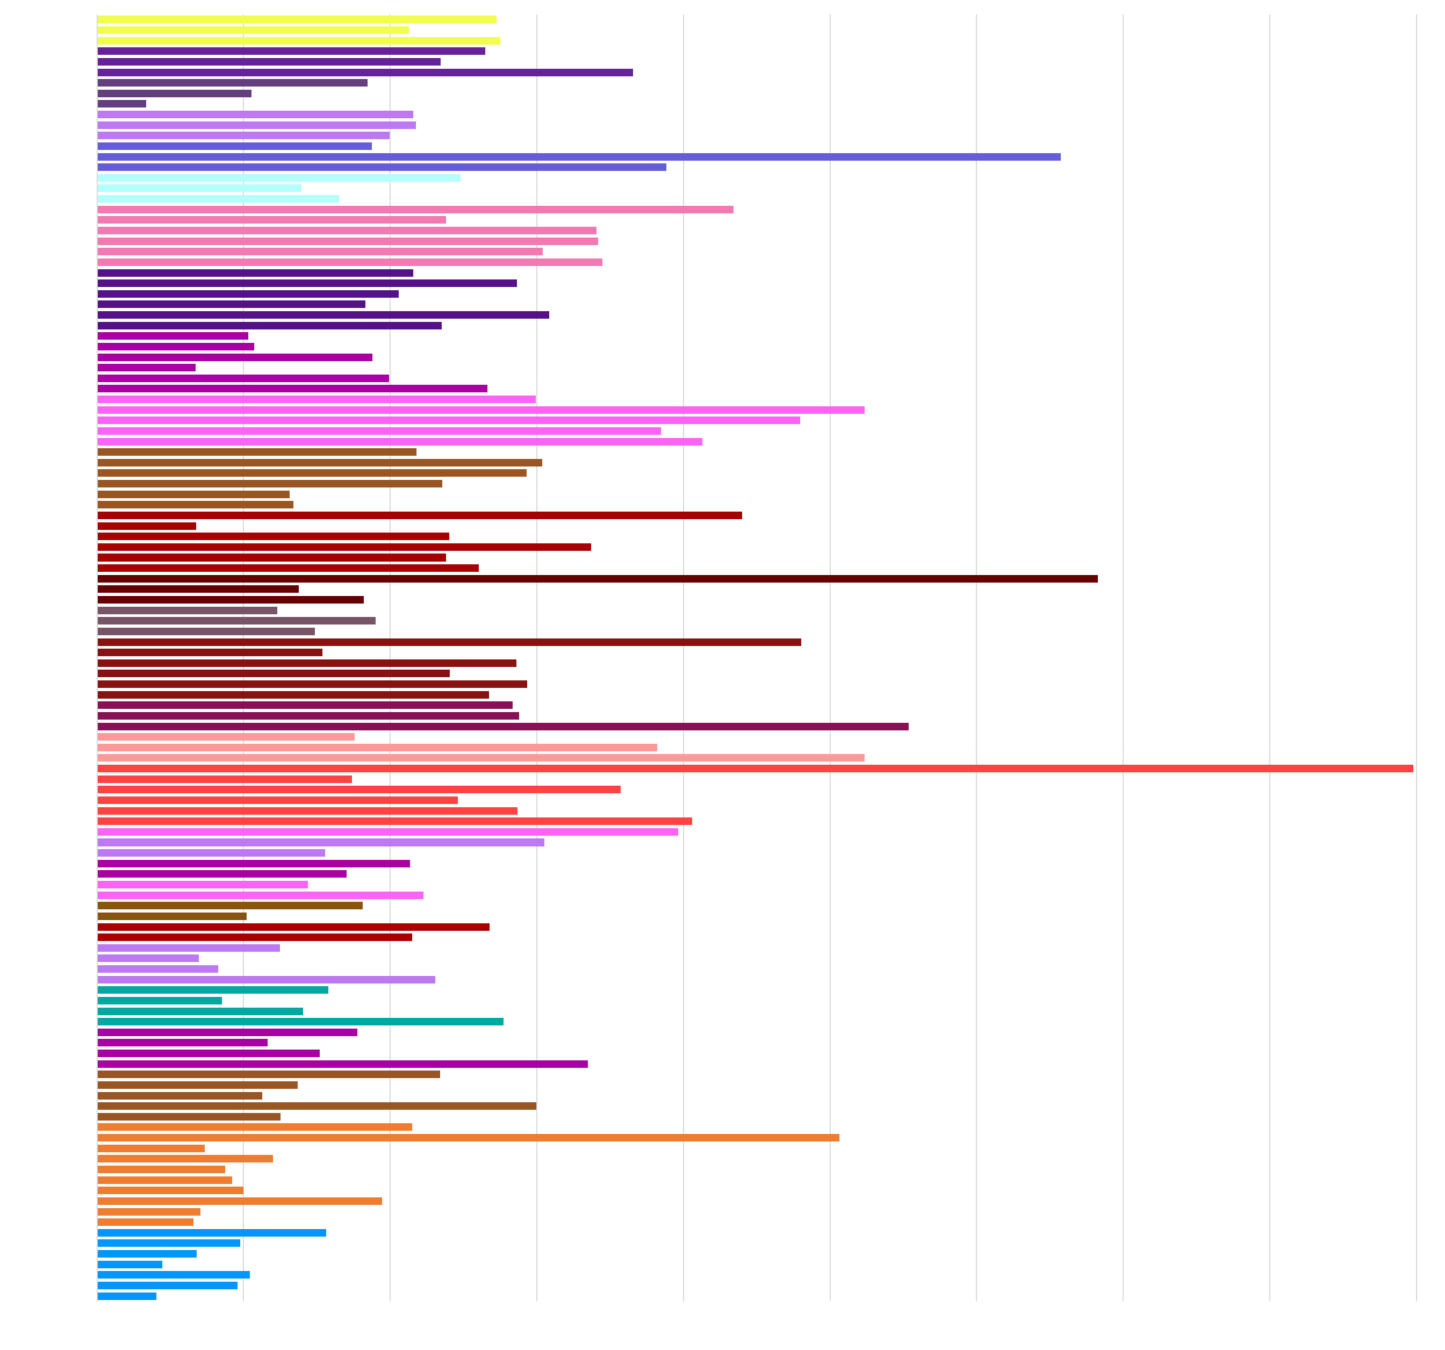
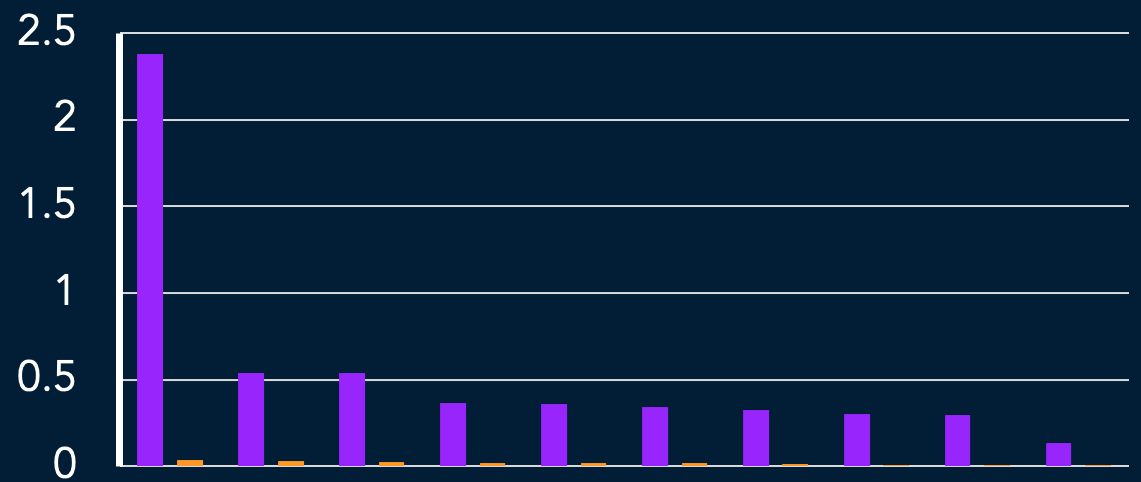
cytokines: 8 PCs >60% of variance
Spearman's rank correlations

are baseline immunological parameters in healthy individuals correlated?
pbmc mac whole blood
bacteria fungi TLR non-mic virus
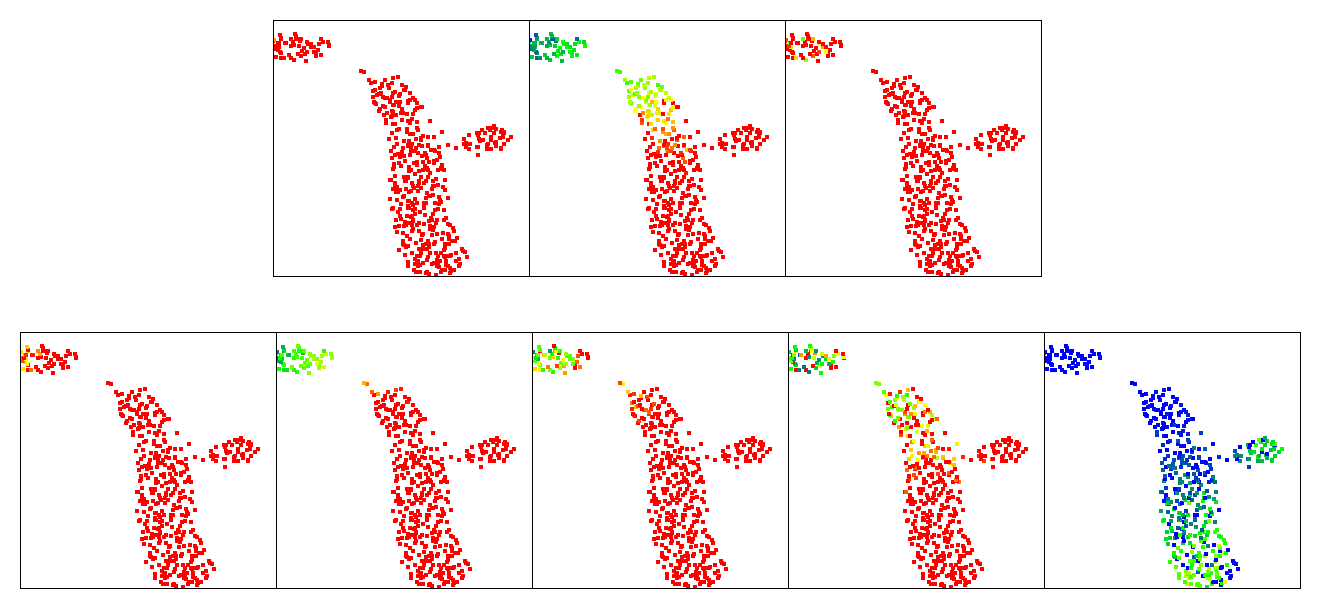
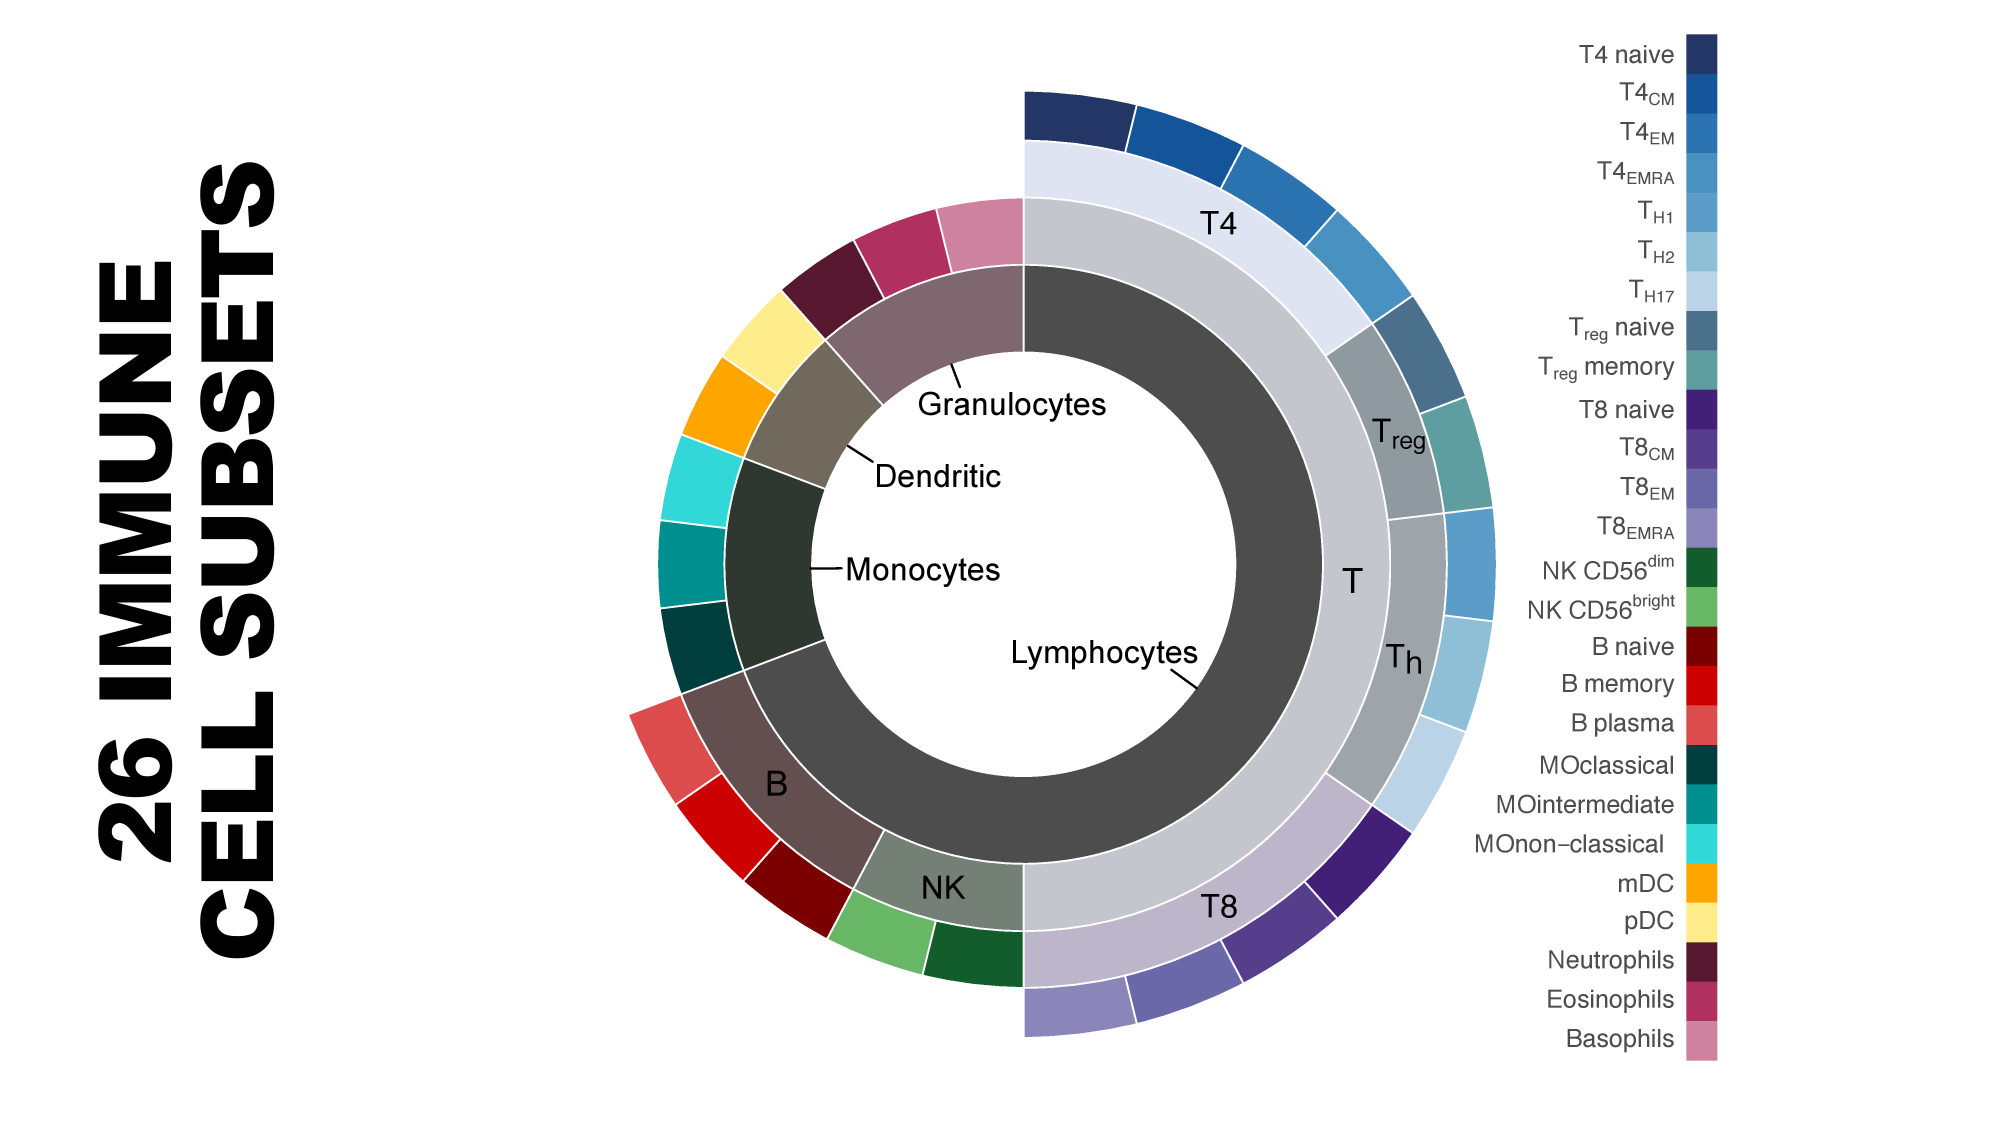
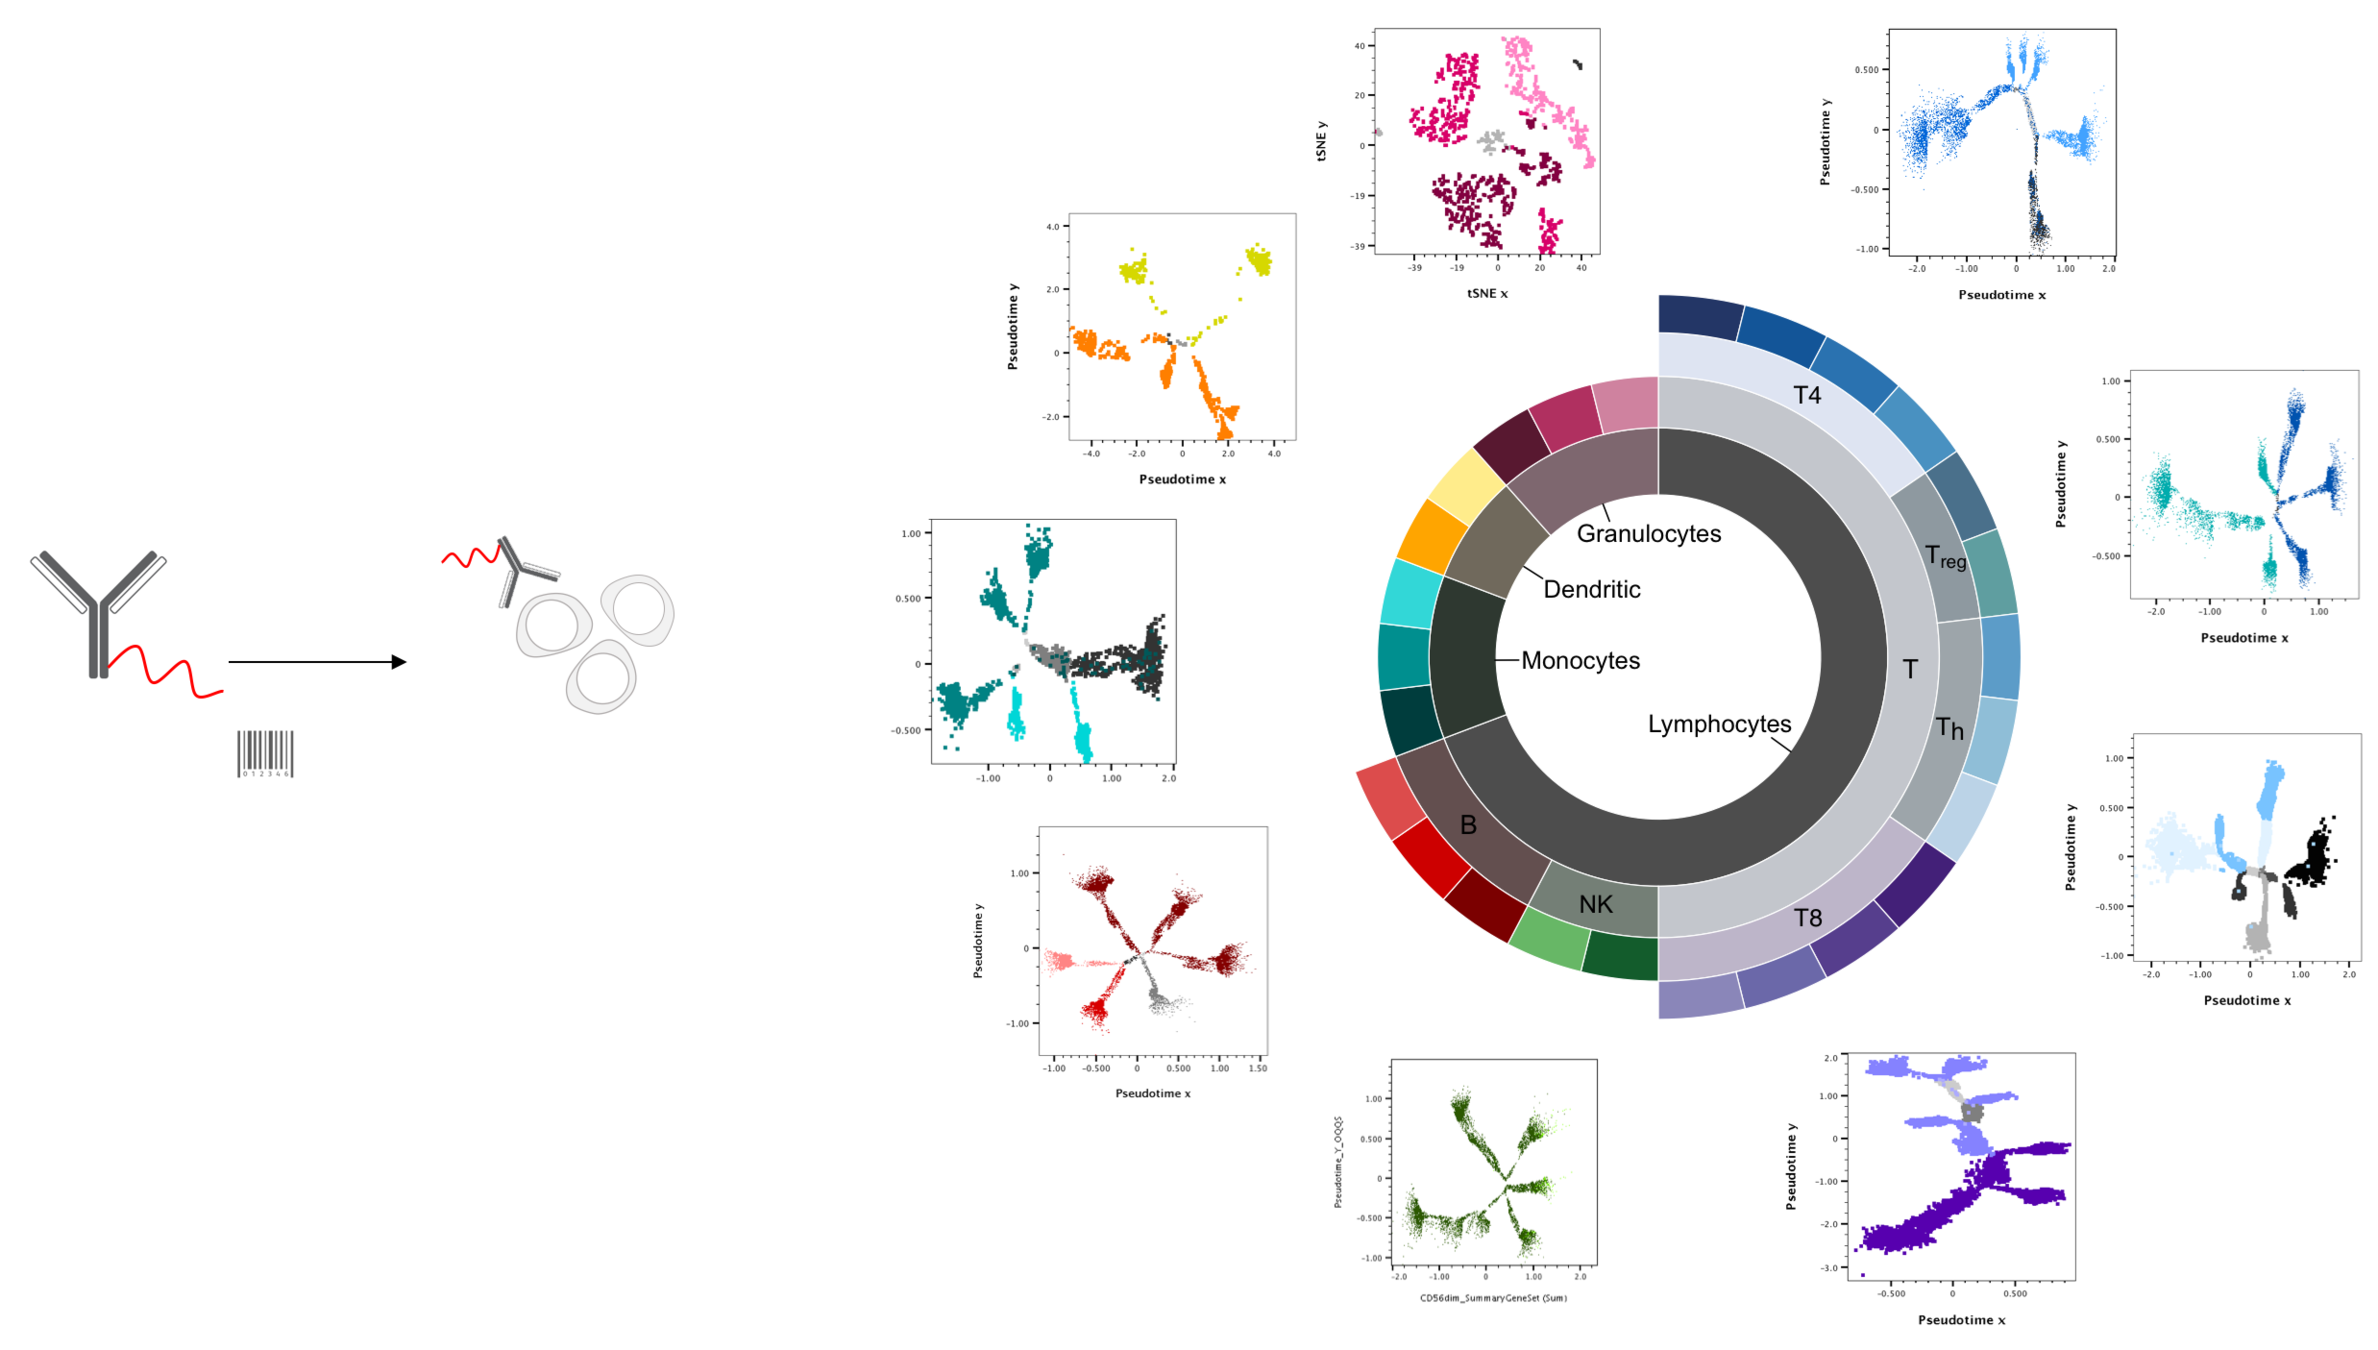
UMAP
network analysis (a.k.a. graph theory)
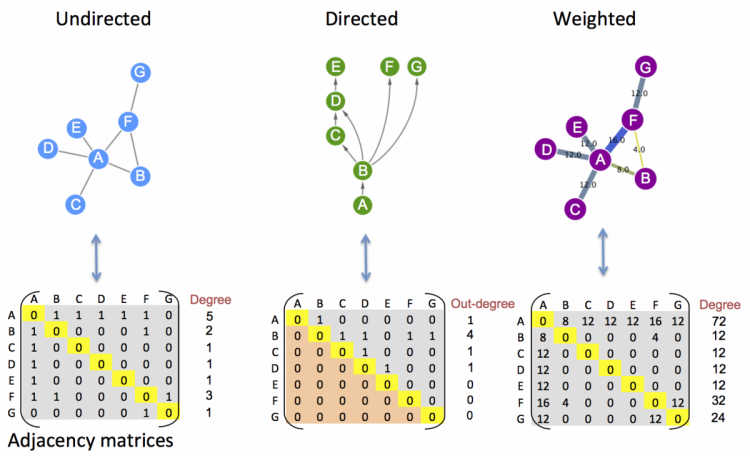
undirected
directed
weighted
adjacency matrix
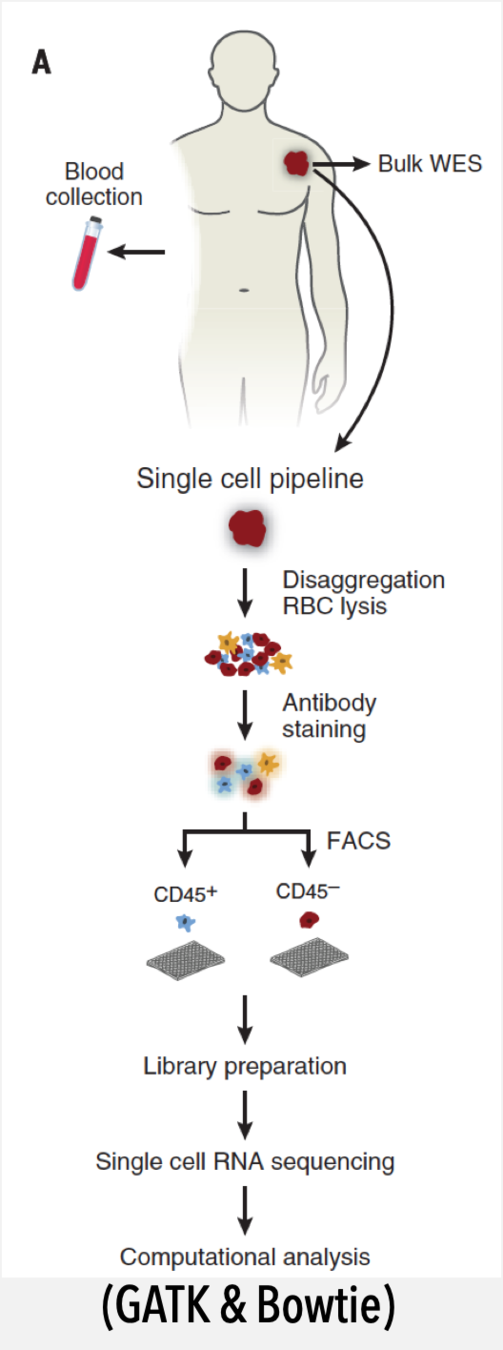
- Classification (nodes)
- sequence-tagged antibody dataset
- classyDL
2. Interaction list (edges)
- 1,800 known, literature-supported interactions receptor- ligand interactions

Ramilowski et al., 2015
Mi et. al. 2019
Krzywinski, M. et al. 2009
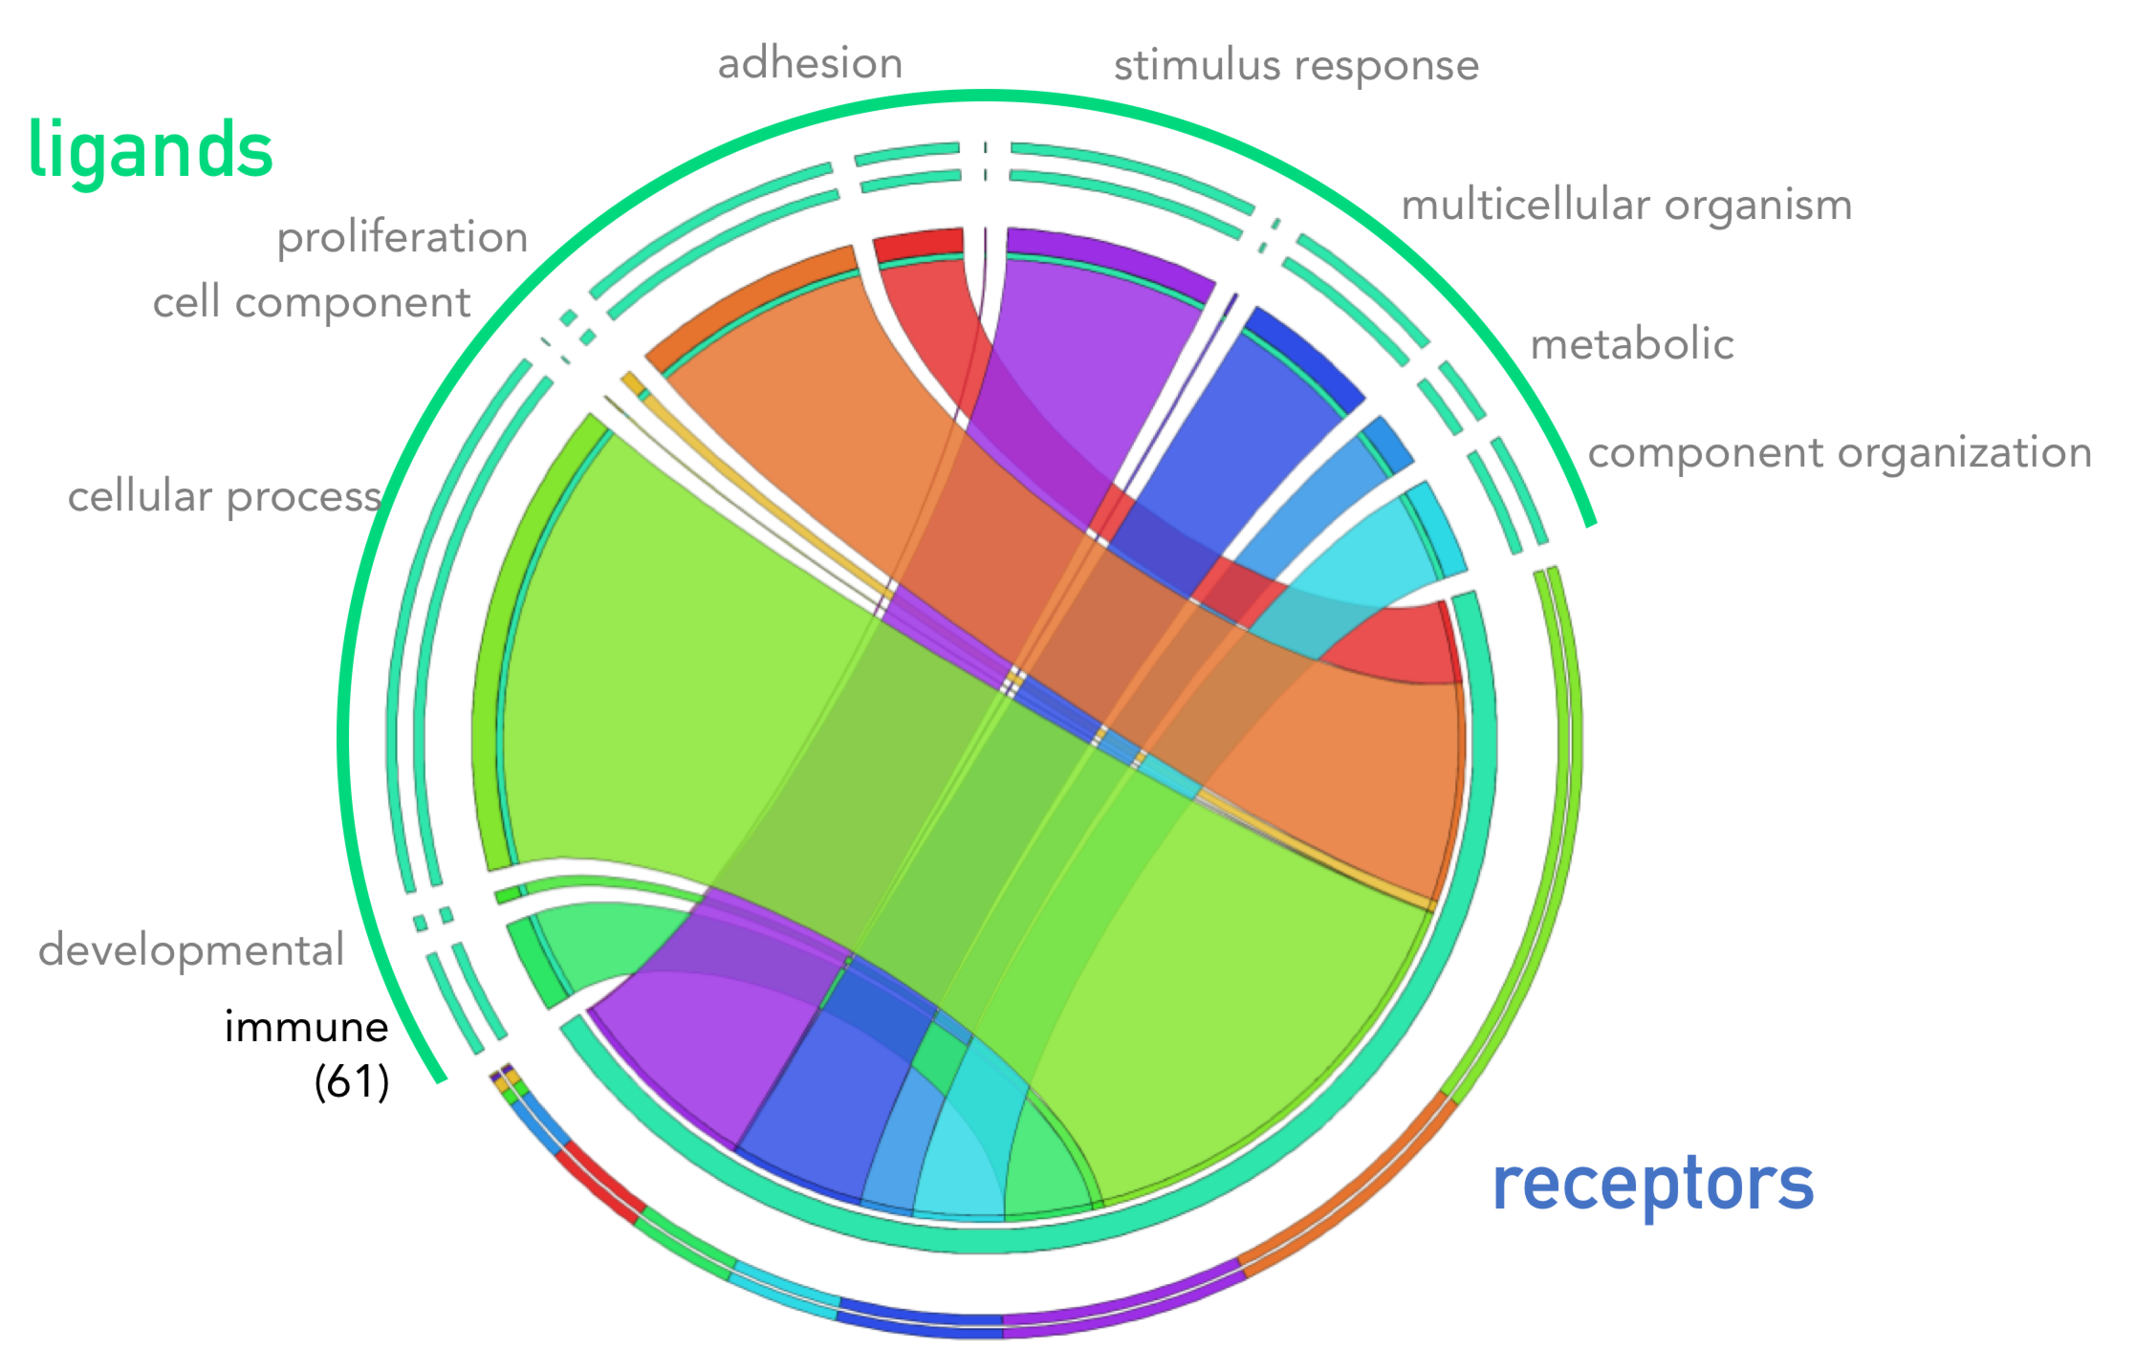
1894 interactions
3. Calculate interaction scores (weight)
= \frac{1}{n_{celltype1}} \sum\limits_{i\epsilon \; cell type1} e_{i,receptor} \times \frac{1}{n_{celltype2}} \sum\limits_{i\epsilon \; cell type2} e_{i,ligand}
interaction score
e_{i,j} =
expression of gene j in cell i
n_{c} =
number of cells of cell type c
Kumar et al. Cell Reports 2018
(receptor, ligand,
celltype1, celltype2)
4. Network Analysis
| measure | what | biological |
|---|---|---|
| dominant pairwise interactions | intrxn score > 0.005 | dominant interactions |
| degree | # of connections to other nodes | central players which mediate information or distributed? |
| harmonic closeness centrality | degree to which nodes stand between each other (shortest paths) | most influential nodes |
| betweenness centrality | chokepoints of information transfer in networks | find a weakly connected cell type who still indispensable to certain transactions |
| authority | how valuable the information stored in that node | information quality of cell type (dx |
| hub | quality of nodes links | haves/have-nots |
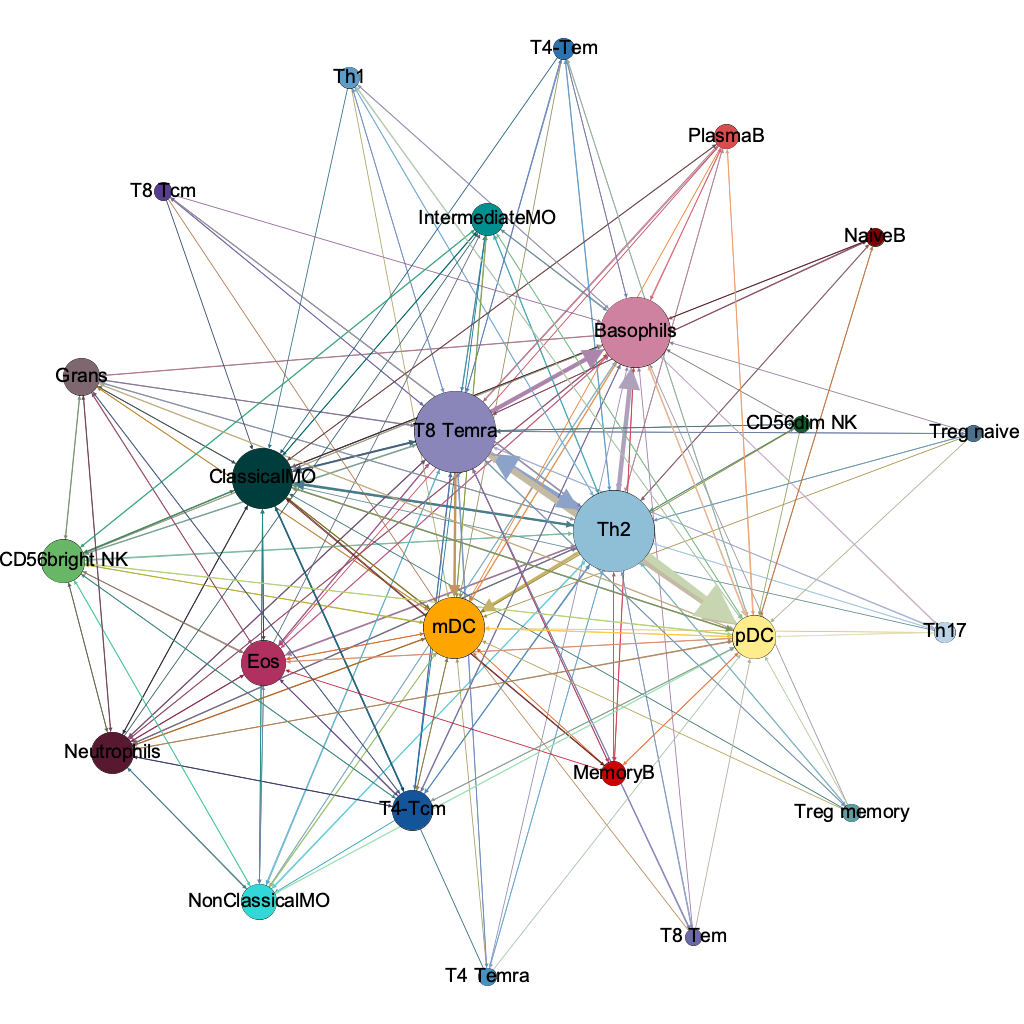
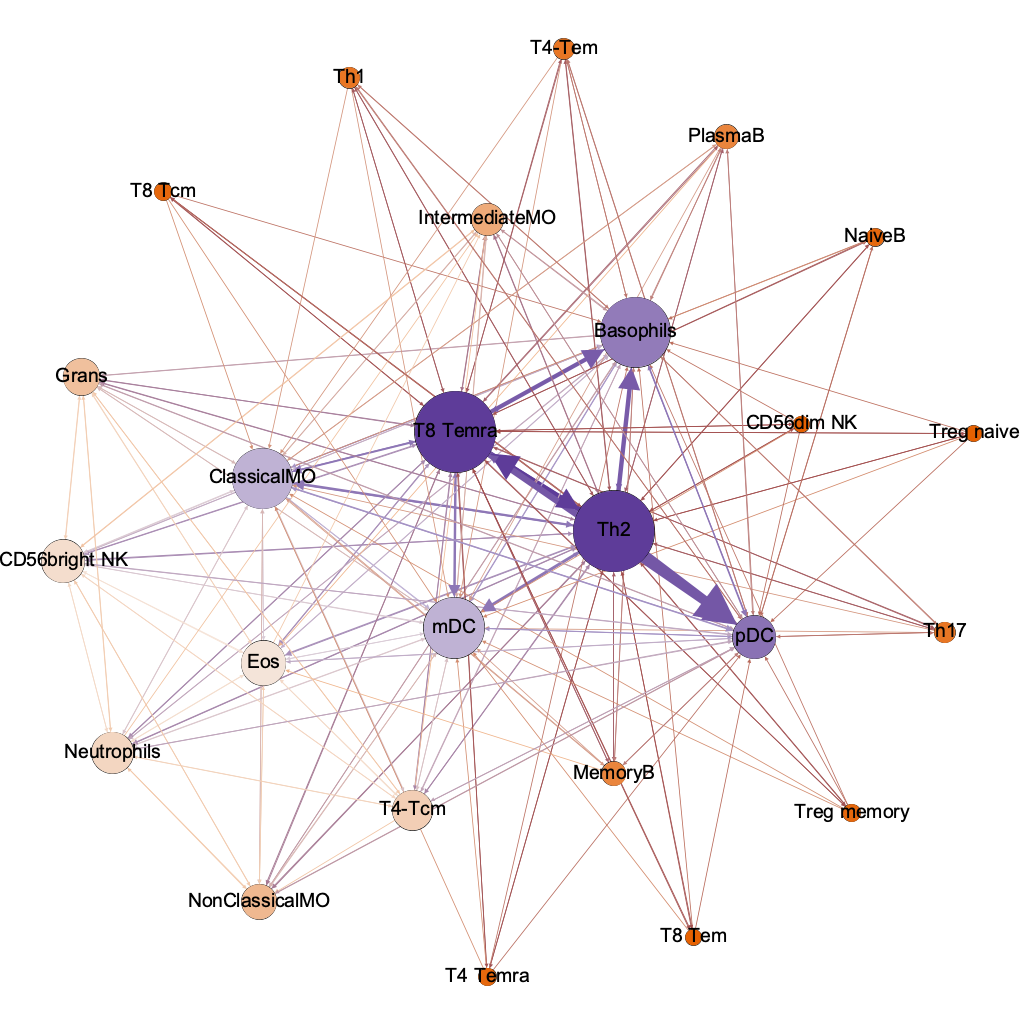
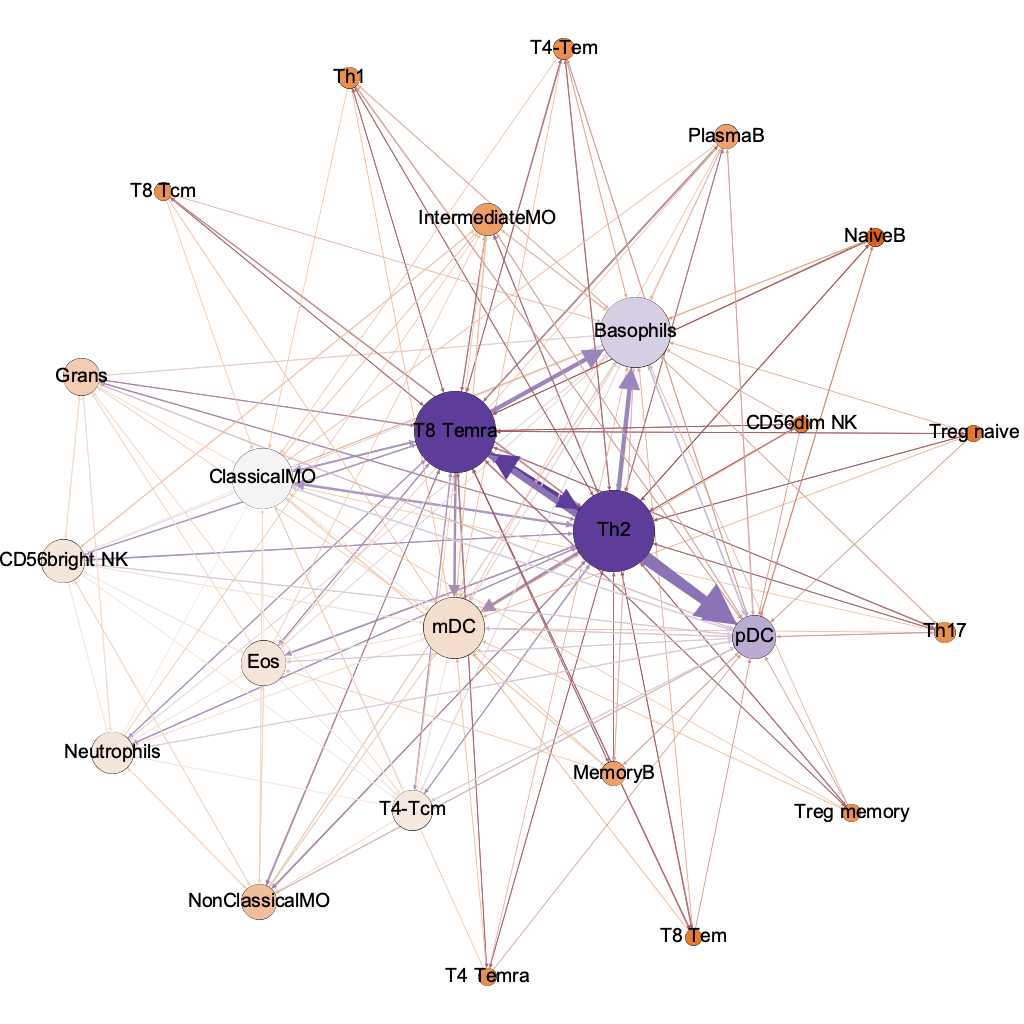
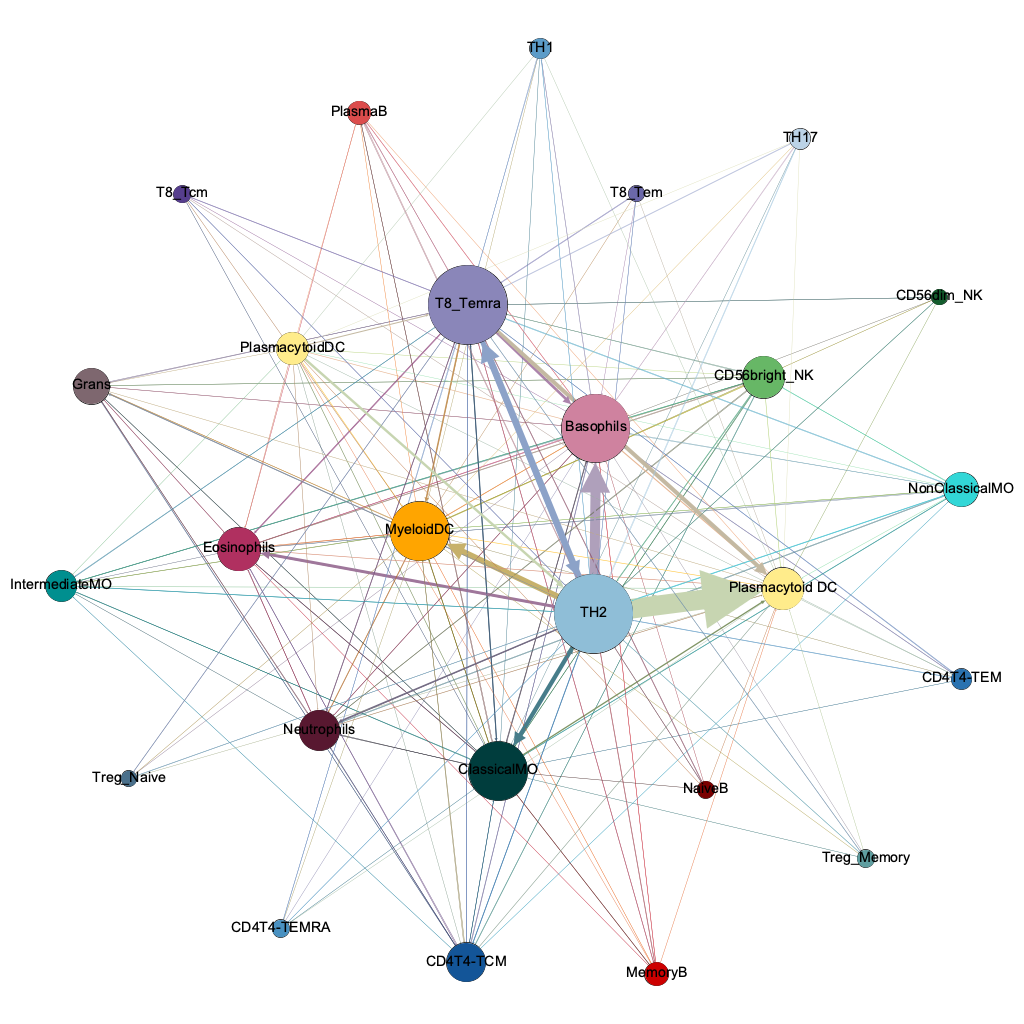
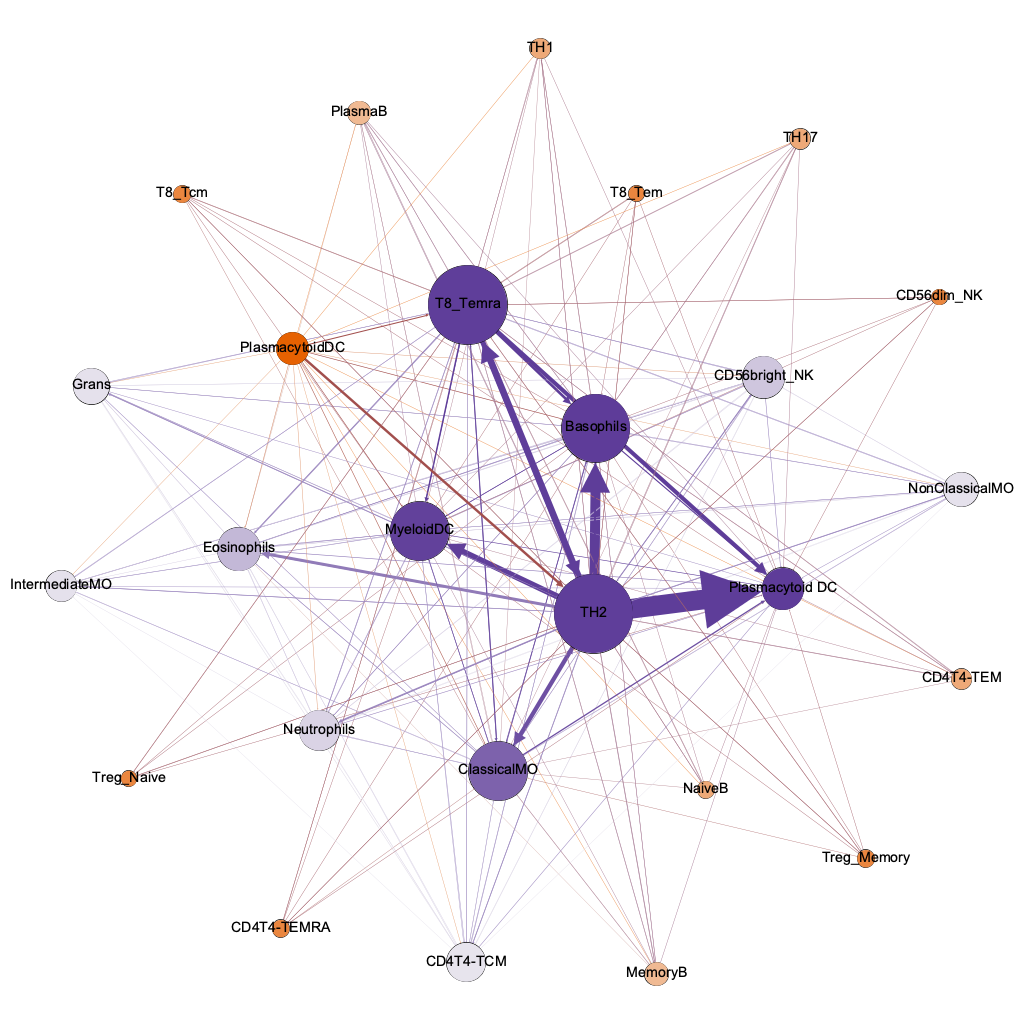
T8 Temra
Basophils
ClassicalMO
mDC
pDC
Th2
Th2
Basophils
ClassicalMO
mDC
pDC
Temra
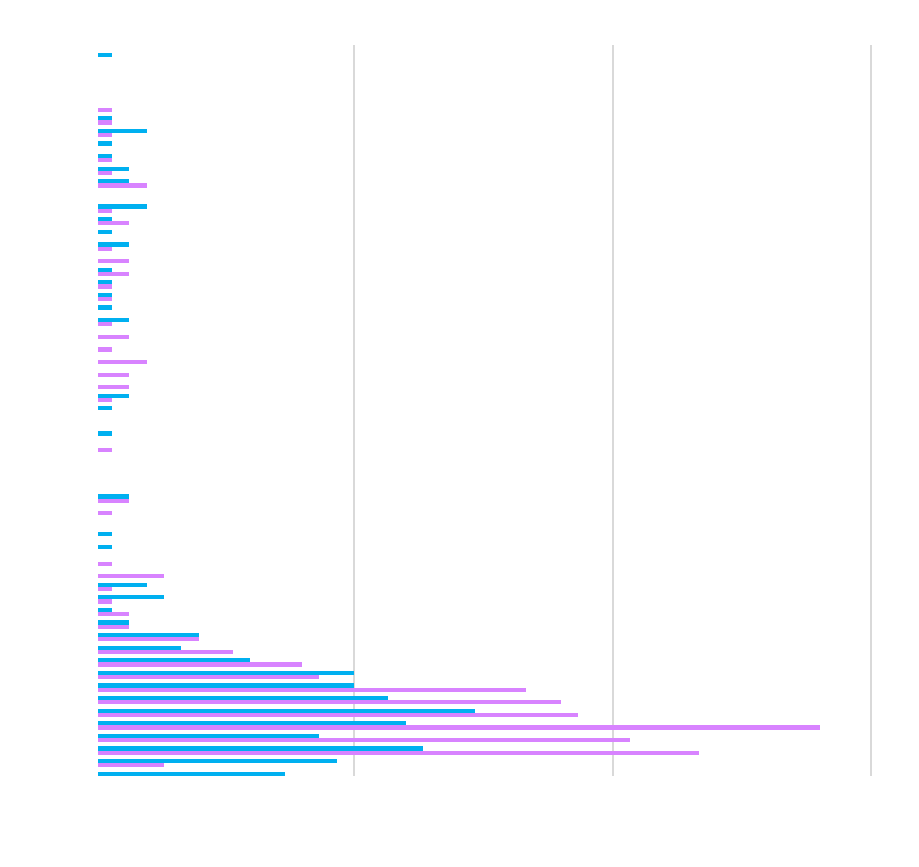
strongest
pairwise
interaction threshold 0.00001
254/600 possible
degree
(connectivity)
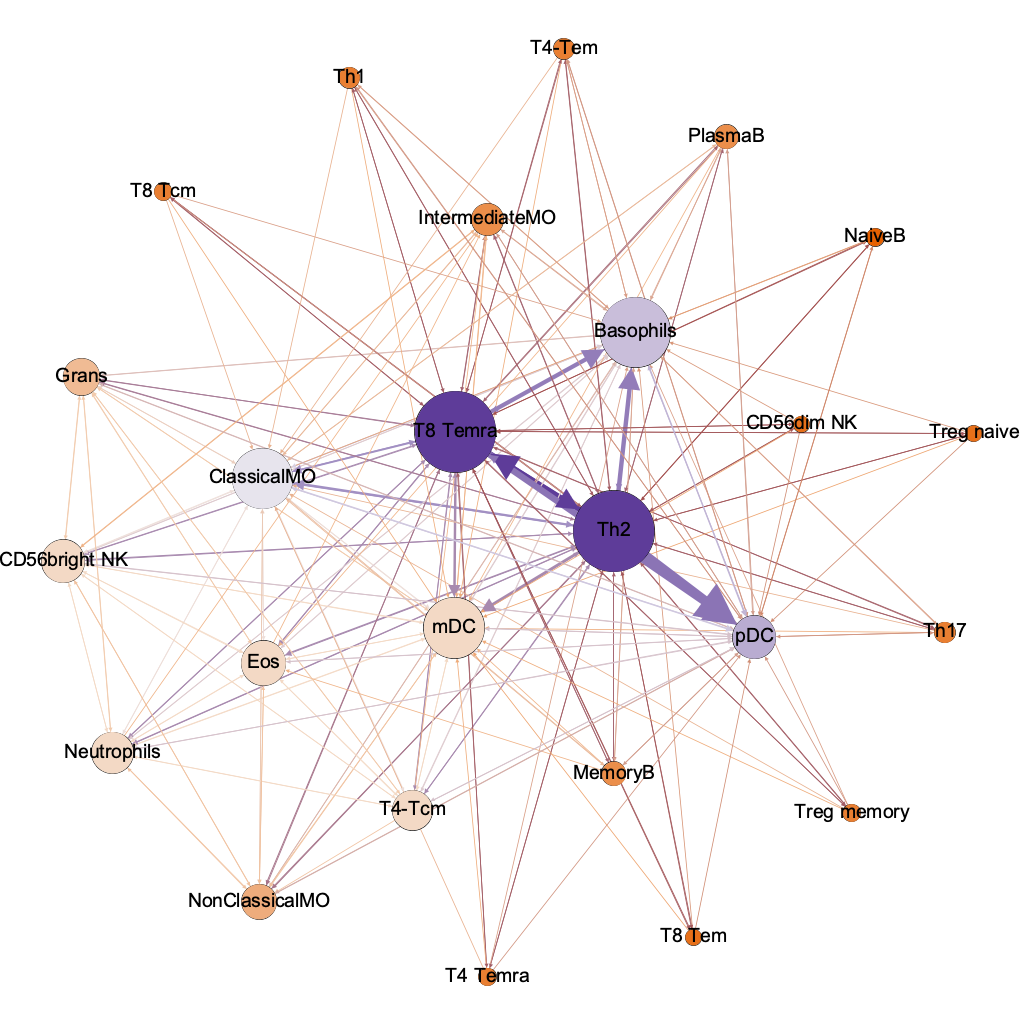
harmonic
closeness
(influencers)
lo hi
between-
ness
(chokepoints)
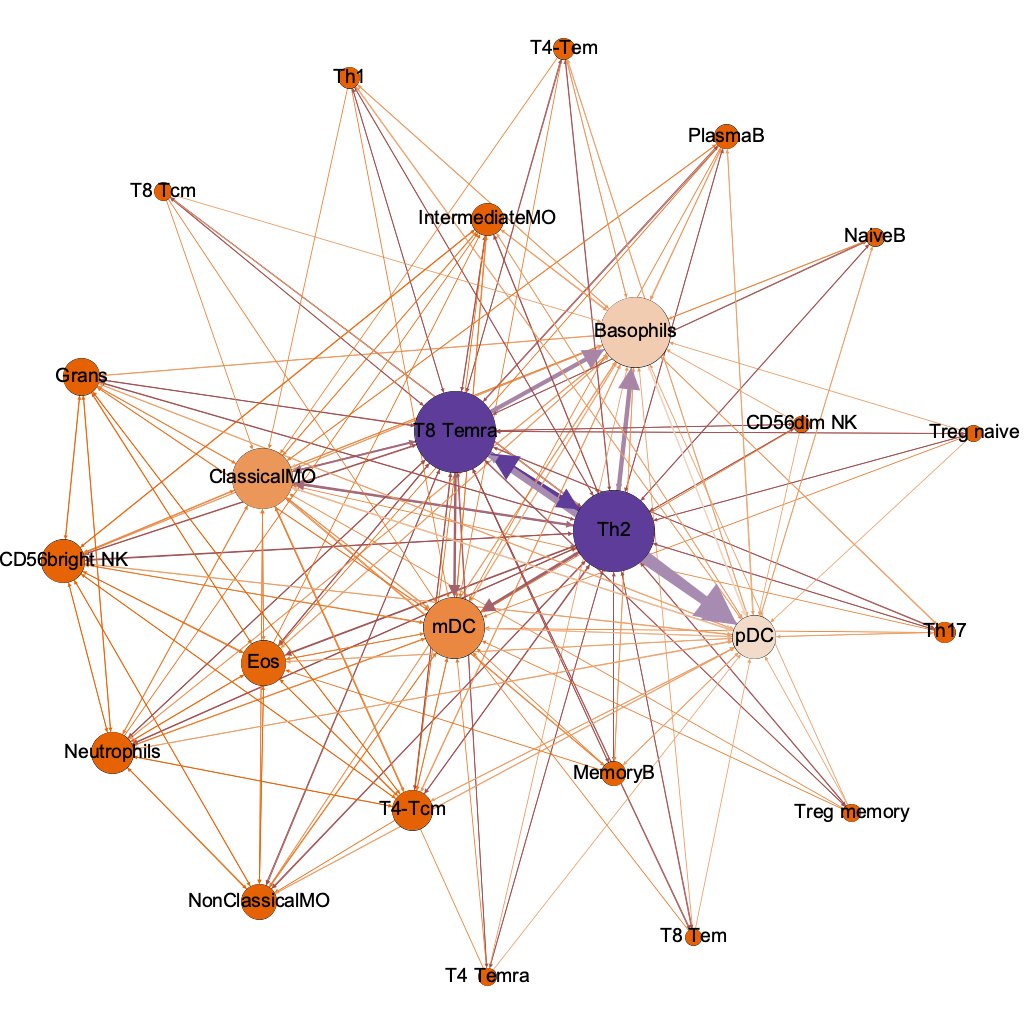
interaction threshold 0.00001
254/600 possible
4. Network Analysis
| measure | what | biological |
|---|---|---|
| dominant pairwise interactions | intrxn score > 0.005 | dominant interactions |
| degree | # of connections to other nodes | central players which mediate information or distributed? |
| harmonic closeness centrality | degree to which nodes stand between each other (shortest paths) | most influential nodes |
| betweenness centrality | chokepoints of information transfer in networks | find a weakly connected cell type who still indispensable to certain transactions |
| authority | how valuable the information stored in that node | information quality of cell type (dx) |
| hub | quality of nodes links | haves/have-nots |
authority
(info quality)
hub
(quality of connections)
lo hi
the humble basophil = best dx
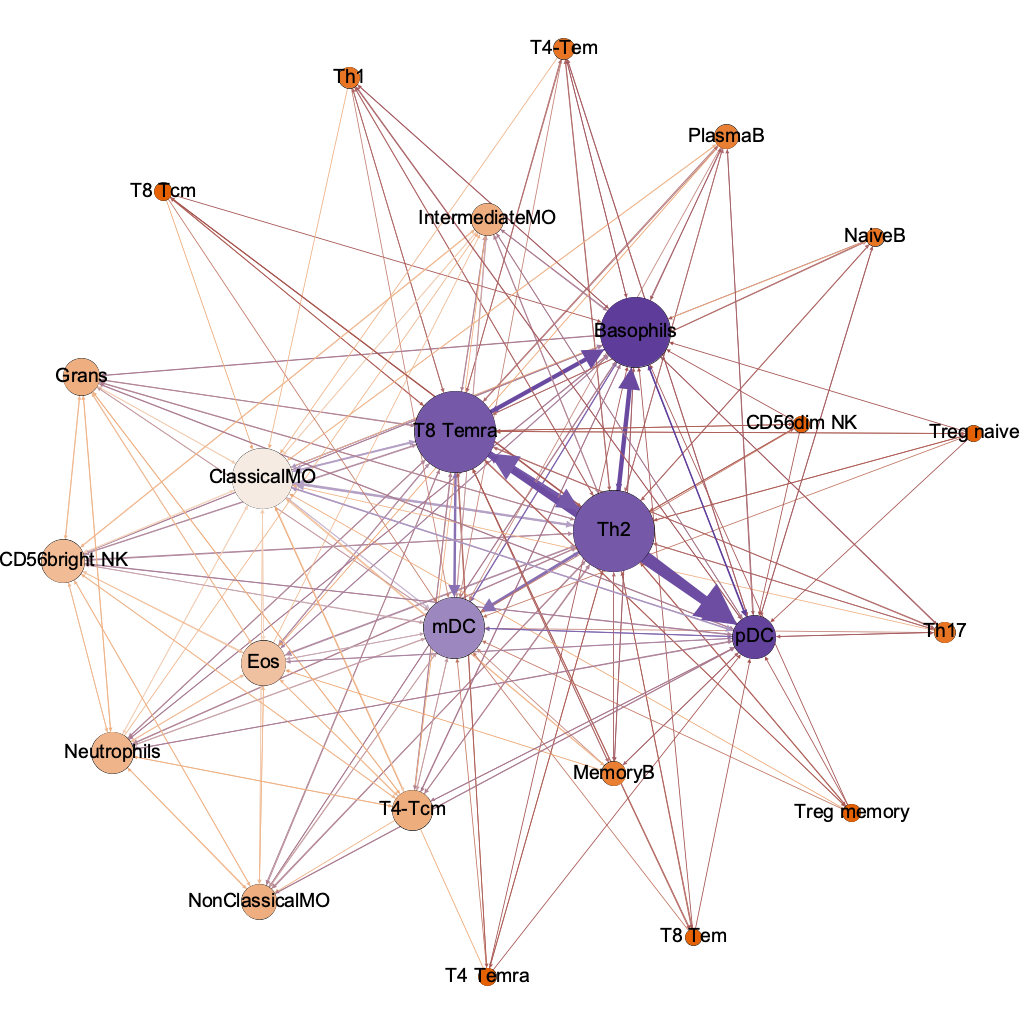
interaction threshold 0.00001
254/600 possible
melanoma immune network
Tirosh & Izar et. al. Science 2016
data:
4645 single cells from 19 patients
includes malignant, stromal, immune, endothelial
cell classification:
k-finder
k-means
GSEA

I/O response rate <30%
combination I/O + need for dx
Turgeon et. al. (2018)
PBMC gene lists from genomic cytometry.com
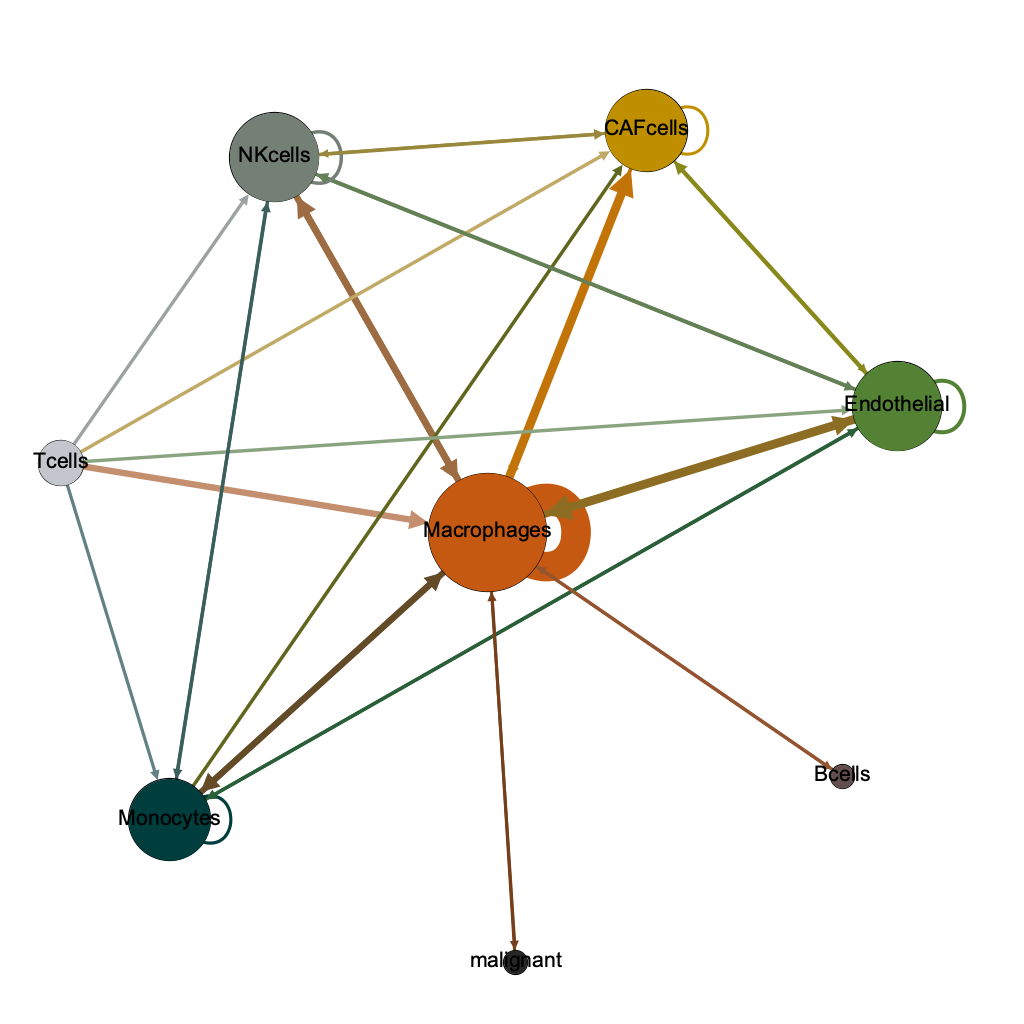
melanoma
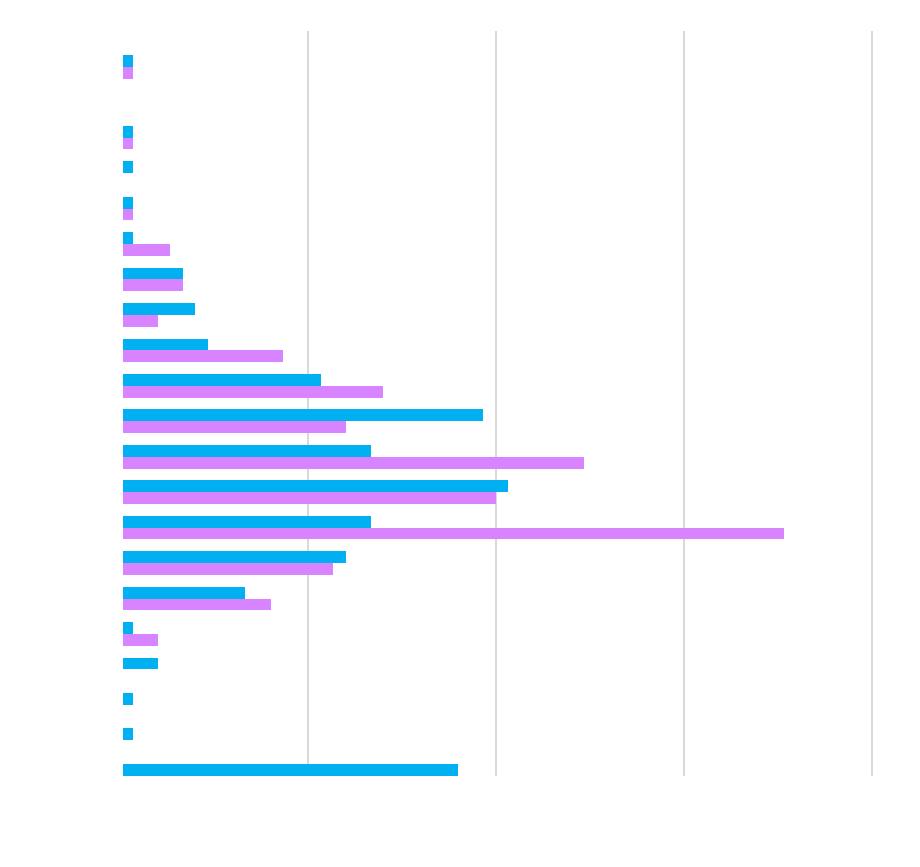
strongest interactions are 50X healthy
healthy
intrxn score
Text
v.
interaction threshold 0.01
33/64 possible
Macrophages
CAF cells
Endothelial
Macrophages (!)
Monocytes
NK cells
strongest
pairwise
Endothelial
NK cells
T cells
Macrophages
Macrophages
Macrophages
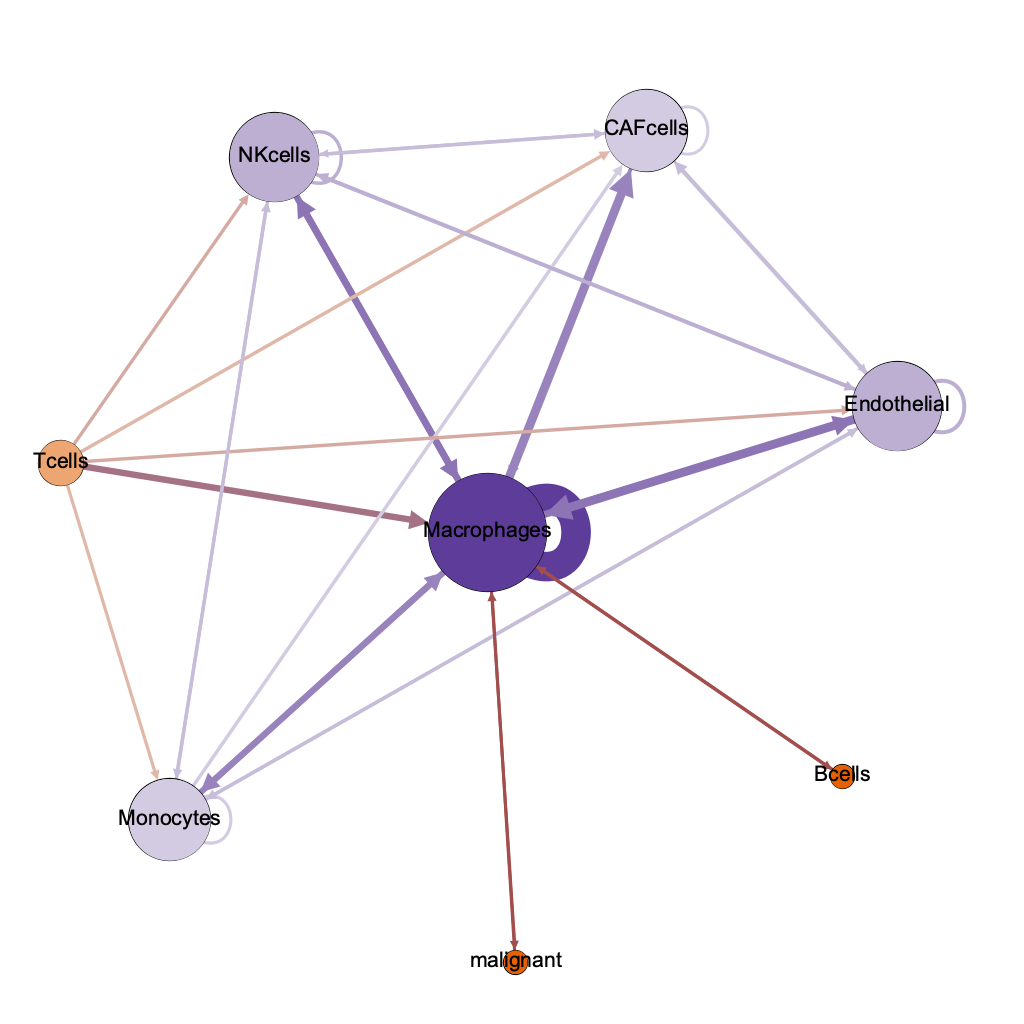
lo hi
cells with highest authority =
interacting with malignant
Text
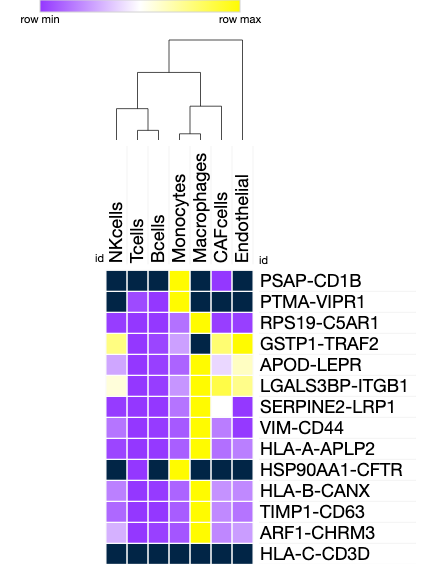
1257 cells
| R-L | role? |
|---|---|
| PSAP-CD1B | reported overepression in mel |
| PTMA-VIPR1 | vasoactive intestinal peptide |
| GSTP1-TRAF2 | biomarker for |
| LGALS3BP-ITGB1 | integin, necessary for vasculogenic mimicry |
| HSP90AA1-CFTR | tumor aggression |
molecular basis of malignant interactions
CD8
CD3
Mel
DAPI
image: Feng et. al. 2015
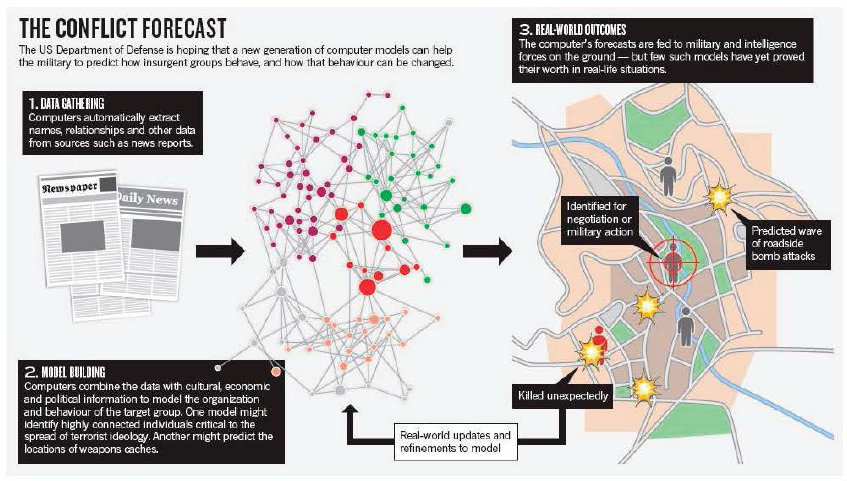
Grandjean, 2015.
Future U.S. Workforce for Geospatial Intelligence, 2013
spaceflight immune network
data:
All of our eggs are in one basket / no plan B
The continuation of the human species urgently requires us to expand into the solar system and then become an extrasolar species
There is work in progress on creating a “do not disturb” region of the genome ...without phenotype and functional cellular understanding
spaceflight immune network
poorly understood why microgravity and lack of gravity causes immune dysregulation
+
Very small sample sizes and resource intense
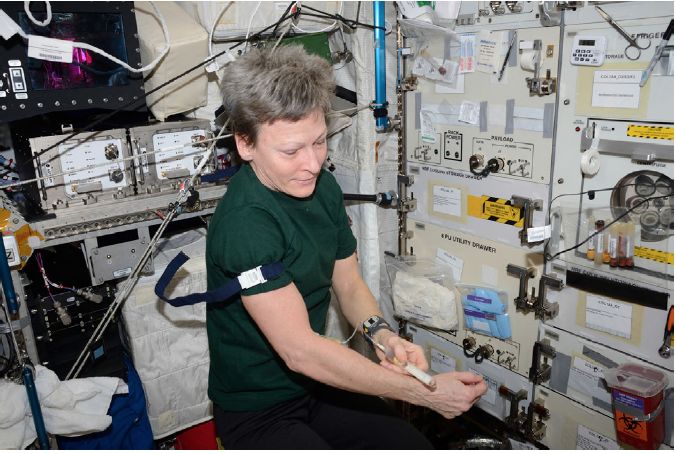
Peggy Whitson
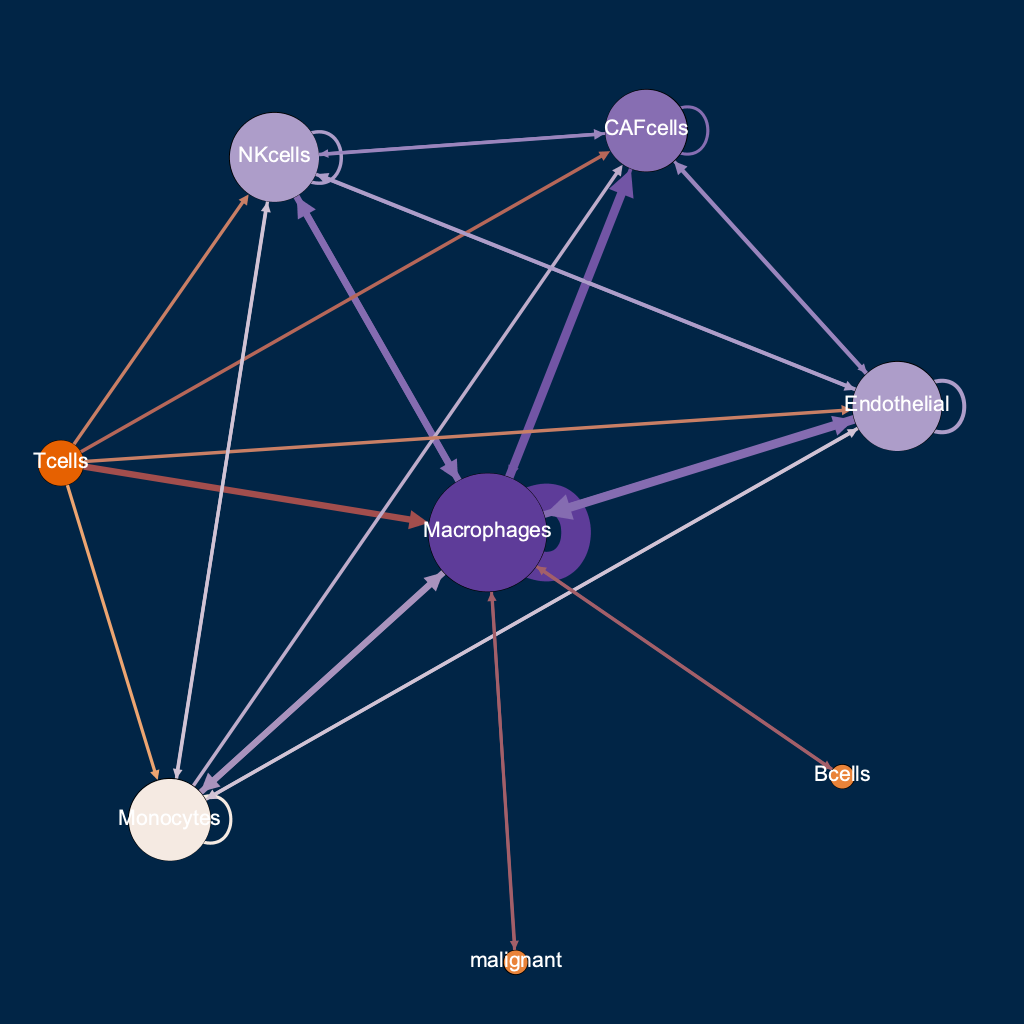
spaceflight immune network
mapped observations for 6 months of spaceflight onto healthy network
fold change v. healthy as multipliers to receptor-ligand scores
Bigley Physiology 2018
Crucian Frontiers in immunology 2018
Mehta Cytokine 2013
Crucian Int J Gen Med 2016
Crucian J Allergy Clin Immunol Pract 2016
Cogoli Environ Med 1993
Sonnenfeld Acta Astronaut 1994
Guéguinou J Leukoc Biol 2009
Konstantinova J Leukoc Biol 1993
Crucian NPJ Mirogravity 2015
Mehta NPJ Mirogravity 2017
Morukov Acta Astronaut 2011
Crucian J Interferon Cytokine Res 2014
Garrett-Bakelman et. al. Science 2019
lo hi
practical tools
Bakker et. al. Nat Immunol 2018
exchangeable models with data backing that capture quantitative + qualitative data


analysis + publication = software product
Bakker et. al. Nat Immunol 2018
exchange information about individual cells in the network to drive deeper functional understanding of these nodes across laboratories

visualizations + source
mike.d.stad@gmail.com
Syzygy Forces
By Michael Stadnisky

