


Monica Wojciechowska
Frontend developer + data visualization engineer. Pierogi lover + world traveller.
Hi, I'm Monica
Hi, I'm Monica
}
}
}
but times have changed and...
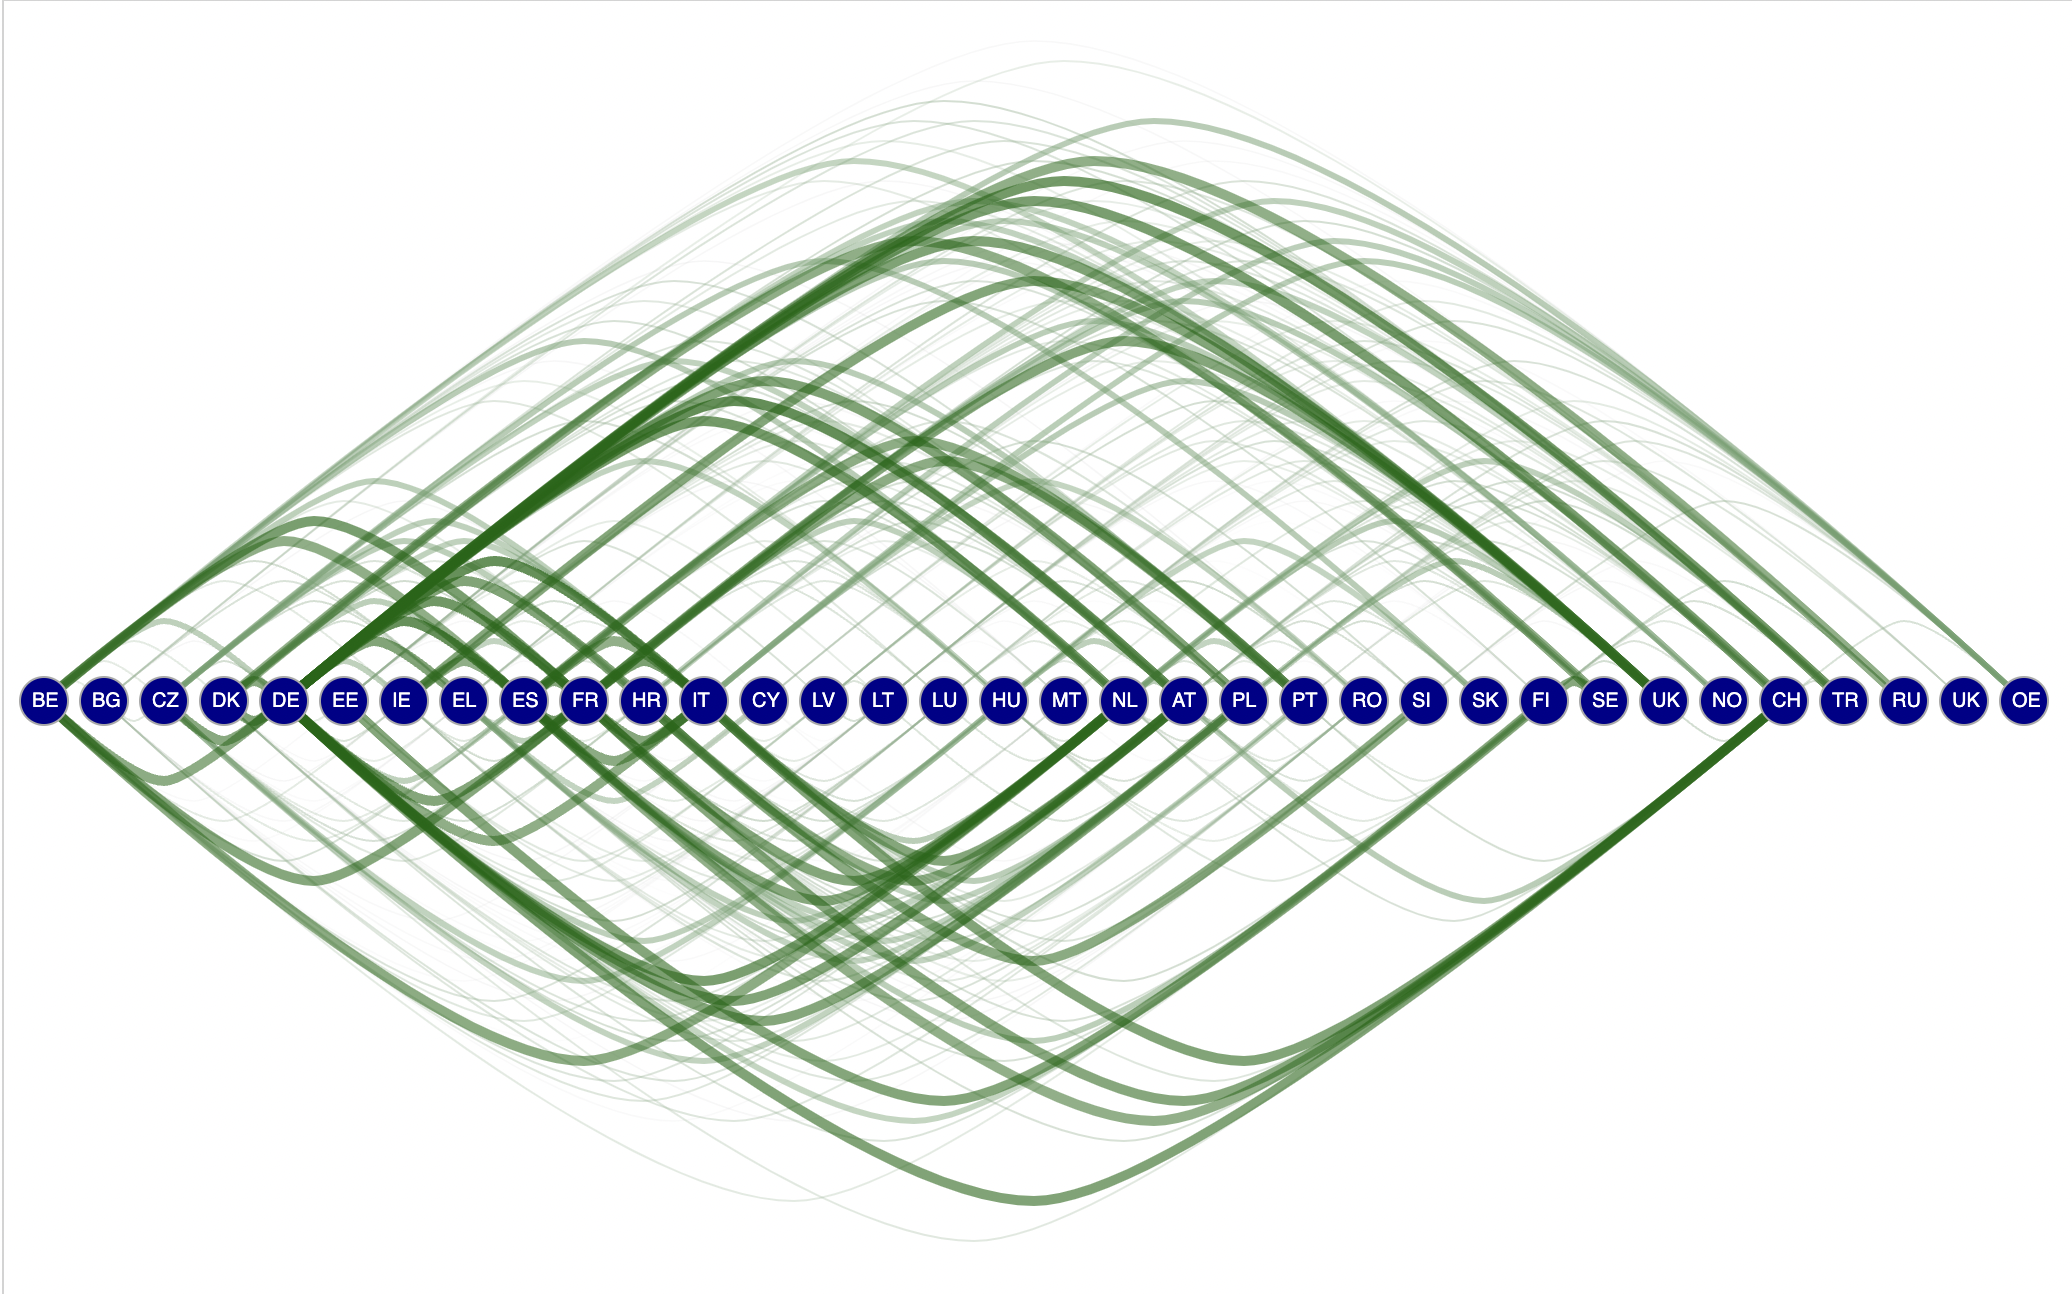
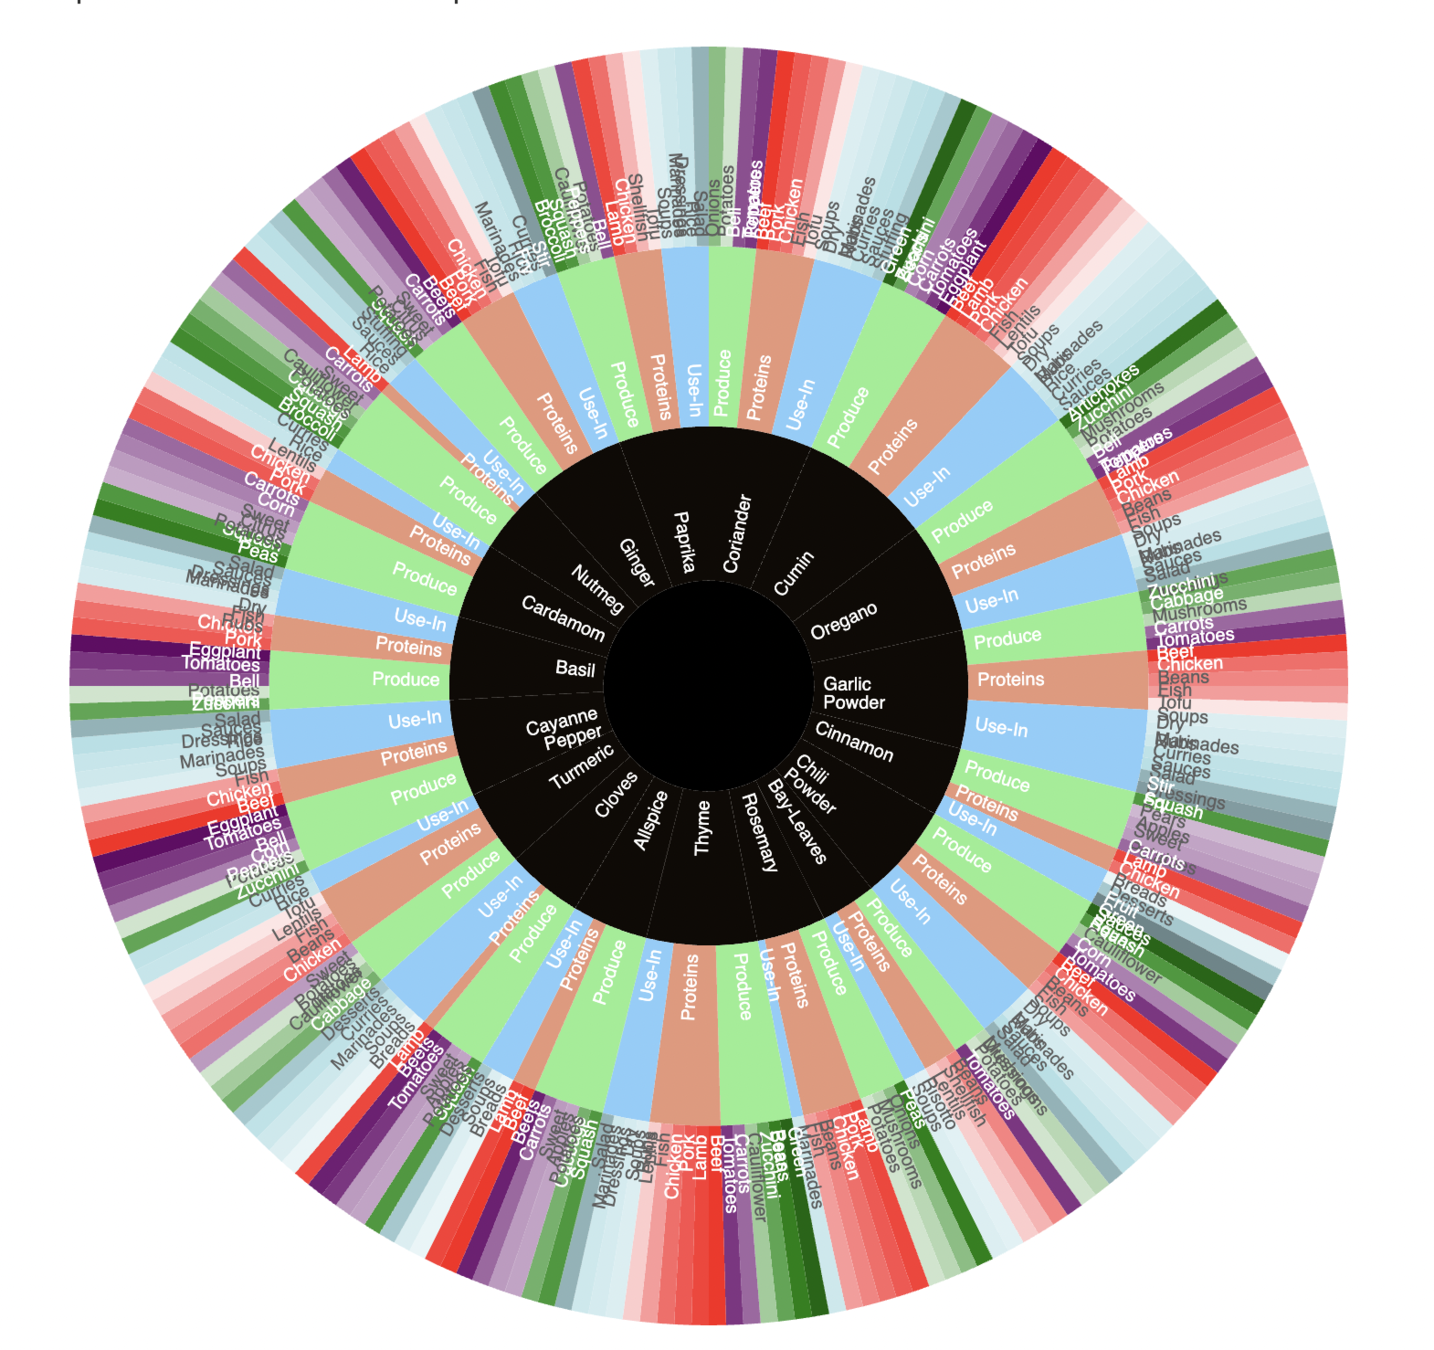
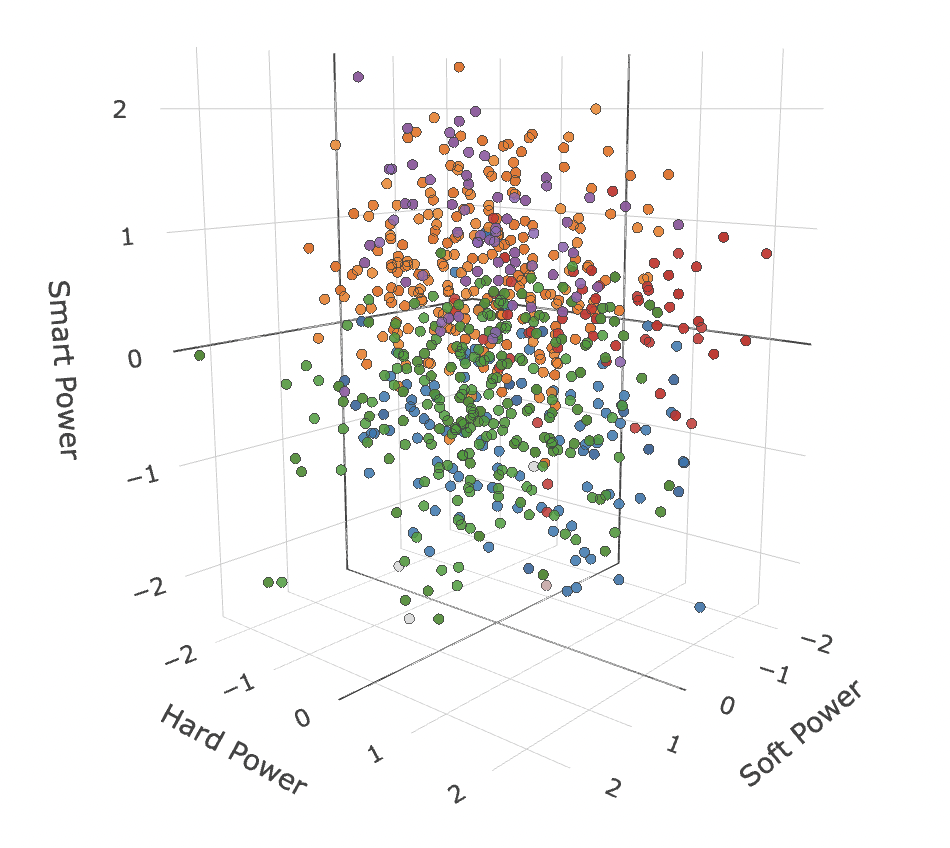
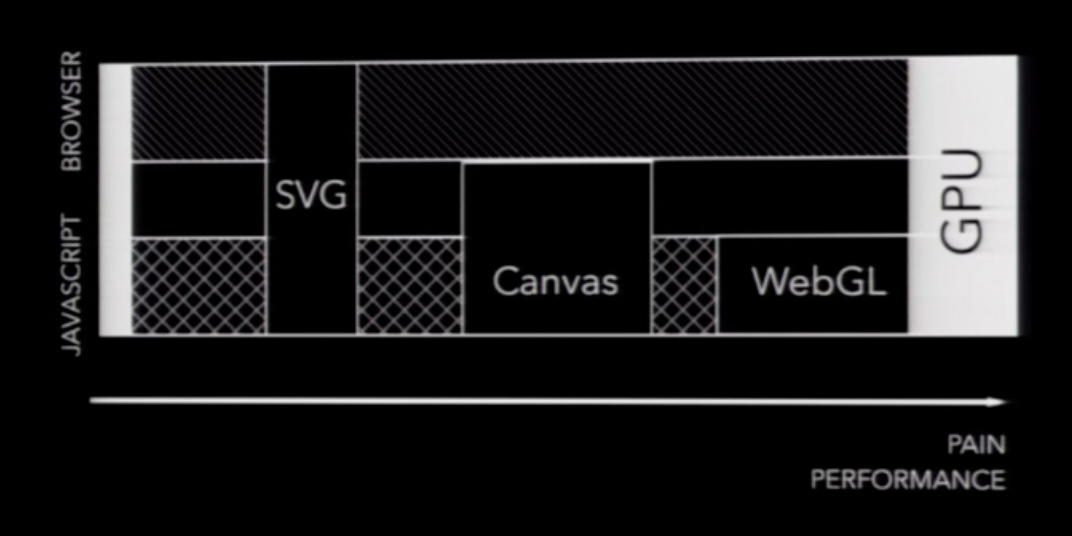
What can we do when our SVG visualizations are slow?
What can we do when our SVG visualizations are slow?
What can we do when our SVG visualizations are slow?
What can we do when our SVG visualizations are slow?
2D API
<canvas/>
2D API
<svg />
<canvas />
Source: Amber Hoak, https://ahoak.github.io/renderer-benchmark/
Source: Dominikus Baur, https://www.youtube.com/watch?v=dlZvL7Ei0C0
ctx.lineTo
ctx.bezierCurveTo
ctx.drawImage
ctx.fillRect
Source: Dominikus Baur, https://www.youtube.com/watch?v=dlZvL7Ei0C0
ctx.lineTo
ctx.bezierCurveTo
ctx.drawImage
ctx.fillRect
Source: Dominikus Baur, https://www.youtube.com/watch?v=dlZvL7Ei0C0
Pure SVG
Pure SVG
'animated-svg'
import { memo, useEffect, useRef } from "react";
import { select } from "d3-selection";
import { transition } from "d3-transition";
import { brush as d3brush } from "d3-brush";
import { axisLeft, axisBottom } from "d3-axis";
import { legendColor, legendSize } from "d3-svg-legend";
import { format } from "d3-format";
import { useData } from "../../hooks/useData";
import { useDimensions } from "../../hooks/useDimensions";
import { useScales } from "../../hooks/useScales";
import { NODE_RADIUS } from "../../constants";
import { useTooltipData } from "../../hooks/useTooltipData";
const SVGChart = ({
isDataShown,
isAnimated,
isBrushEnabled,
isPixiTooltipEnabled,
}) => {
const { width, height, margin } = useDimensions();
const { data, setData } = useData();
const { xScale, yScale, colorScale, nodeRadiusScale } = useScales();
const { setTooltipData } = useTooltipData();
const viewportRef = useRef(null);
const xAxisRef = useRef(null);
const yAxisRef = useRef(null);
const legendRef = useRef(null);
useEffect(() => {
if (xAxisRef.current) {
const xAxis = axisBottom(xScale);
select(xAxisRef.current).call(xAxis);
}
}, [xScale, width]);
useEffect(() => {
if (yAxisRef.current) {
const yAxis = axisLeft(yScale).tickSize(0);
select(yAxisRef.current).call(yAxis);
}
}, [yScale, width]);
useEffect(() => {
if (viewportRef.current) {
const brushed = ({ selection }) => {
if (selection) {
const [[x0, y0], [x1, y1]] = selection;
const filteredData = data.filter(
(d) =>
x0 <= xScale(new Date(d.date)) &&
xScale(new Date(d.date)) < x1 &&
y0 <= yScale(d.cleaned_fight_type) &&
yScale(d.cleaned_fight_type) < y1
);
setData(filteredData);
select(viewportRef.current).select(".brush").call(brush.clear);
}
};
const brush = d3brush().on("end", brushed);
const brushElement = select(viewportRef.current).select(".brush");
const brushElementExists = !brushElement.empty();
if (isBrushEnabled) {
if (brushElementExists) {
brushElement.call(brush);
} else {
const newBrushElement = select(viewportRef.current)
.append("g")
.classed("brush", true);
newBrushElement.call(brush);
}
} else {
if (brushElementExists) {
select(viewportRef.current).select(".brush").remove();
}
}
}
}, [data, setData, xScale, yScale, width, isBrushEnabled]);
useEffect(() => {
const viewport = select(viewportRef.current);
if (isDataShown) {
viewport
.selectAll(".circle")
.data(data)
.join("circle")
.attr("class", "circle")
.attr("cx", (d) =>
isAnimated ? xScale.domain[0] : xScale(new Date(d.date))
)
.attr("cy", (d) => yScale(d.cleaned_fight_type))
.attr("r", (d) => nodeRadiusScale(d.total_fight_minutes))
.style("fill", (d) => colorScale(d.win_by))
.style("cursor", "pointer")
.on("mouseover", (e, d) => {
const position = { x: e.clientX, y: e.clientY };
setTooltipData({ data: d, position });
select(e.target).attr(
"r",
(d) => nodeRadiusScale(d.total_fight_minutes) + 4
);
})
.on("mouseout", (e, d) => {
setTooltipData();
select(e.target).attr("r", (d) =>
nodeRadiusScale(d.total_fight_minutes)
);
})
.transition()
.duration(1000)
.attr("cx", (d) => xScale(new Date(d.date)));
} else {
viewport.selectAll(".circle").remove();
}
}, [
data,
xScale,
yScale,
colorScale,
nodeRadiusScale,
isDataShown,
width,
isAnimated,
setTooltipData,
]);
useEffect(() => {
if (legendRef.current) {
const colorLegend = legendColor()
.title("Win By")
.shape("circle")
.shapeRadius(NODE_RADIUS)
.shapePadding(10)
.scale(colorScale);
const sizeLegend = legendSize()
.title("Total Fight Time (minutes)")
.scale(nodeRadiusScale)
.shape("circle")
.shapePadding(30)
.labelOffset(30)
.labelFormat(format(".0f"))
.orient("horizontal");
select(legendRef.current).select(".colorLegend").call(colorLegend);
select(legendRef.current).select(".sizeLegend").call(sizeLegend);
}
}, [colorScale, nodeRadiusScale]);
return (
<svg
style={{
position: "absolute",
top: 0,
left: 0,
pointerEvents: isPixiTooltipEnabled ? "none" : "auto",
}}
width={width}
height={height}
role="img"
>
<g
className="title"
transform={`translate(${
margin.left + (width - margin.left - margin.right) / 2
}, ${margin.top / 2})`}
>
<text textAnchor="middle" fontSize={24}>
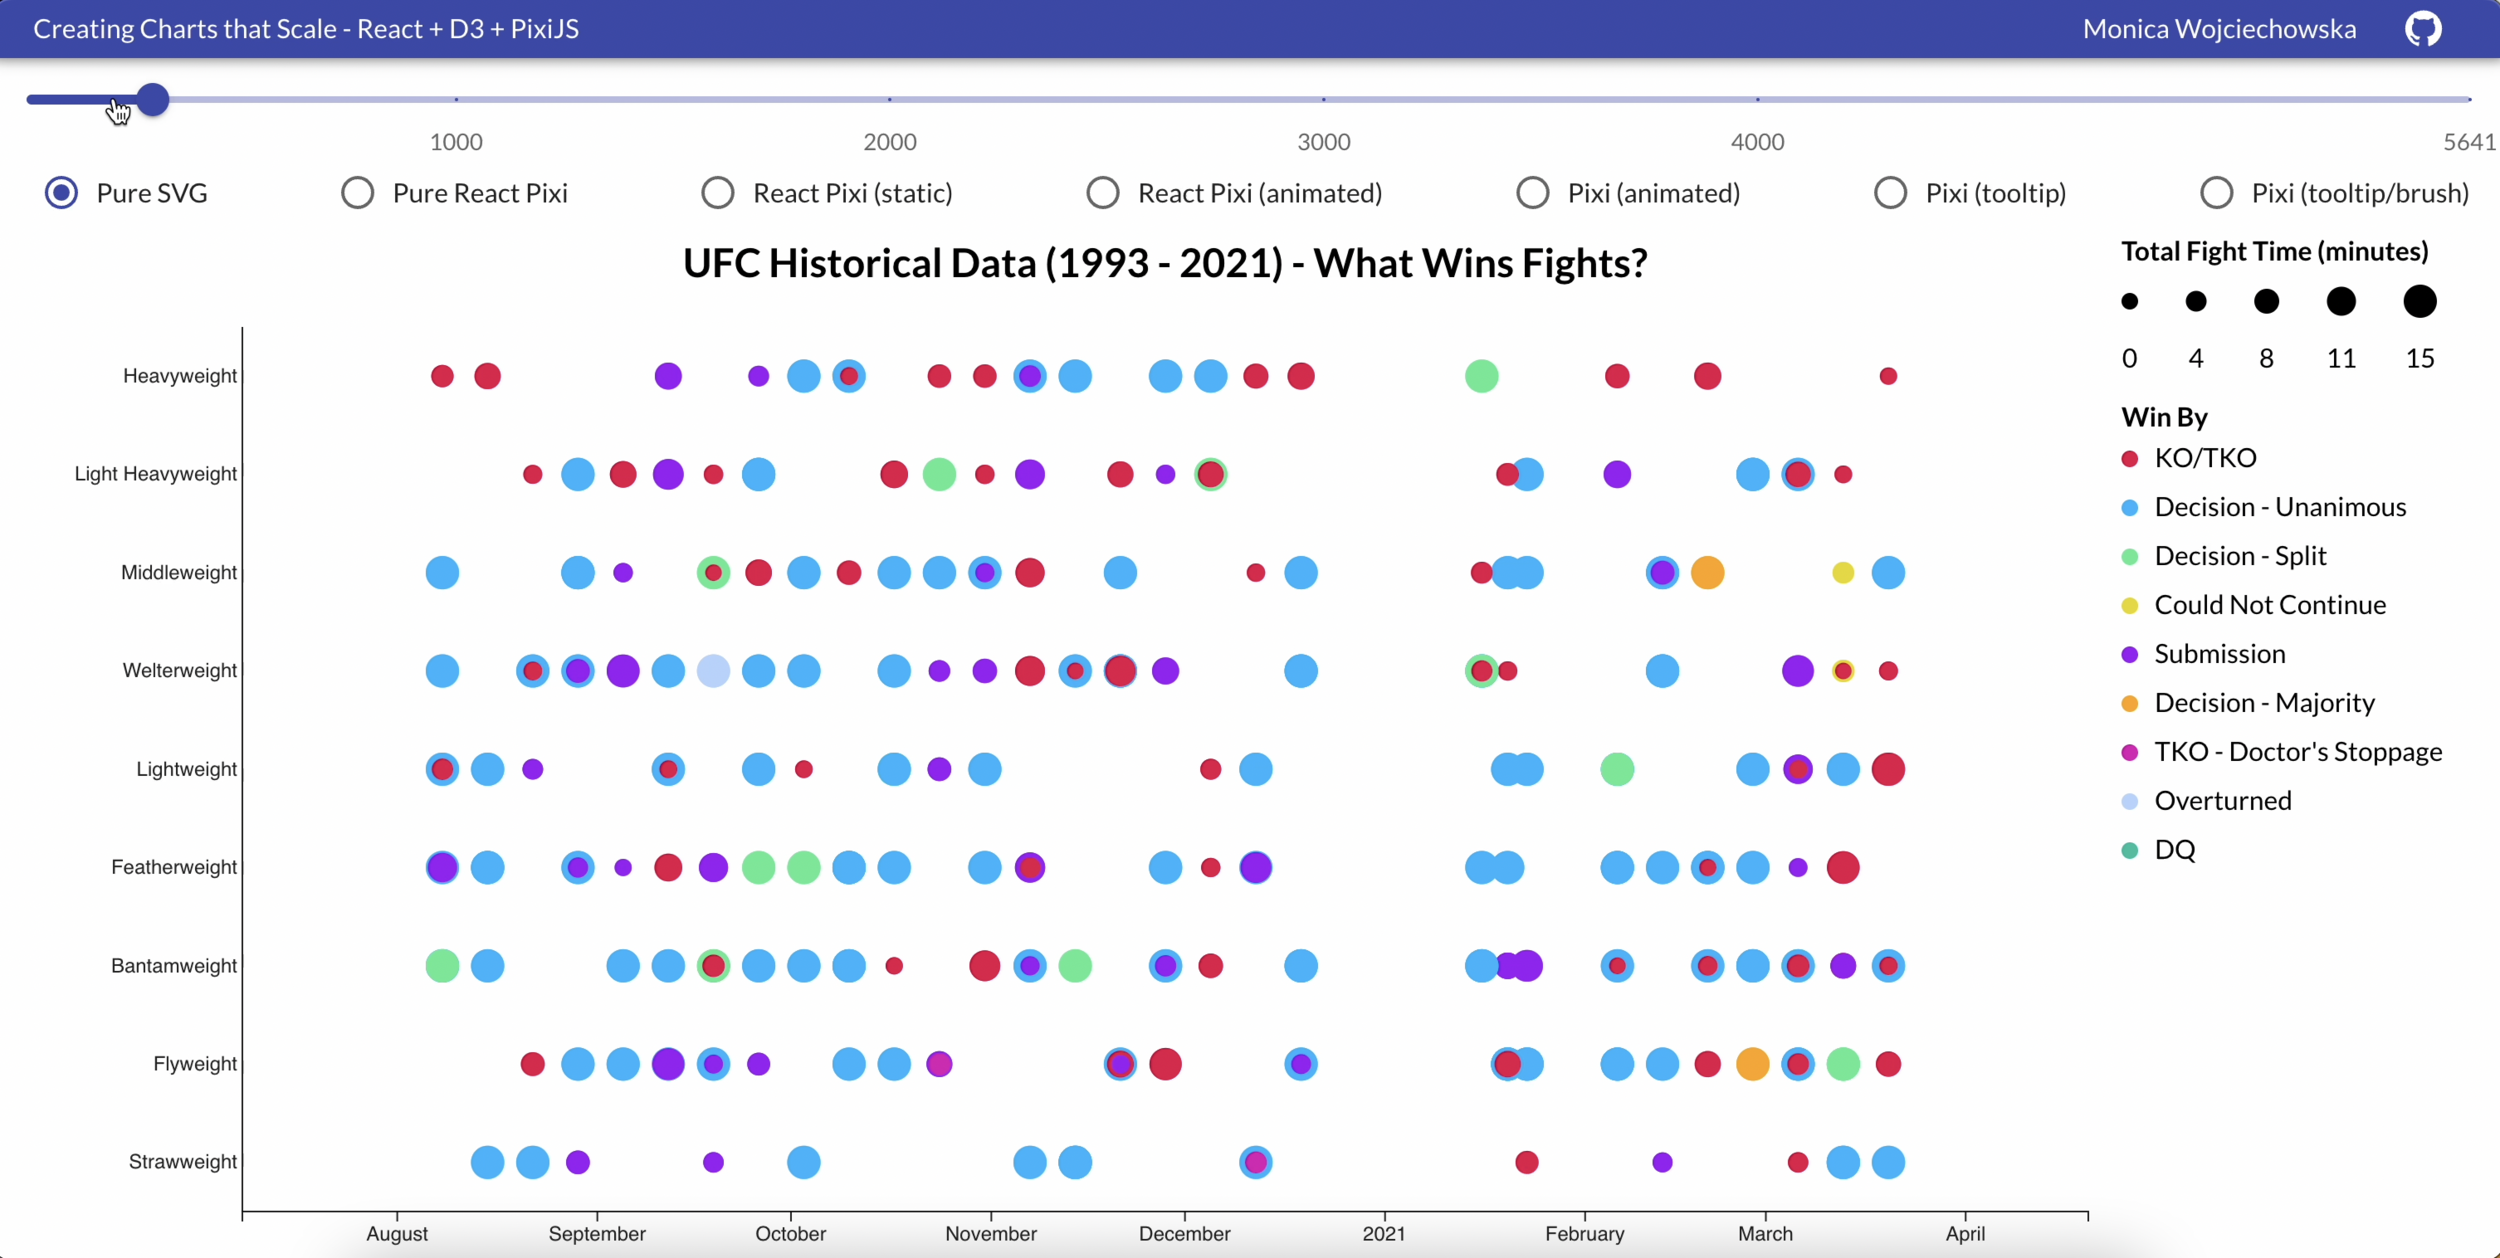
UFC Historical Data (1993 - 2021) - What Wins Fights?
</text>
</g>
<g
ref={viewportRef}
className="viewport"
width={width - margin.left - margin.right}
height={height - margin.top - margin.bottom}
transform={`translate(${margin.left}, ${margin.top})`}
>
<g className="brush" />
</g>
<g
ref={xAxisRef}
className="axis"
transform={`translate(${margin.left}, ${height - margin.bottom})`}
/>
<g
ref={yAxisRef}
className="axis"
transform={`translate(${margin.left}, ${margin.top})`}
/>
<g
ref={legendRef}
transform={`translate(${width - margin.right + 20}, ${margin.top})`}
>
<g className="sizeLegend" />
<g className="colorLegend" transform={`translate(0, ${margin.top})`} />
</g>
</svg>
);
};
export default memo(SVGChart);Pure SVG
code of the custom context hooks
import { memo, useEffect, useRef } from "react";
import { select } from "d3-selection";
import { transition } from "d3-transition";
import { brush as d3brush } from "d3-brush";
import { axisLeft, axisBottom } from "d3-axis";
import { legendColor, legendSize } from "d3-svg-legend";
import { format } from "d3-format";

import { useData } from "../../hooks/useData";
import { useDimensions } from "../../hooks/useDimensions";
import { useScales } from "../../hooks/useScales";
import { useTooltipData } from "../../hooks/useTooltipData";
import { NODE_RADIUS } from "../../constants";

const SVGChart = ({
  isDataShown,
  isAnimated,
  isBrushEnabled,
  isPixiTooltipEnabled,
}) => {
  const { width, height, margin } = useDimensions();
  const { data, setData } = useData();
  const { xScale, yScale, colorScale, nodeRadiusScale } = useScales();
  const { setTooltipData } = useTooltipData();

  const viewportRef = useRef(null);
  const xAxisRef = useRef(null);
  const yAxisRef = useRef(null);
  const legendRef = useRef(null);

  useEffect(() => {
    if (xAxisRef.current) {
      const xAxis = axisBottom(xScale);
      select(xAxisRef.current).call(xAxis);
    }
  }, [xScale, width]);

  useEffect(() => {
    if (yAxisRef.current) {
      const yAxis = axisLeft(yScale).tickSize(0);
      select(yAxisRef.current).call(yAxis);
    }
  }, [yScale, width]);

  useEffect(() => {
    if (viewportRef.current) {
      const brushed = ({ selection }) => {
        if (selection) {
          const [[x0, y0], [x1, y1]] = selection;
          const filteredData = data.filter(
            (d) =>
              x0 <= xScale(new Date(d.date)) &&
              xScale(new Date(d.date)) < x1 &&
              y0 <= yScale(d.cleaned_fight_type) &&
              yScale(d.cleaned_fight_type) < y1
          );
          setData(filteredData);
          select(viewportRef.current).select(".brush").call(brush.clear);
        }
      };

      const brush = d3brush().on("end", brushed);
      const brushElement = select(viewportRef.current).select(".brush");
      const brushElementExists = !brushElement.empty();

      if (isBrushEnabled) {
        if (brushElementExists) {
          brushElement.call(brush);
        } else {
          const newBrushElement = select(viewportRef.current)
            .append("g")
            .classed("brush", true);
          newBrushElement.call(brush);
        }
      } else {
        if (brushElementExists) {
          select(viewportRef.current).select(".brush").remove();
        }
      }
    }
  }, [data, setData, xScale, yScale, width, isBrushEnabled]);

  useEffect(() => {
    const viewport = select(viewportRef.current);
    if (isDataShown) {
      viewport
        .selectAll(".circle")
        .data(data)
        .join("circle")
        .attr("class", "circle")
        .attr("cx", (d) =>
          isAnimated ? xScale.domain[0] : xScale(new Date(d.date))
        )
        .attr("cy", (d) => yScale(d.cleaned_fight_type))
        .attr("r", (d) => nodeRadiusScale(d.total_fight_minutes))
        .style("fill", (d) => colorScale(d.win_by))
        .style("cursor", "pointer")
        .on("mouseover", (e, d) => {
          const position = { x: e.clientX, y: e.clientY };
          setTooltipData({ data: d, position });
          select(e.target).attr(
            "r",
            (d) => nodeRadiusScale(d.total_fight_minutes) + 4
          );
        })
        .on("mouseout", (e, d) => {
          setTooltipData();
          select(e.target).attr("r", (d) =>
            nodeRadiusScale(d.total_fight_minutes)
          );
        })
        .transition()
        .duration(1000)
        .attr("cx", (d) => xScale(new Date(d.date)));
    } else {
      viewport.selectAll(".circle").remove();
    }
  }, [
    data,
    xScale,
    yScale,
    colorScale,
    nodeRadiusScale,
    isDataShown,
    width,
    isAnimated,
    setTooltipData,
  ]);

  useEffect(() => {
    if (legendRef.current) {
      const colorLegend = legendColor()
        .title("Win By")
        .shape("circle")
        .shapeRadius(NODE_RADIUS)
        .shapePadding(10)
        .scale(colorScale);

      const sizeLegend = legendSize()
        .title("Total Fight Time (minutes)")
        .scale(nodeRadiusScale)
        .shape("circle")
        .shapePadding(30)
        .labelOffset(30)
        .labelFormat(format(".0f"))
        .orient("horizontal");

      select(legendRef.current).select(".colorLegend").call(colorLegend);
      select(legendRef.current).select(".sizeLegend").call(sizeLegend);
    }
  }, [colorScale, nodeRadiusScale]);

  return (
    <svg
      style={{
        position: "absolute",
        top: 0,
        left: 0,
        pointerEvents: isPixiTooltipEnabled ? "none" : "auto",
      }}
      width={width}
      height={height}
      role="img"
    >
      <g
        className="title"
        transform={`translate(${
          margin.left + (width - margin.left - margin.right) / 2
        }, ${margin.top / 2})`}
      >
        <text textAnchor="middle" fontSize={24}>
          UFC Historical Data (1993 - 2021) - What Wins Fights?
        </text>
      </g>
      <g
        ref={viewportRef}
        className="viewport"
        width={width - margin.left - margin.right}
        height={height - margin.top - margin.bottom}
        transform={`translate(${margin.left}, ${margin.top})`}
      >
        <g className="brush" />
      </g>
      <g
        ref={xAxisRef}
        className="axis"
        transform={`translate(${margin.left}, ${height - margin.bottom})`}
      />
      <g
        ref={yAxisRef}
        className="axis"
        transform={`translate(${margin.left}, ${margin.top})`}
      />
      <g
        ref={legendRef}
        transform={`translate(${width - margin.right + 20}, ${margin.top})`}
      >
        <g className="sizeLegend" />
        <g className="colorLegend" transform={`translate(0, ${margin.top})`} />
      </g>
    </svg>
  );
};

export default memo(SVGChart);
Pure SVG
Pure SVG
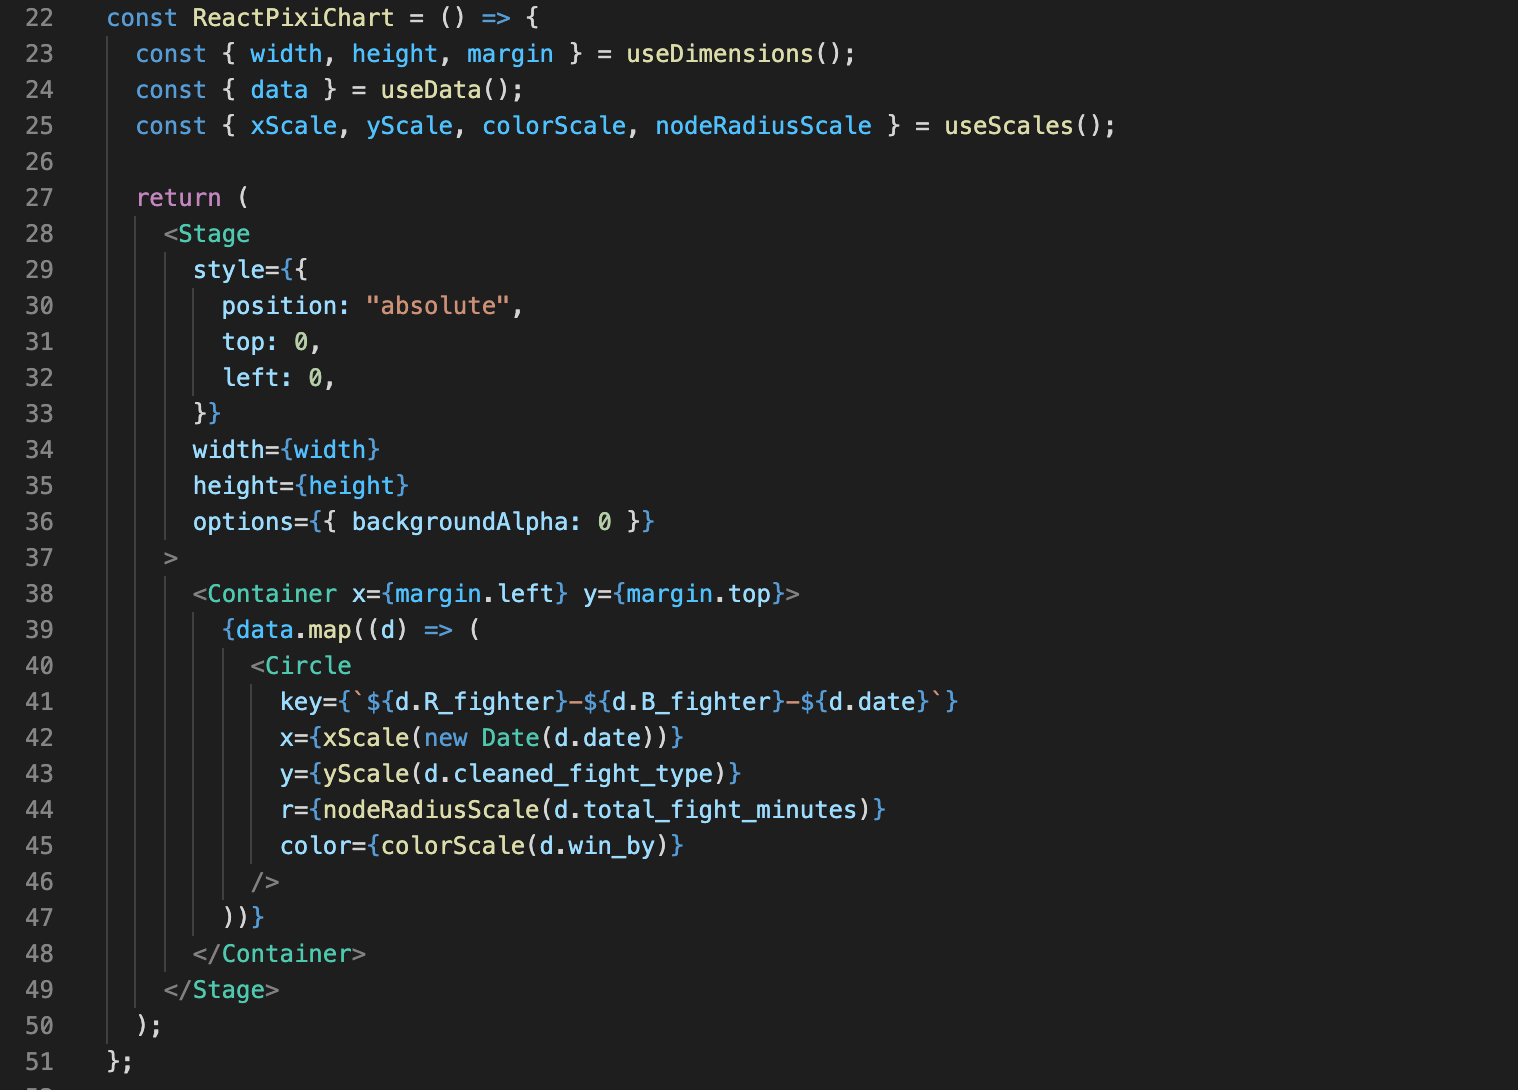
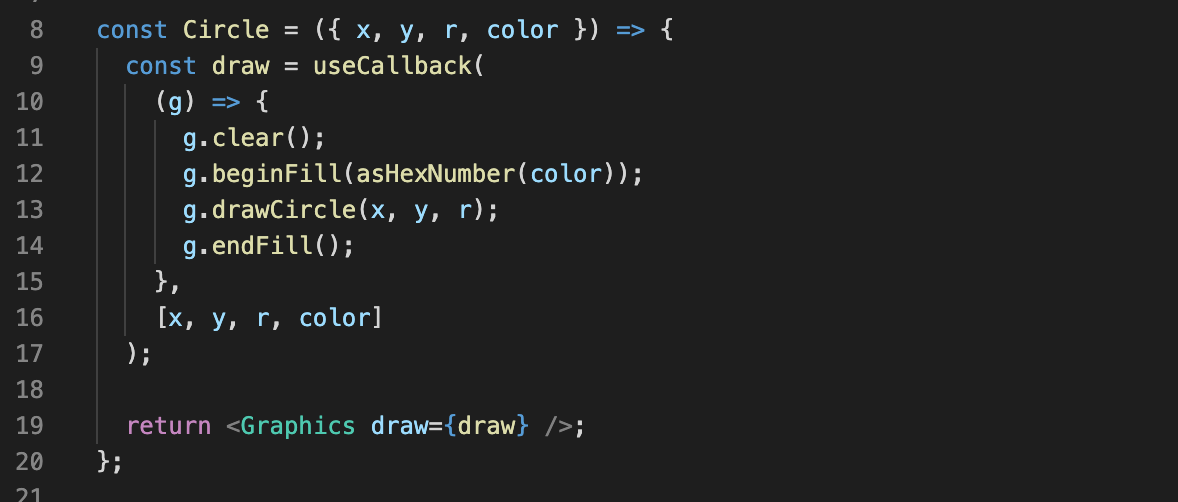
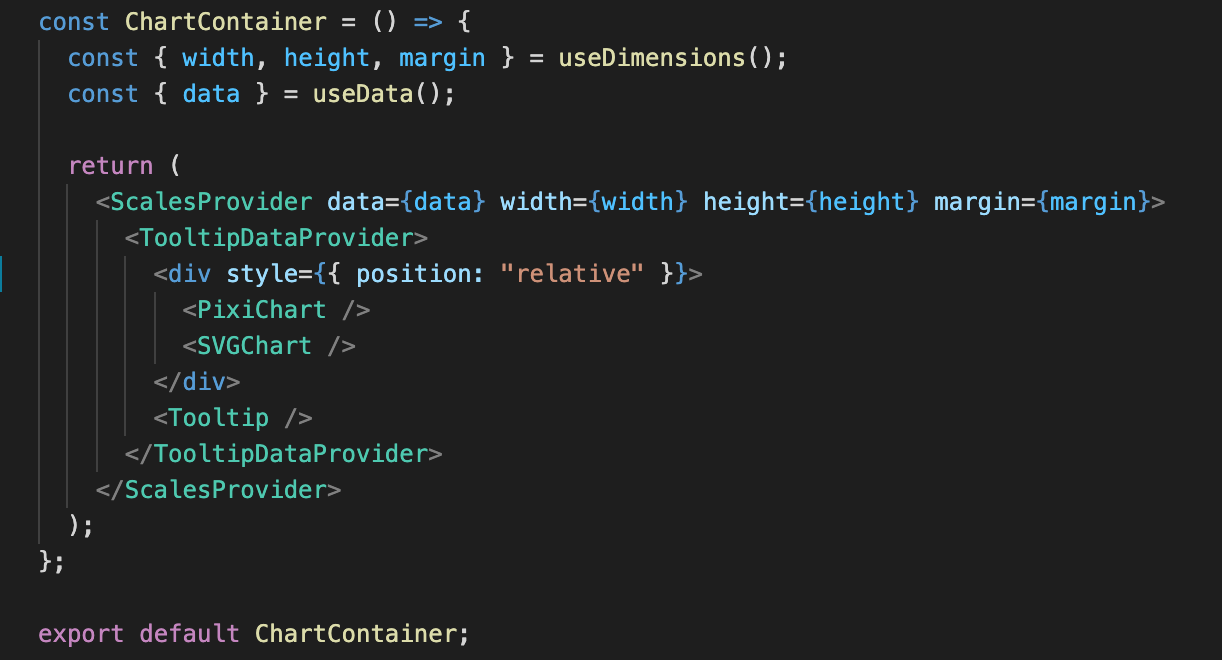
Pure React Pixi
Pure React Pixi
Pure React Pixi
React Pixi + SVG Overlay (static)
import { memo, useEffect, useRef } from "react";
import { select } from "d3-selection";
import { transition } from "d3-transition";
import { axisLeft, axisBottom } from "d3-axis";
import { legendColor, legendSize } from "d3-svg-legend";
import { format } from "d3-format";
import { useDimensions } from "../../hooks/useDimensions";
import { useScales } from "../../hooks/useScales";
import { NODE_RADIUS } from "../../constants";

const SVGOverlay = () => {
  const { width, height, margin } = useDimensions();
  const { xScale, yScale, colorScale, nodeRadiusScale } = useScales();

  const viewportRef = useRef(null);
  const xAxisRef = useRef(null);
  const yAxisRef = useRef(null);
  const legendRef = useRef(null);

  useEffect(() => {
    if (xAxisRef.current) {
      const xAxis = axisBottom(xScale);
      select(xAxisRef.current).call(xAxis);
    }
  }, [xScale, width]);

  useEffect(() => {
    if (yAxisRef.current) {
      const yAxis = axisLeft(yScale).tickSize(0);
      select(yAxisRef.current).call(yAxis);
    }
  }, [yScale, width]);

  // useEffect(() => {
  //   const viewport = select(viewportRef.current);
  //   viewport
  //     .selectAll(".circle")
  //     .data(data)
  //     .join("circle")
  //     .attr("class", "circle")
  //     .attr("cx", (d) => xScale.domain[0])
  //     .attr("cy", (d) => yScale(d.cleaned_fight_type))
  //     .attr("r", (d) => nodeRadiusScale(d.total_fight_minutes))
  //     .style("fill", (d) => colorScale(d.win_by))
  //     .style("cursor", "pointer")
  //     .on("mouseover", (e, d) => {
  //       const position = { x: e.clientX, y: e.clientY };
  //       setTooltipData({ data: d, position });
  //       select(e.target).attr(
  //         "r",
  //         (d) => nodeRadiusScale(d.total_fight_minutes) + 4
  //       );
  //     })
  //     .on("mouseout", (e, d) => {
  //       setTooltipData();
  //       select(e.target).attr("r", (d) =>
  //         nodeRadiusScale(d.total_fight_minutes)
  //       );
  //     })
  //     .transition()
  //     .duration(1000)
  //     .attr("cx", (d) => xScale(new Date(d.date)));
  // }, [
  //   data,
  //   xScale,
  //   yScale,
  //   colorScale,
  //   nodeRadiusScale,
  //   width,
  //   setTooltipData,
  // ]);

  useEffect(() => {
    if (legendRef.current) {
      const colorLegend = legendColor()
        .title("Win By")
        .shape("circle")
        .shapeRadius(NODE_RADIUS)
        .shapePadding(10)
        .scale(colorScale);

      const sizeLegend = legendSize()
        .title("Total Fight Time (minutes)")
        .scale(nodeRadiusScale)
        .shape("circle")
        .shapePadding(30)
        .labelOffset(30)
        .labelFormat(format(".0f"))
        .orient("horizontal");

      select(legendRef.current).select(".colorLegend").call(colorLegend);
      select(legendRef.current).select(".sizeLegend").call(sizeLegend);
    }
  }, [colorScale, nodeRadiusScale]);

  return (
    <svg
      style={{
        position: "absolute",
        top: 0,
        left: 0,
        pointerEvents: "auto",
      }}
      width={width}
      height={height}
      role="img"
    >
      <g
        className="title"
        transform={`translate(${
          margin.left + (width - margin.left - margin.right) / 2
        }, ${margin.top / 2})`}
      >
        <text textAnchor="middle" fontSize={24}>
          UFC Historical Data (1993 - 2021) - What Wins Fights?
        </text>
      </g>
      {/* <g
        ref={viewportRef}
        className="viewport"
        width={width - margin.left - margin.right}
        height={height - margin.top - margin.bottom}
        transform={`translate(${margin.left}, ${margin.top})`}
      /> */}
      <g
        ref={xAxisRef}
        className="axis"
        transform={`translate(${margin.left}, ${height - margin.bottom})`}
      />
      <g
        ref={yAxisRef}
        className="axis"
        transform={`translate(${margin.left}, ${margin.top})`}
      />
      <g
        ref={legendRef}
        transform={`translate(${width - margin.right + 20}, ${margin.top})`}
      >
        <g className="sizeLegend" />
        <g className="colorLegend" transform={`translate(0, ${margin.top})`} />
      </g>
    </svg>
  );
};

export default memo(SVGOverlay);
React Pixi + SVG Overlay (static)
React Pixi + SVG Overlay (static)
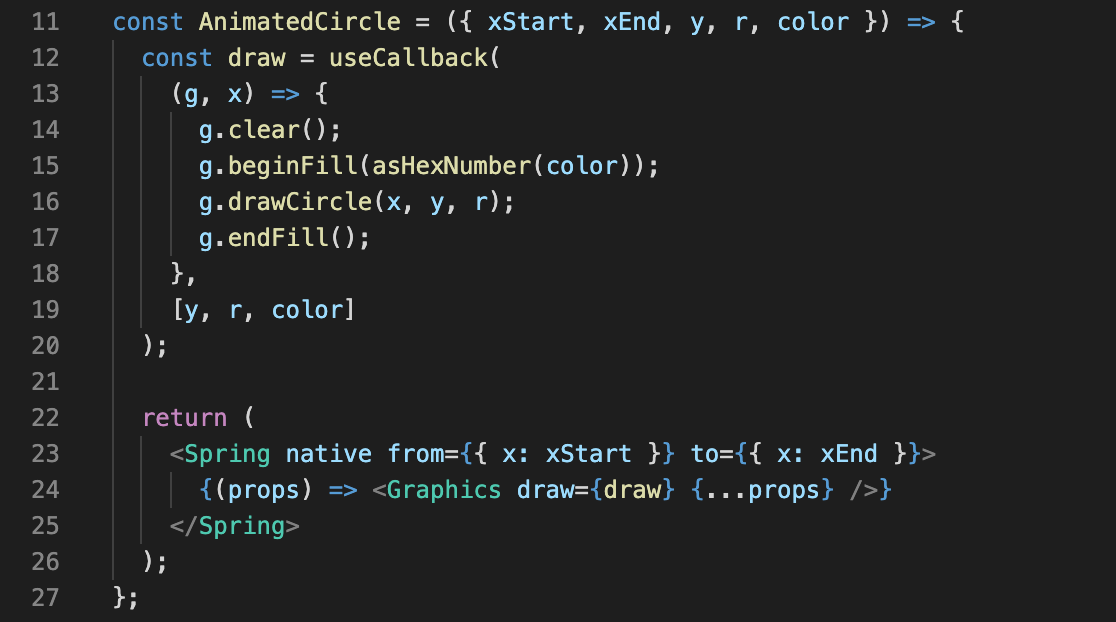
React Pixi + SVG Overlay (animated)
React Pixi + SVG Overlay (animated)
Sprite(s)
Vanilla (Imperative) PixiJS
“NOTE: Writing PIXI apps in vanilla js (the imperative way) is always more performant. The React reconciler needs to pass and validate props which can be costly when dealing with lots of components.” - React Pixi docs
Pixi + SVG Overlay (animated sprites)
import { useCallback, useRef, useEffect } from "react";
import * as PIXI from "pixi.js";
import gsap from "gsap";
import { asHexNumber } from "../../utils";
import { useDimensions } from "../../hooks/useDimensions";
import { useScales } from "../../hooks/useScales";
import { useData } from "../../hooks/useData";

const PixiChart = () => {
  const { width, height, margin } = useDimensions();
  const { data } = useData();
  const { xScale, yScale, colorScale, nodeRadiusScale } = useScales();
  const ref = useRef(null);

  const renderSprite = useCallback(
    ({ texture, container, x0, x1, y, width, height, tint }) => {
      const sprite = new PIXI.Sprite(texture);

      sprite.anchor.set(0.5);
      sprite.x = x0;
      sprite.y = y;
      sprite.width = width;
      sprite.height = height;
      sprite.tint = tint;

      // add animation!
      gsap.to(sprite, {
        x: x1,
        duration: 0.3,
        overwrite: true,
      });

      container.addChild(sprite);
    },
    []
  );

  useEffect(() => {
    if (ref.current) {
      const app = new PIXI.Application({
        width,
        height,
        x: 0,
        y: 0,
        backgroundAlpha: 0,
        antialias: true,
      });

      // add a container to hold our circles
      const container = new PIXI.Container(
        width - margin.left - margin.right,
        height - margin.top - margin.bottom
      );
      app.stage.addChild(container);
      container.x = margin.left;
      container.y = margin.top;

      // create a white texture to be used by our sprites
      const circleTemplate = new PIXI.Graphics()
        .beginFill(0xffffff)
        .drawCircle(0, 0, 10)
        .endFill();

      // generate texture from template
      const texture = app.renderer.generateTexture(circleTemplate);

      data.forEach((d) => {
        const x0 = xScale.range[0];
        const x1 = xScale(new Date(d.date));
        const y = yScale(d.cleaned_fight_type);
        const r = nodeRadiusScale(d.total_fight_minutes);
        const tint = asHexNumber(colorScale(d.win_by));

        renderSprite({
          container,
          texture,
          x0,
          x1,
          y,
          width: r * 2,
          height: r * 2,
          tint,
        });
      });

      // Add app to DOM
      ref.current.appendChild(app.view);

      return () => {
        // On unload completely destroy the application and all of it's children
        app.destroy(true, true);
      };
    }
  }, [
    data,
    width,
    height,
    xScale,
    yScale,
    colorScale,
    nodeRadiusScale,
    margin.bottom,
    margin.top,
    margin.left,
    margin.right,
    renderSprite,
  ]);

  return (
    <div
      ref={ref}
      style={{
        position: "absolute",
        top: 0,
        left: 0,
      }}
      width={width}
      height={height}
    />
  );
};

export default PixiChart;
Pixi + SVG Overlay (animated sprites)
Pixi + SVG Overlay (with tooltip)
import { useCallback, useRef, useEffect } from "react";
import * as PIXI from "pixi.js";
import gsap from "gsap";
import { asHexNumber } from "../../utils";
import { useDimensions } from "../../hooks/useDimensions";
import { useScales } from "../../hooks/useScales";
import { useData } from "../../hooks/useData";
import { useTooltipData } from "../hooks/useTooltipData";

const PixiChart = () => {
  const { width, height, margin } = useDimensions();
  const { data } = useData();
  const { xScale, yScale, colorScale, nodeRadiusScale } = useScales();
  const { setTooltipData } = useTooltipData();
  const ref = useRef(null);

  const renderSprite = useCallback(
    ({
      texture,
      container,
      d,
      x0,
      x1,
      y,
      width,
      height,
      tint,
      onPointerEvent,
    }) => {
      const sprite = new PIXI.Sprite(texture);

      sprite.anchor.set(0.5);
      sprite.x = x0;
      sprite.y = y;
      sprite.width = width;
      sprite.height = height;
      sprite.tint = tint;

      // update tooltip data on pointer over
      sprite.interactive = true;
      sprite.buttonMode = true;
      sprite.on("pointerover", (e) => {
        const { clientX, clientY } = e.data.originalEvent;
        onPointerEvent({
          data: d,
          position: { x: clientX, y: clientY + 10 },
        });
      });
      sprite.on("pointerout", () => onPointerEvent());

      // add animation
      gsap.to(sprite, {
        x: x1,
        duration: 0.3,
        overwrite: true,
      });

      container.addChild(sprite);
    },
    []
  );

  useEffect(() => {
    if (ref.current) {
      const app = new PIXI.Application({
        width,
        height,
        x: 0,
        y: 0,
        backgroundAlpha: 0,
        antialias: true,
      });

      // create a white texture to be used by our sprites
      const circleTemplate = new PIXI.Graphics()
        .beginFill(0xffffff)
        .drawCircle(0, 0, 10)
        .endFill();

      // generate texture from template
      const texture = app.renderer.generateTexture(circleTemplate);

      // add a container to hold our circles
      const container = new PIXI.Container(
        width - margin.left - margin.right,
        height - margin.top - margin.bottom
      );
      app.stage.addChild(container);
      container.x = margin.left;
      container.y = margin.top;

      data.forEach((d) => {
        const x0 = xScale.range[0];
        const x1 = xScale(new Date(d.date));
        const y = yScale(d.cleaned_fight_type);
        const r = nodeRadiusScale(d.total_fight_minutes);
        const tint = asHexNumber(colorScale(d.win_by));

        renderSprite({
          container,
          texture,
          x0,
          x1,
          y,
          width: r * 2,
          height: r * 2,
          tint,
          onPointerEvent: setTooltipData,
        });
      });

      // Add app to DOM
      ref.current.appendChild(app.view);

      return () => {
        // On unload completely destroy the application and all of it's children
        app.destroy(true, true);
      };
    }
  }, [
    data,
    width,
    height,
    xScale,
    yScale,
    colorScale,
    nodeRadiusScale,
    margin.bottom,
    margin.top,
    margin.left,
    margin.right,
    renderSprite,
    setTooltipData,
  ]);

  return (
    <div
      ref={ref}
      style={{
        position: "absolute",
        top: 0,
        left: 0,
      }}
      width={width}
      height={height}
    />
  );
};

export default PixiChart;
Pixi + SVG Overlay (with tooltip)
Pixi + SVG Overlay (with tooltip)
Pixi + SVG Overlay (with brush + tooltip)
Pixi + SVG Overlay (with brush + tooltip)
import { memo, useEffect, useRef } from "react";
import { select } from "d3-selection";
import { transition } from "d3-transition";
import { brush as d3brush } from "d3-brush";
import { axisLeft, axisBottom } from "d3-axis";
import { legendColor, legendSize } from "d3-svg-legend";
import { format } from "d3-format";
import { useData } from "../../hooks/useData";
import { useDimensions } from "../../hooks/useDimensions";
import { useScales } from "../../hooks/useScales";
import { NODE_RADIUS } from "../../constants";

const SVGOverlay = ({ isBrushEnabled, isPixiTooltipEnabled }) => {
  const { width, height, margin } = useDimensions();
  const { data, setData } = useData();
  const { xScale, yScale, colorScale, nodeRadiusScale } = useScales();

  const viewportRef = useRef(null);
  const xAxisRef = useRef(null);
  const yAxisRef = useRef(null);
  const legendRef = useRef(null);

  useEffect(() => {
    if (xAxisRef.current) {
      const xAxis = axisBottom(xScale);
      select(xAxisRef.current).call(xAxis);
    }
  }, [xScale, width]);

  useEffect(() => {
    if (yAxisRef.current) {
      const yAxis = axisLeft(yScale).tickSize(0);
      select(yAxisRef.current).call(yAxis);
    }
  }, [yScale, width]);

  useEffect(() => {
    if (legendRef.current) {
      const colorLegend = legendColor()
        .title("Win By")
        .shape("circle")
        .shapeRadius(NODE_RADIUS)
        .shapePadding(10)
        .scale(colorScale);

      const sizeLegend = legendSize()
        .title("Total Fight Time (minutes)")
        .scale(nodeRadiusScale)
        .shape("circle")
        .shapePadding(30)
        .labelOffset(30)
        .labelFormat(format(".0f"))
        .orient("horizontal");

      select(legendRef.current).select(".colorLegend").call(colorLegend);
      select(legendRef.current).select(".sizeLegend").call(sizeLegend);
    }
  }, [colorScale, nodeRadiusScale]);

  useEffect(() => {
    if (viewportRef.current && isBrushEnabled) {
      const brushed = ({ selection }) => {
        if (selection) {
          const [[x0, y0], [x1, y1]] = selection;
          const filteredData = data.filter(
            (d) =>
              x0 <= xScale(new Date(d.date)) &&
              xScale(new Date(d.date)) < x1 &&
              y0 <= yScale(d.cleaned_fight_type) &&
              yScale(d.cleaned_fight_type) < y1
          );
          setData(filteredData);
          select(viewportRef.current).select(".brush").call(brush.clear);
        }
      };

      const brush = d3brush().on("end", brushed);
      select(viewportRef.current).select(".brush").call(brush);
    }
  }, [data, setData, xScale, yScale, width, isBrushEnabled]);

  return (
    <svg
      style={{
        position: "absolute",
        top: 0,
        left: 0,
        pointerEvents: isPixiTooltipEnabled ? "none" : "auto",
      }}
      width={width}
      height={height}
      role="img"
    >
      <g
        className="title"
        transform={`translate(${
          margin.left + (width - margin.left - margin.right) / 2
        }, ${margin.top / 2})`}
      >
        <text textAnchor="middle" fontSize={24}>
          UFC Historical Data (1993 - 2021) - What Wins Fights?
        </text>
      </g>
      <g
        ref={viewportRef}
        className="viewport"
        width={width - margin.left - margin.right}
        height={height - margin.top - margin.bottom}
        transform={`translate(${margin.left}, ${margin.top})`}
      >
        <g className="brush" />
      </g>
      <g
        ref={xAxisRef}
        className="axis"
        transform={`translate(${margin.left}, ${height - margin.bottom})`}
      />
      <g
        ref={yAxisRef}
        className="axis"
        transform={`translate(${margin.left}, ${margin.top})`}
      />
      <g
        ref={legendRef}
        transform={`translate(${width - margin.right + 20}, ${margin.top})`}
      >
        <g className="sizeLegend" />
        <g className="colorLegend" transform={`translate(0, ${margin.top})`} />
      </g>
    </svg>
  );
};

export default memo(SVGOverlay);
Pixi + SVG Overlay (with brush + tooltip) 🥳
Some final tips / tricks / thoughts 🤔
Some final tips / tricks / thoughts 🤔
Some final tips / tricks / thoughts 🤔
Some final tips / tricks / thoughts 🤔
By Monica Wojciechowska
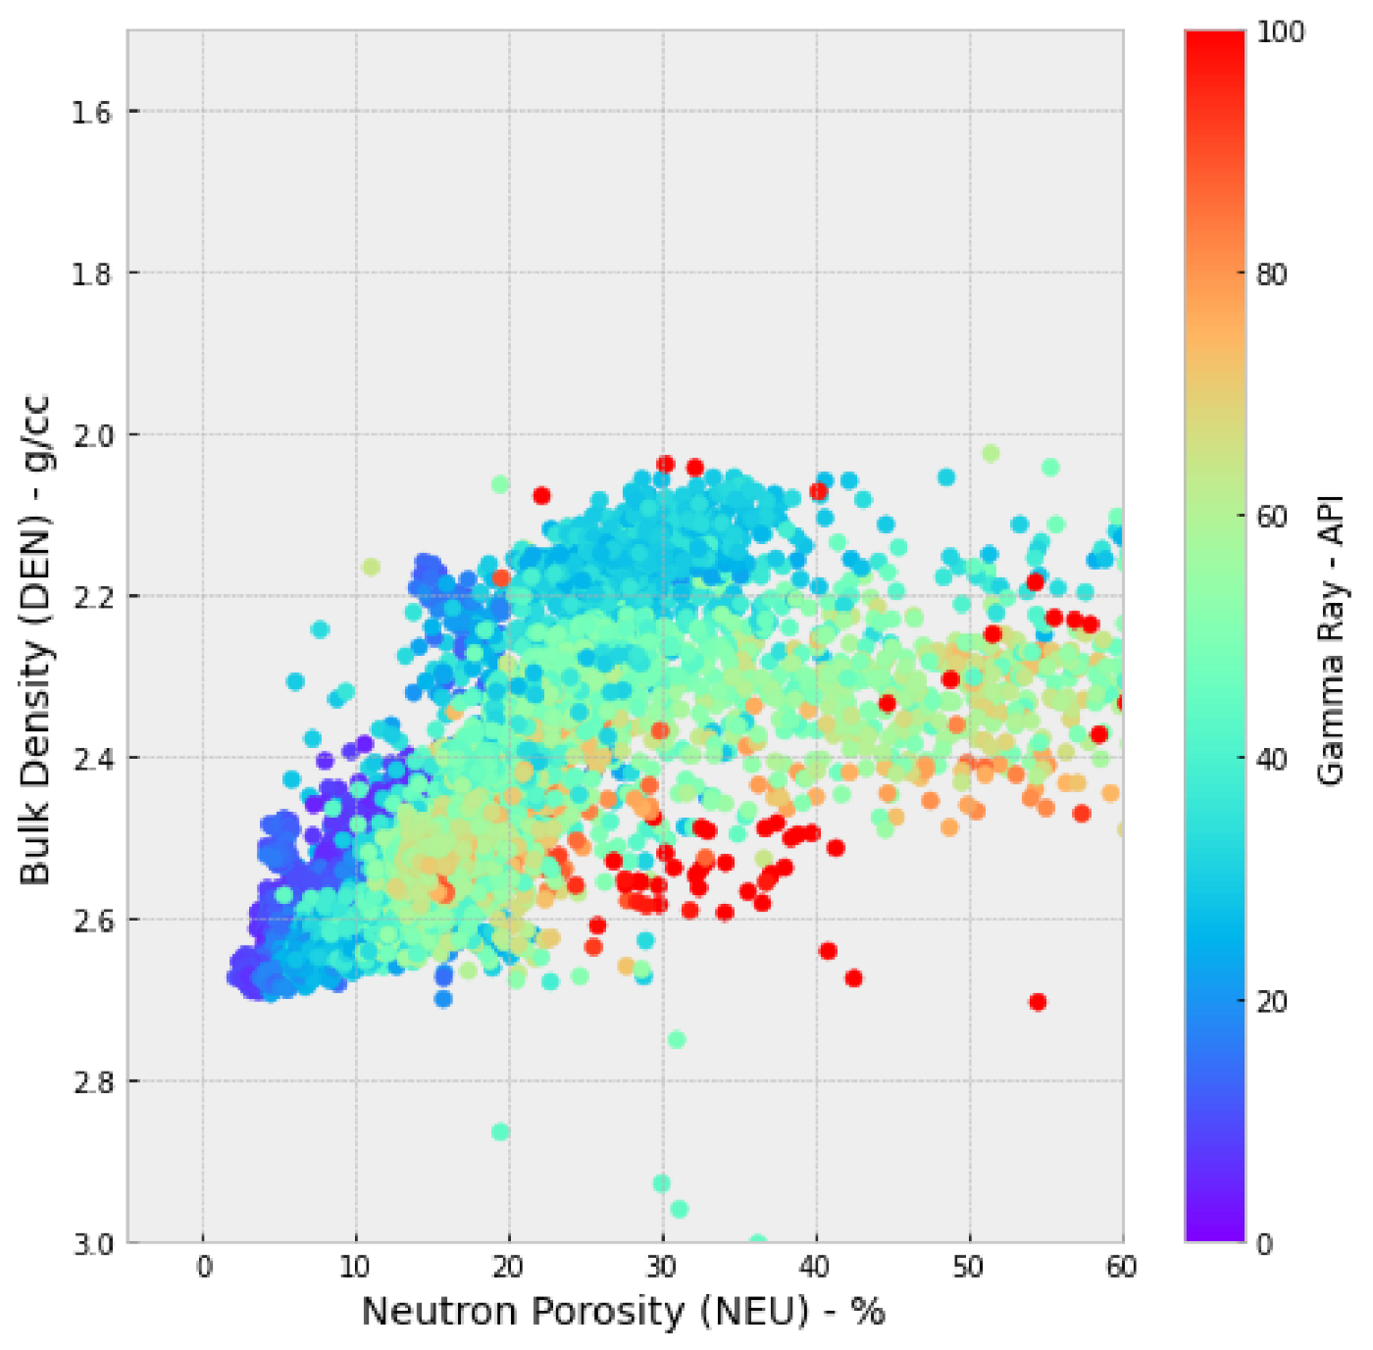
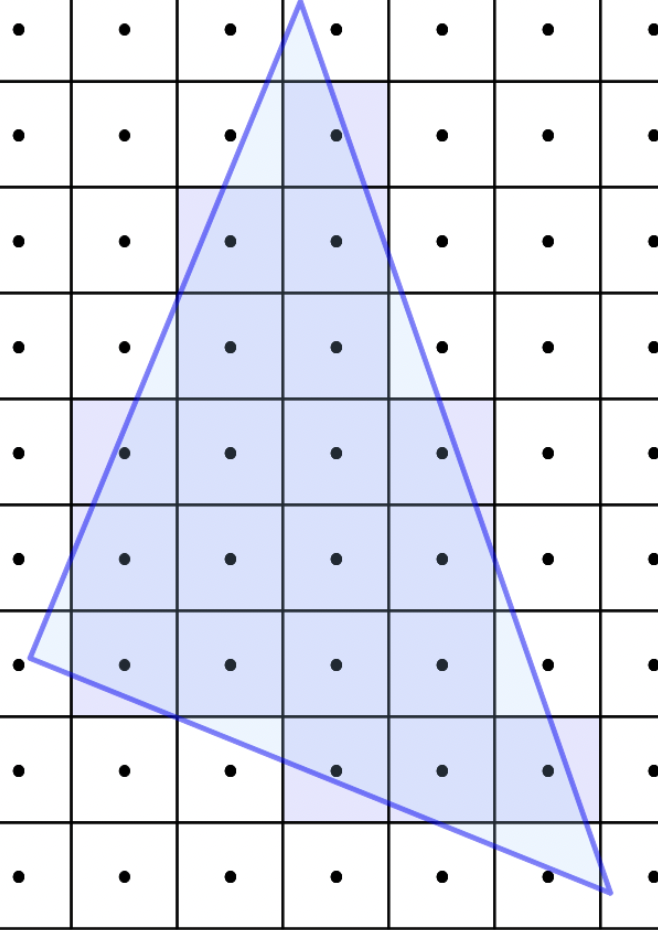
Data viz is no longer the niche endeavour that it was a few years back. Today, there are several libraries out there that do a great job of rendering all the SVG bar charts, scatterplots, and line plots your heart can imagine… as long as those charts aren't trying to show over a thousand data points 😉 Unfortunately, for SVG visualizations size does matter. In this presentation, we'll talk about how to visualize large(r) data sets in a way that is performant and maintains user interactivity. Ready to build user-friendly charts that scale? React + Canvas API (and a few additional pro tips and tricks) to the rescue!


