Jupyter, Django & Altair
Quick and dirty business analytics
Djangocon Eu 2019
Chris Adams
Hello! My name is Chris Adams
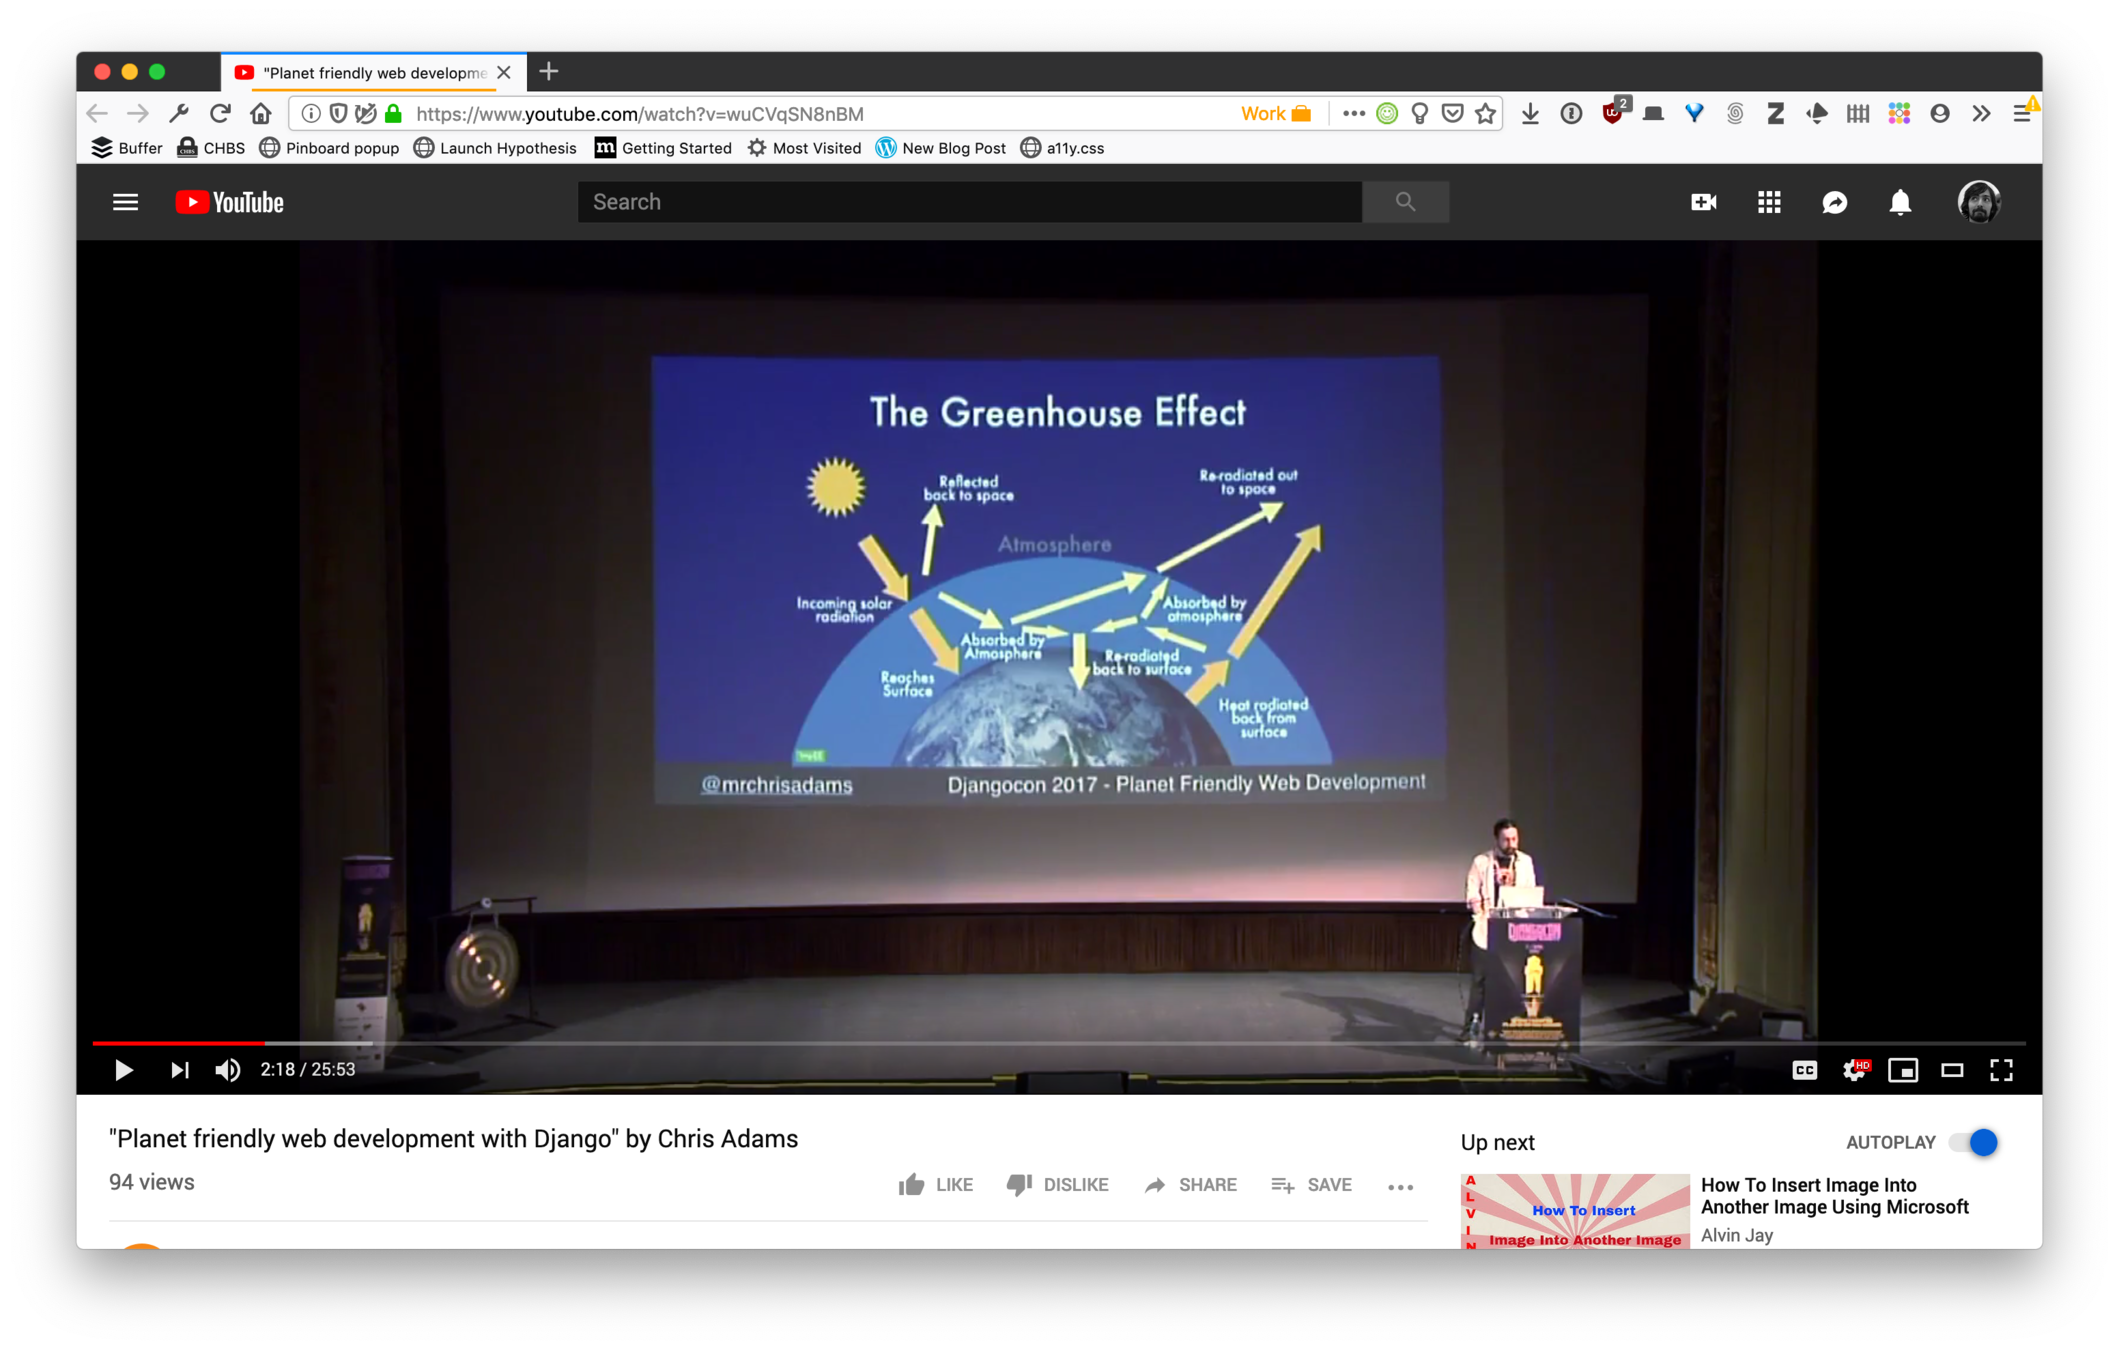
Not this Guy
This Guy
Chris Adams
@acdha
Chris Adams
@mrchrisadams


Successful, prolific, well known django developer
Environmentally focussed web generalist
Jupyter
Altair
Django
Notebooks
Theory
Applying it
Notebooks

jupyter

Narratives
collaborative
shareable
publishable
reproducible
That's nice.
Who's using them though?
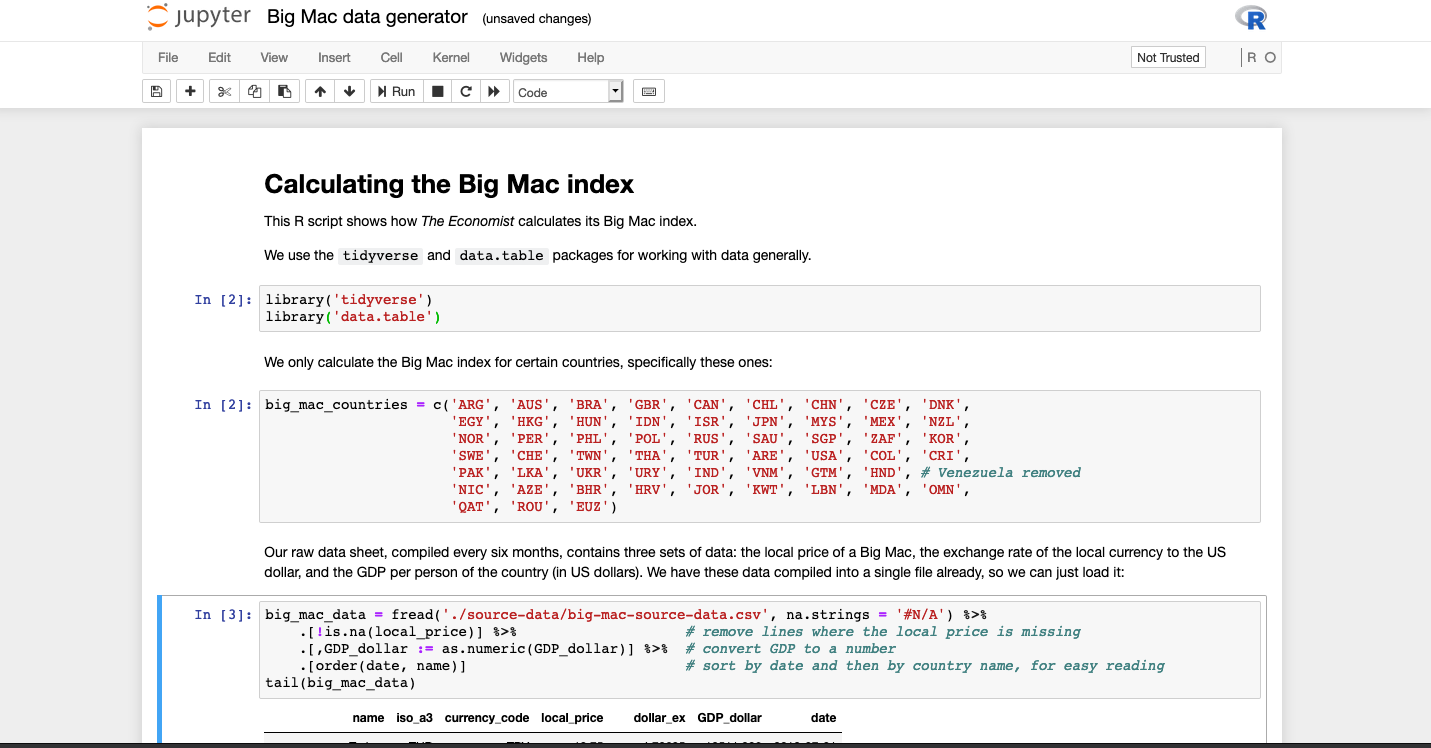
Currency trading with Economist and the Big Mac Index
... and now the source
Education
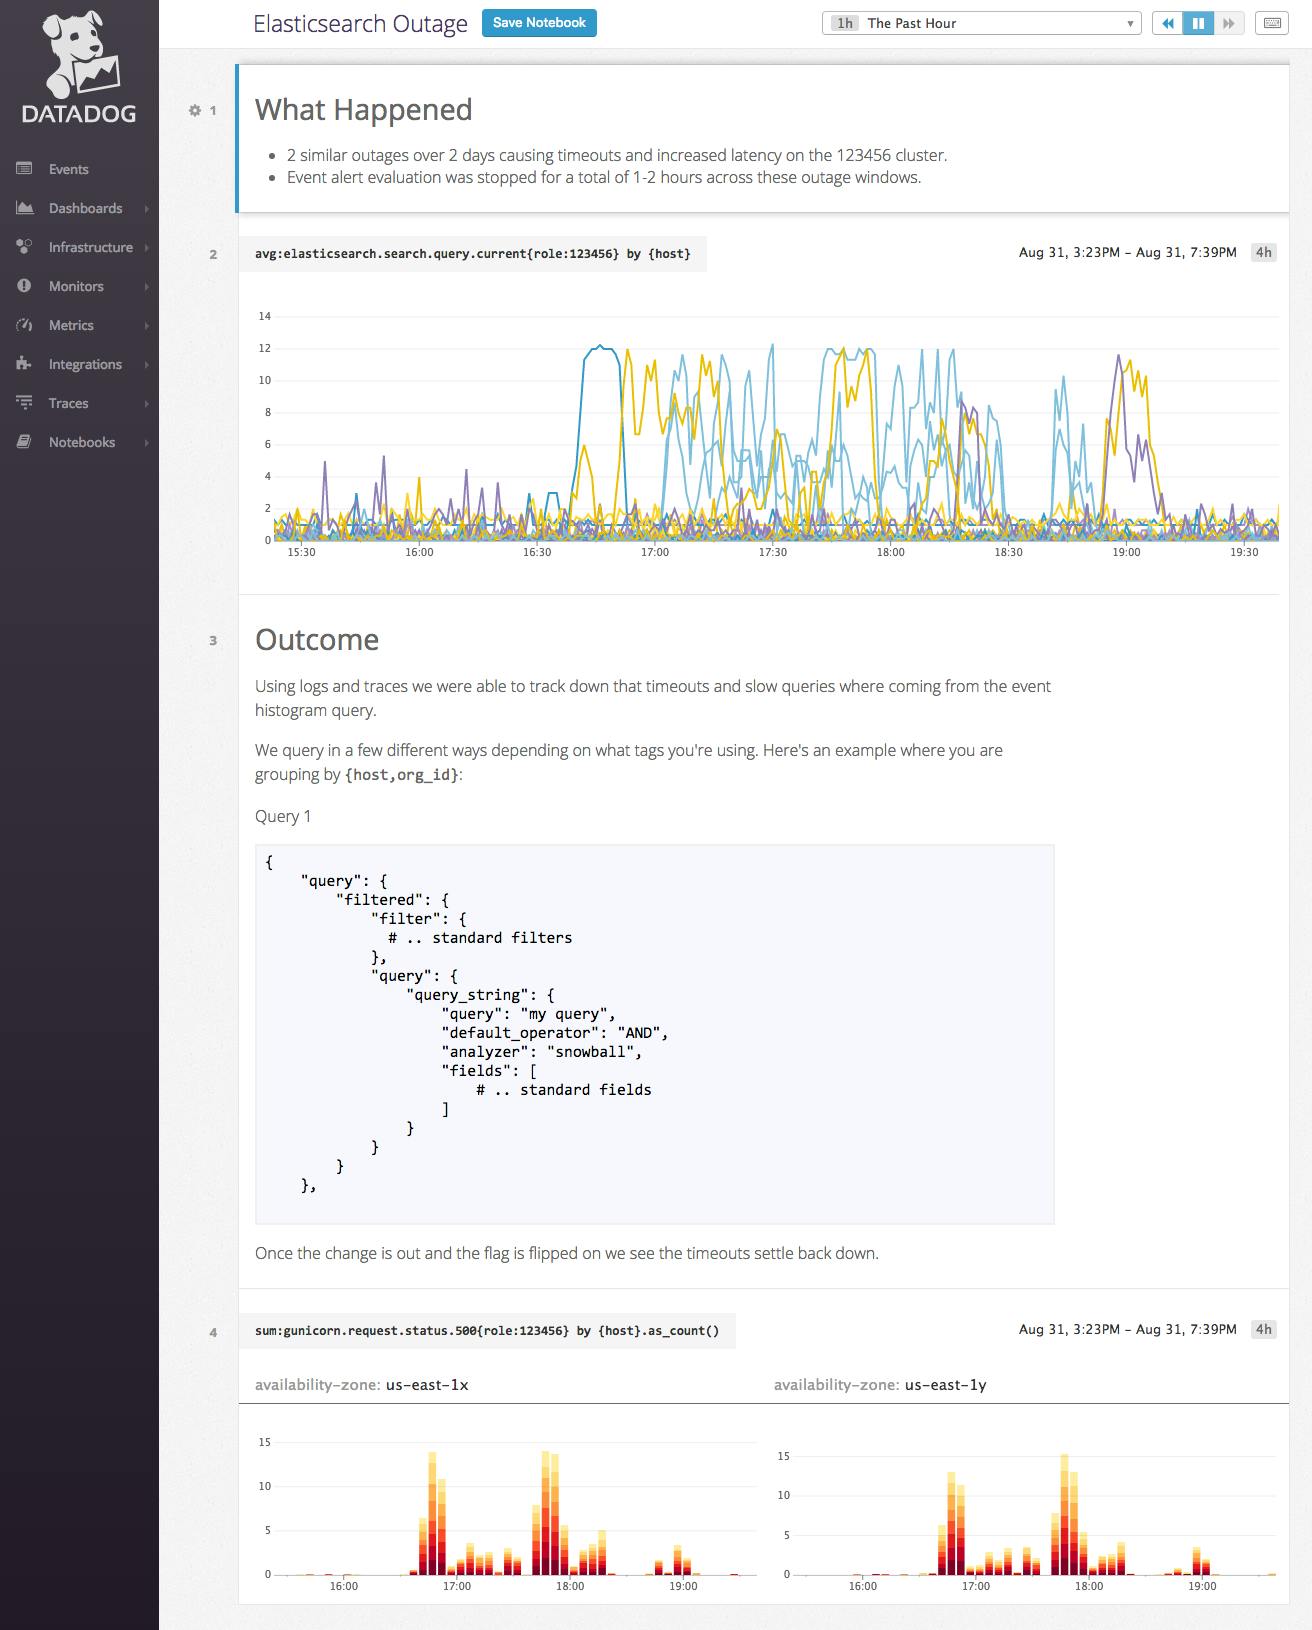
Operations
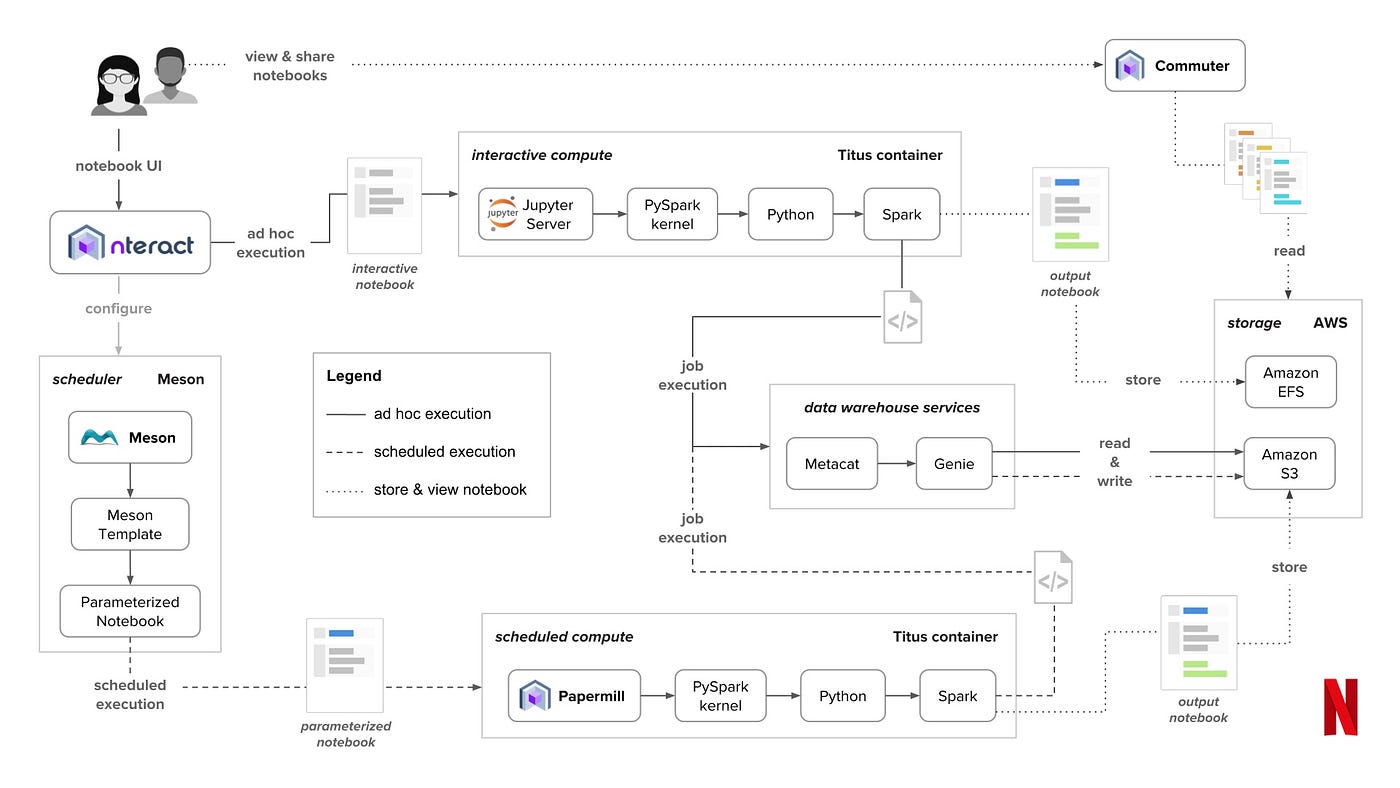
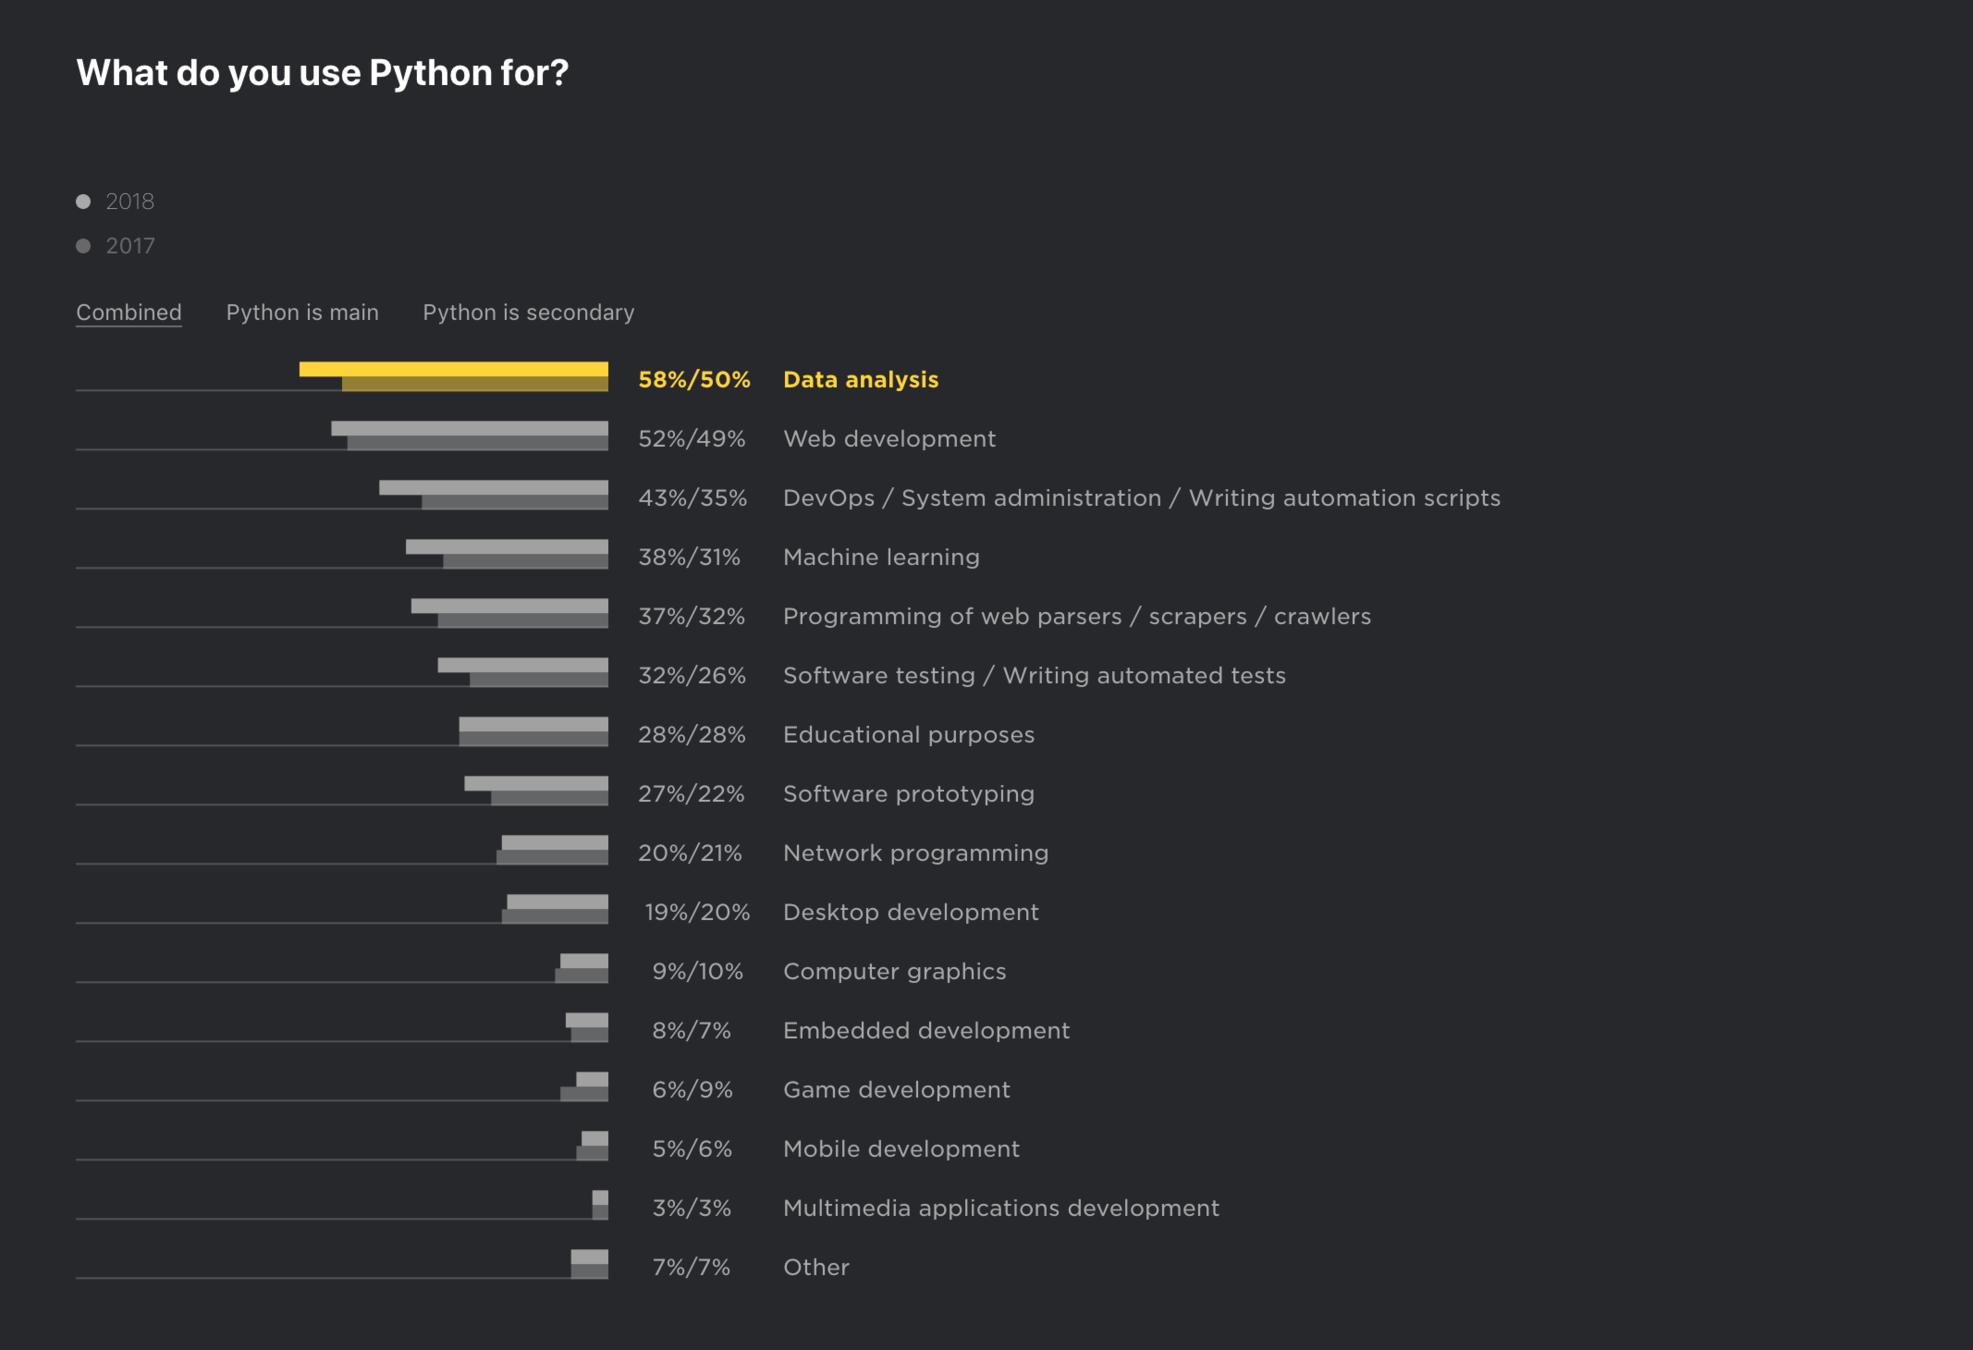
Business Analytics
How is this possible?
Ju
Py
teR

Decoupled Kernels
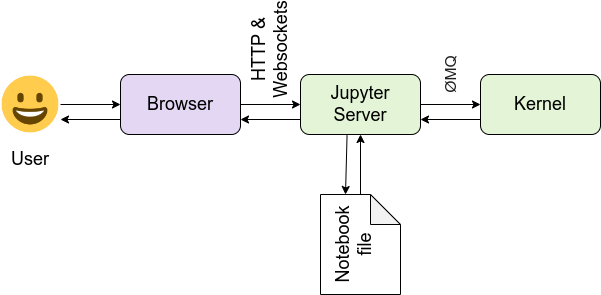
Browsers vs terminals
class CoolRedCar(models.Model):
    # please don't do this in real life

    model = models.CharField(max_length=254)
    top_speed = models.FloatField()

    def __str__(self):
        # should be __repr__()
        # if you just want the emoji
        return "🚗"
./manage.py shell
In [1]: cart = ShoppingCart.objects.get(
            user="chris"
        )
Out[1]: 🛒In [2]: [item for item in cart.items()]Out[2]: [🍌, 🍎, 🧀, 🍾, 🥖]How might we represent objects if we had a whole browser, instead of a terminal?
Finding a better representation of data
geojson
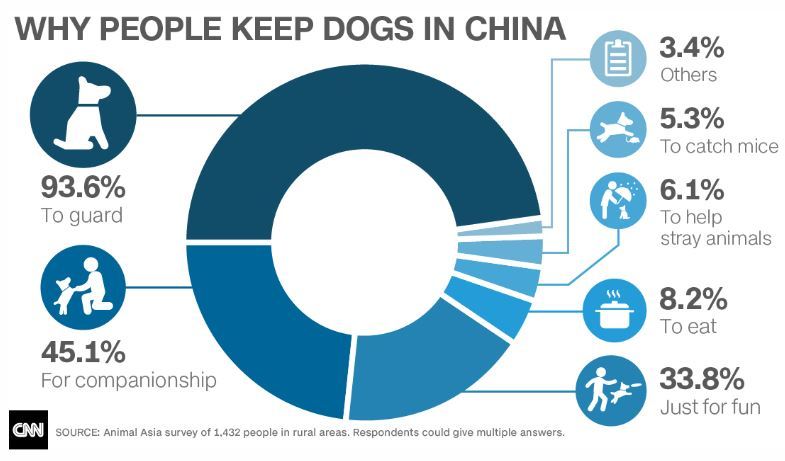
It's easy to get viz wrong
pip install viz-knowledge
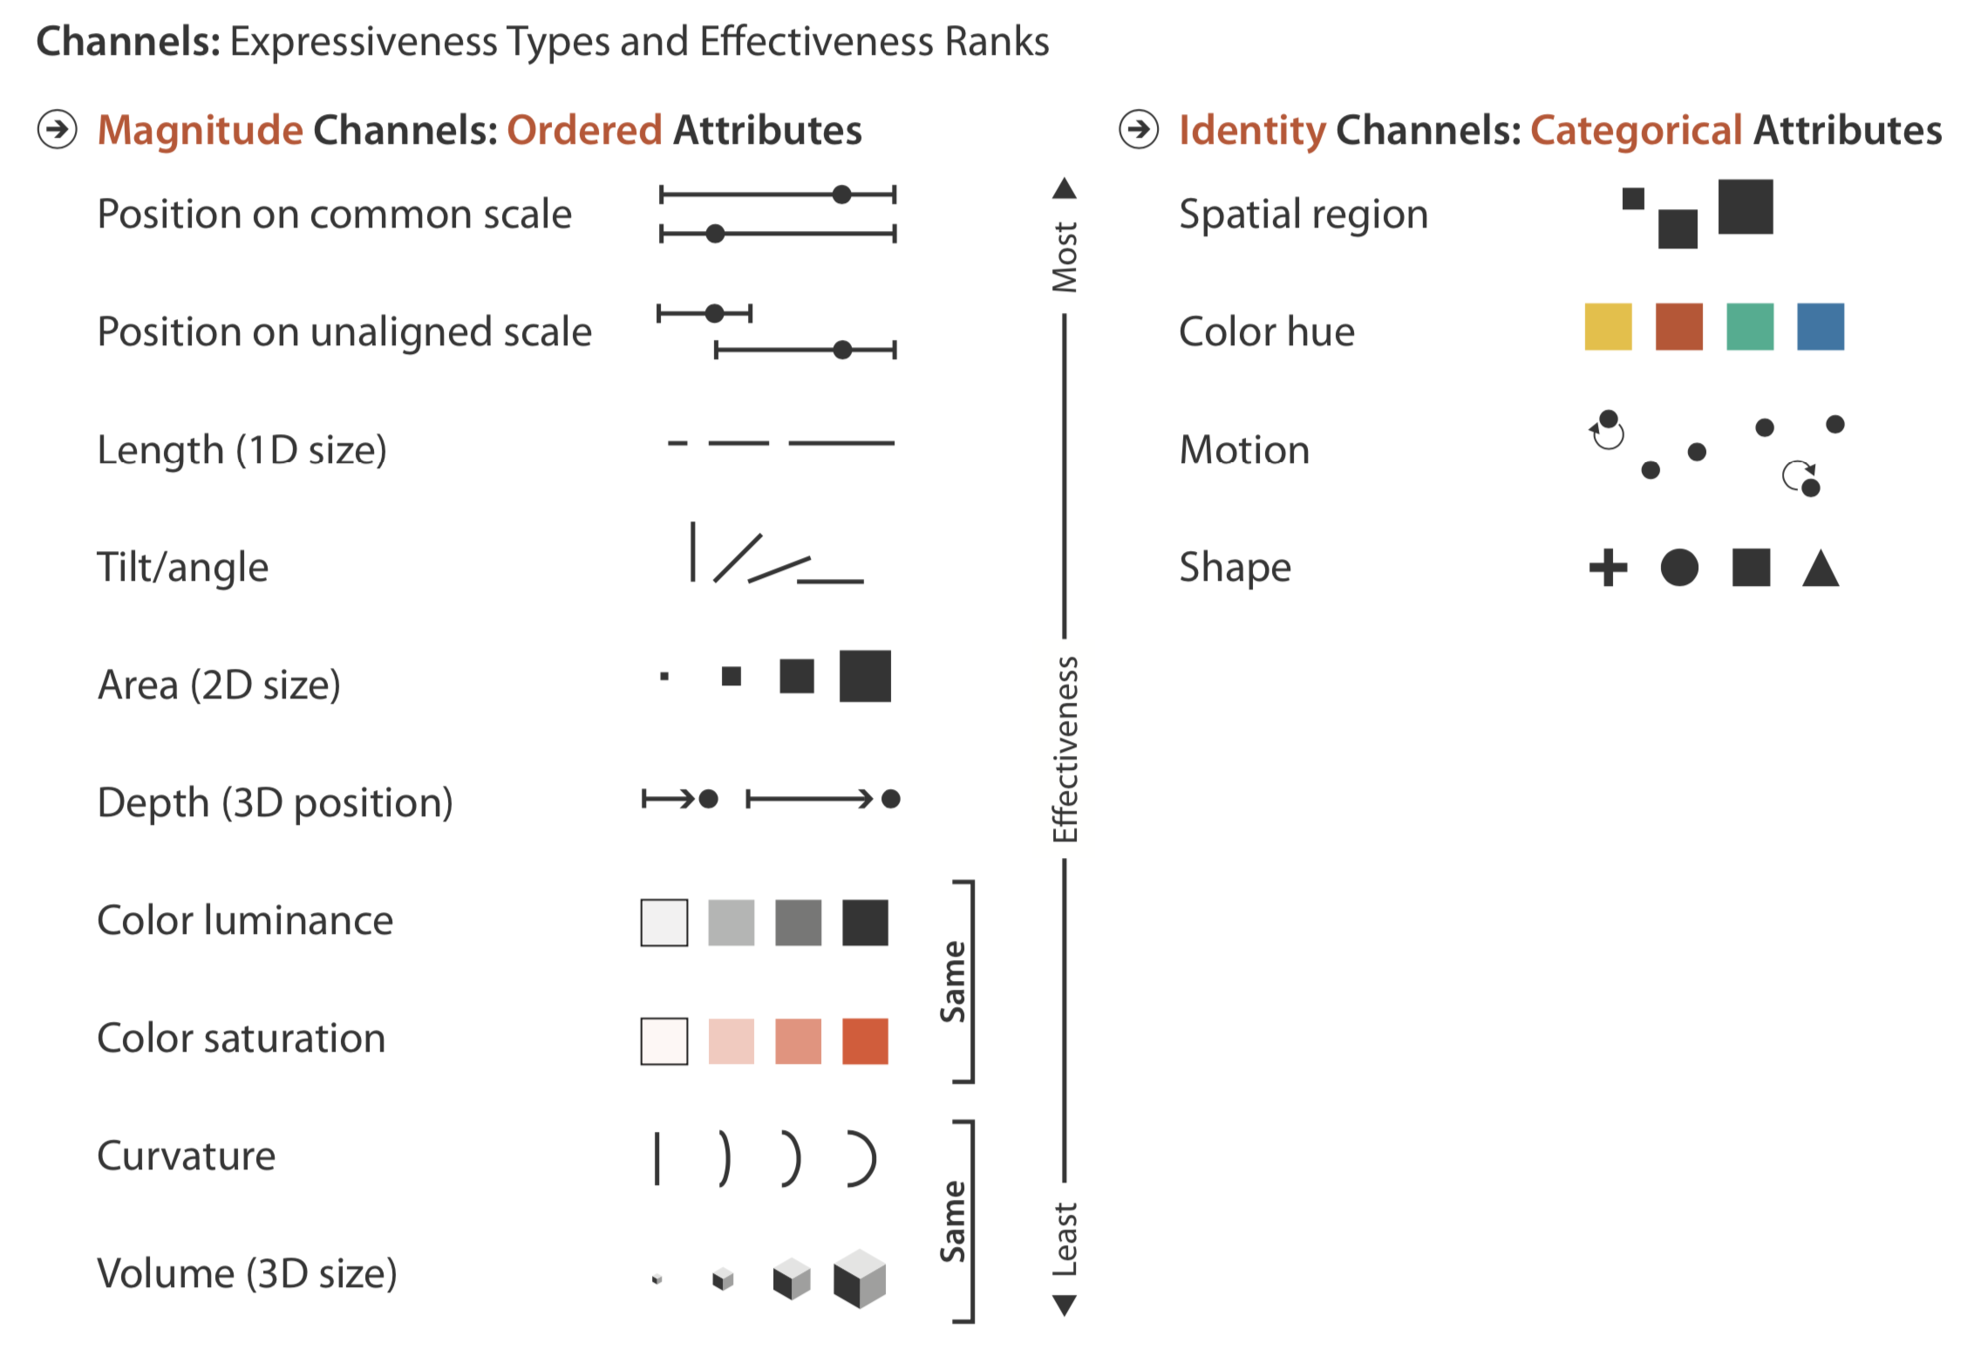
Theory
Tamara Munzner
Author of Visualization Analysis and Design


@tamaramunzner
"Oh my god, this woman has figured it *all* out"
Primitives for designing viz
Datatypes
(a bit like our data structures)

Attributes
(we call them that too)

Marks
(stuff on a screen or page)

Channels
(info we encode in the marks)

Examples
(so we can get comfortable with these ideas)

mark:
bar
channel:
x position
length
mark:
point
channel:
x-position
y-position
mark:
point
channel:
x position
y position
colour
mark:
point
channel:
x position
y position
colour
size
Which channels work best with which marks?
How do we use this?
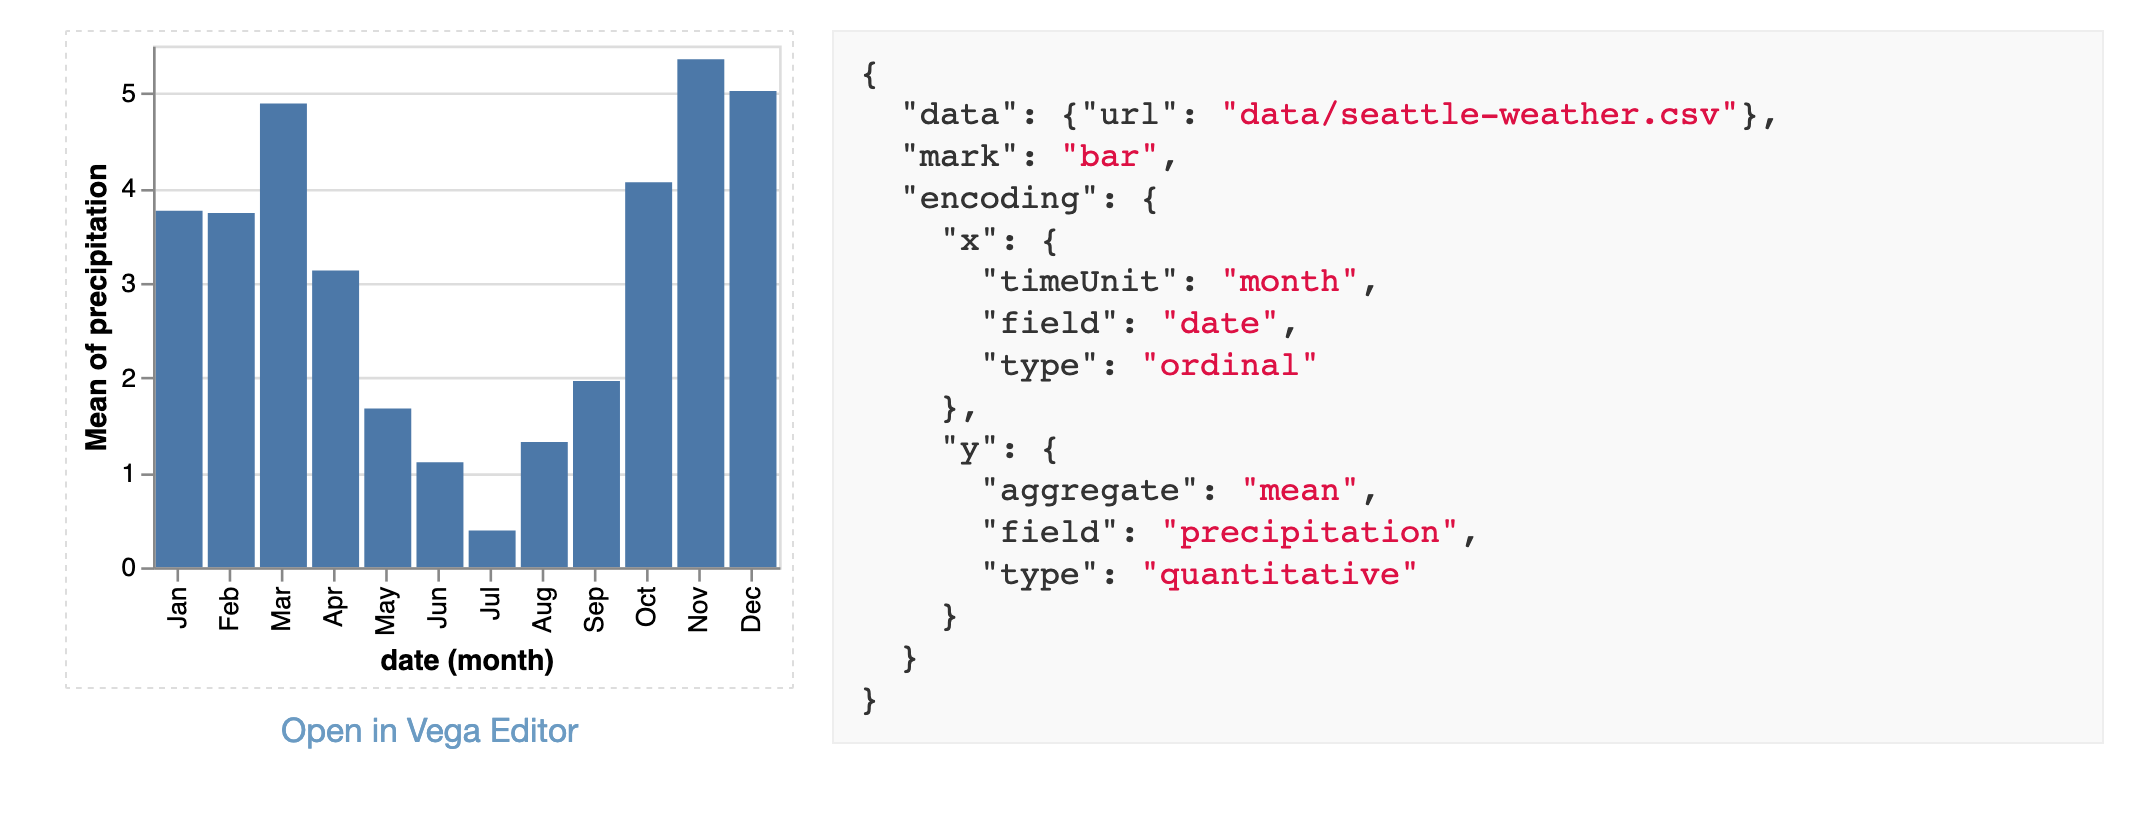
How do we use this … in Python?
import handylibrary as lib

# fetch our data
url = "https://domain.com/data/seattle-weather.csv"

# make our chart using our "marks and channels" grammar
lib.Chart(url).mark_bar().encode(
    alt.Y(
        'precipitation',
        type="quantitative"
    ),
    alt.X(
        'date',
        type="ordinal",
        timeUnit="month"
    )
)
What it's doing under the hood
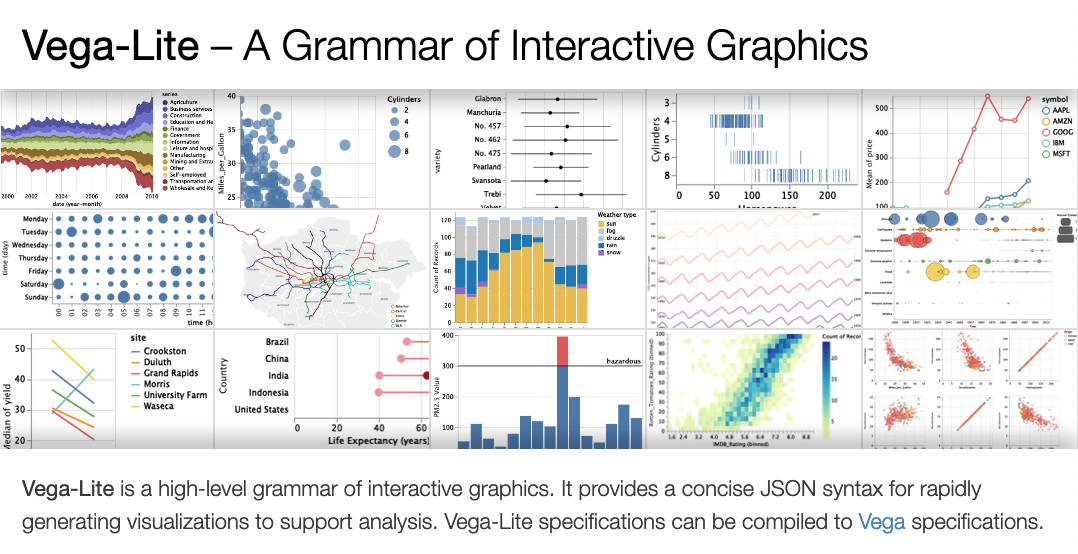
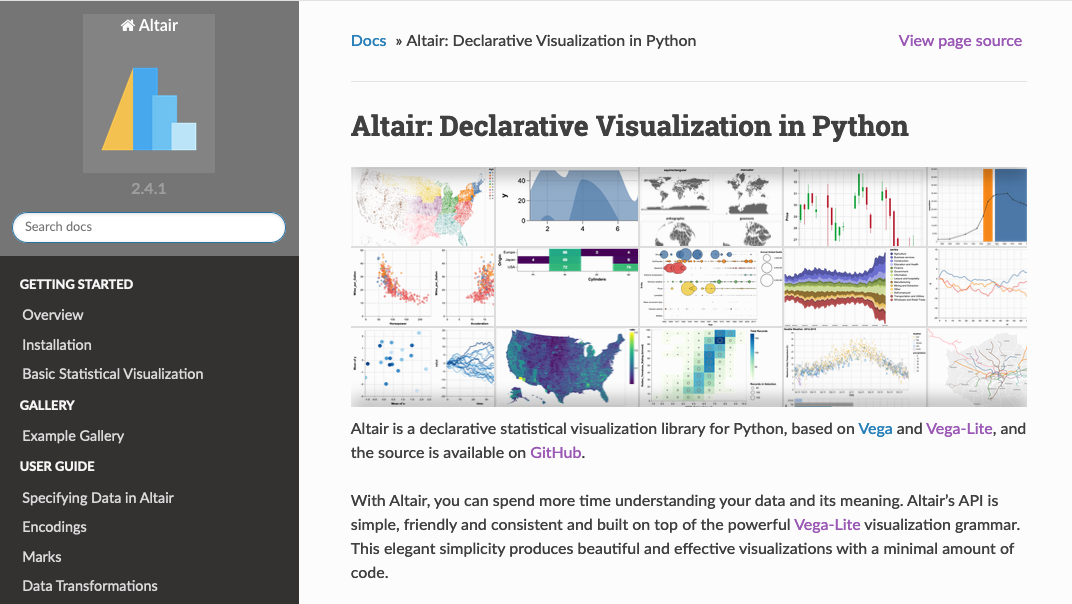
Altair
Vega-lite
Vega
D3
SVG / Canvas
😀
🙂
😅
😬
😰
We get to stay up here
(But can get help here if we want it)
Thanks Jake (and friends!)

Applying it
Remember this?
Our setup with django
ORM
Altair
Browser
🙂
fetch data our django app
render vega-lite in browser, with template tag or similar
import altair as alt
from django.http import JsonResponse
from django.shortcuts import render
from .models import MyModel

def my_cool_chart_view(req):
    query = MyModel.objects.all().values()
    data = alt.Data(values=list(query))
    chart_obj = alt.Chart(data).mark_bar().encode(
        # encode your data using the channels
        # and marks grammar we covered before
        # you want here
    )
    return JsonResponse(chart_obj)

def index_page(req):
    render(req, "index_page.html")
views.py
from django.urls import include, path
from . import views

urlpatterns = [
    path('cool_chart/',
        views.my_cool_chart_view,
        name='my-cool-chart'
    ),
    path('index/',
        views.viz_index_page,
        name='index-page'
    ),
]
urls.py
<!DOCTYPE html>
<html>
  <head>
      <!-- Load Vega, Vega-Lite & Vega Embed -->
    <script src="{% static 'src/assets/vega.min.js' %}"></script>
    <script src="{% static 'src/assets/vega-lite.min.js' %}"></script>
    <script src="{% static 'src/assets/vega-embed.min.js' %}"></script>
  </head>
<body>

  <div id="viz">
    <!-- viz will replace content here -->
  </div>

  <script type="text/javascript">
    var spec = "{% url 'my-cool-chart' %}";
    // transform the vega spec from altair as JSON,
    // and render our cool viz on the page
    vegaEmbed('#viz', spec)
  </script>
</body>
</html>
index_page.html
Quick and dirty example
Drawdown

please smile on me… demo gods
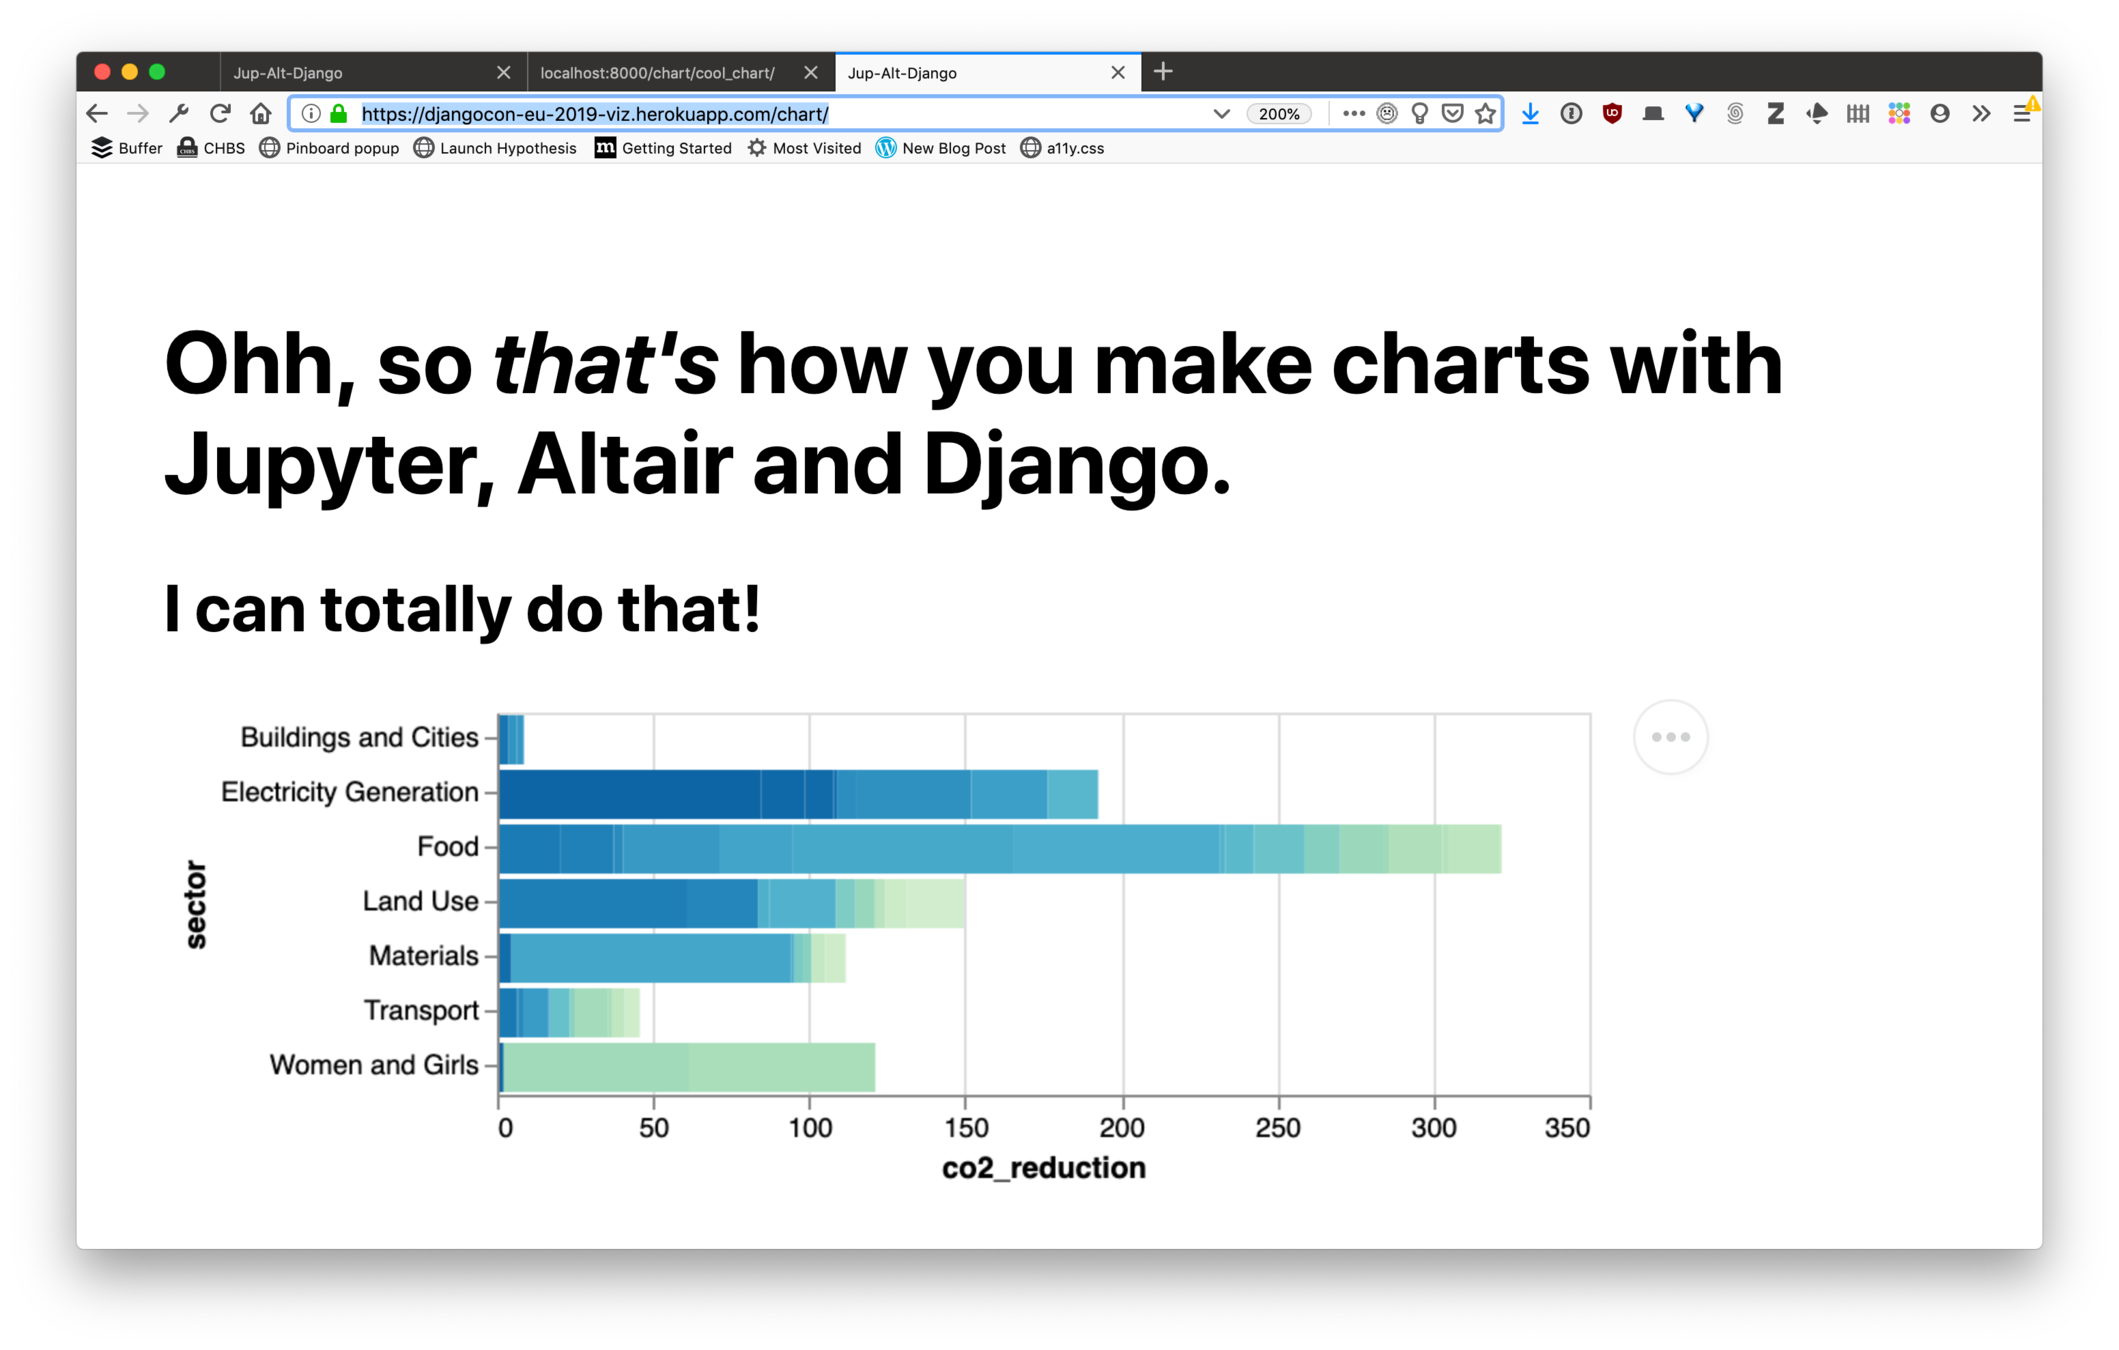
2/3 of public sector's CO2 emissions is in its supply chain. It's huge. Help us change this!
Notebooks
Theory
Applying it
Jupyter
Altair
Django
Thanks!
@mrchrisadams
chris@productscience.net
http://bit.ly/django-con-eu-2019-viz
http://github.com/mrchrisadams/djangocon-eu-2019
Come to the Green your Django Project workshop tomorrow
Jupyter, Django and Altair - Quick and Dirty Business Analytics
By Chris Adams
Jupyter, Django and Altair - Quick and Dirty Business Analytics
My talk for Djangocon EU 2019 in Copenhagen


