


Michael Recachinas
Software Engineer by day, Puppy dad by night
Michael Recachinas
#python
#bigdata
#cloud
#machinelearning
#cuda
#foosball
Software Engineer at @Axios/LGS
source: http://kubernetes.io/
################################### Cluster ###################################
cluster.name: od-fts1
#################################### Node #####################################
node.name: "od-fts1a"
node.master: true
node.data: true
node.rack: ${RACK_ENV_VAR}
node.max_local_storage_nodes: 1
#################################### Index ####################################
index.number_of_shards: 2
index.number_of_replicas: 1
#################################### Paths ####################################
path.conf: /path/to/conf
path.data: /path/to/data
path.work: /path/to/work
path.logs: /path/to/logs
path.plugins: /path/to/plugins
#################################### Plugin ###################################
plugin.mandatory: mapper-attachments,lang-groovy
################################### Memory ####################################
bootstrap.mlockall: true
############################## Network And HTTP ###############################
network.bind_host: 192.168.0.1
network.publish_host: 192.168.0.1
network.host: 192.168.0.1
transport.tcp.port: 9300
transport.tcp.compress: true
http.port: 9200
http.max_content_length: 100mb
http.enabled: false
################################### Gateway ###################################
gateway.type: local
gateway.recover_after_nodes: 1
gateway.recover_after_time: 10m
gateway.expected_nodes: 2
action.auto_create_index: false
action.disable_close_all_indices: true
action.disable_delete_all_indices: true
action.disable_shutdown: true
############################# Recovery Throttling #############################
indices.recovery.max_bytes_per_sec: 100mb
indices.recovery.concurrent_streams: 5
################################## Discovery ##################################
discovery.zen.minimum_master_nodes: 1
discovery.zen.ping.timeout: 3s
discovery.zen.ping.multicast.enabled: true
################################## Slow Log ##################################
index.search.slowlog.threshold.query.warn: 10s
index.search.slowlog.threshold.query.info: 5s
index.search.slowlog.threshold.query.debug: 2s
index.search.slowlog.threshold.query.trace: 500ms
index.search.slowlog.threshold.fetch.warn: 1s
index.search.slowlog.threshold.fetch.info: 800ms
index.search.slowlog.threshold.fetch.debug: 500ms
index.search.slowlog.threshold.fetch.trace: 200ms
index.indexing.slowlog.threshold.index.warn: 10s
index.indexing.slowlog.threshold.index.info: 5s
index.indexing.slowlog.threshold.index.debug: 2s
index.indexing.slowlog.threshold.index.trace: 500ms
################################## GC Logging ################################
monitor.jvm.gc.ParNew.warn: 1000ms
monitor.jvm.gc.ParNew.info: 700ms
monitor.jvm.gc.ParNew.debug: 400ms
monitor.jvm.gc.ConcurrentMarkSweep.warn: 10s
monitor.jvm.gc.ConcurrentMarkSweep.info: 5s
monitor.jvm.gc.ConcurrentMarkSweep.debug: 2slogstash.conf
input {
    tcp {
        port => 5000
    }
}

## Add your filters here

output {
    elasticsearch {
        hosts => "elasticsearch:9200"
    }
}
"input" is simply "where the data is coming from"
output is "where the data is going"
nc localhost 5000 < foo.logfilter {
grok {
match => { "message" => "%{COMBINEDAPACHELOG}" }
}
date {
match => [ "timestamp" , "dd/MMM/yyyy:HH:mm:ss Z" ]
}
}filters are in-line processing mechanisms that provide the flexibility to slice and dice your data to fit your needs
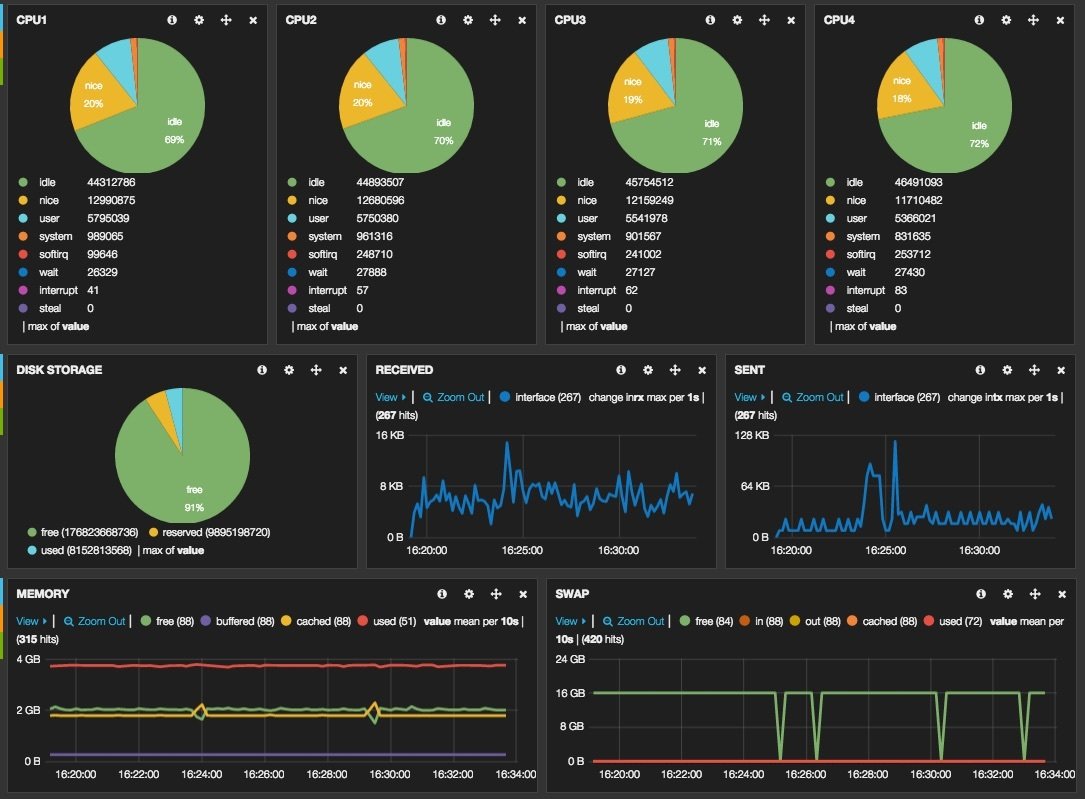
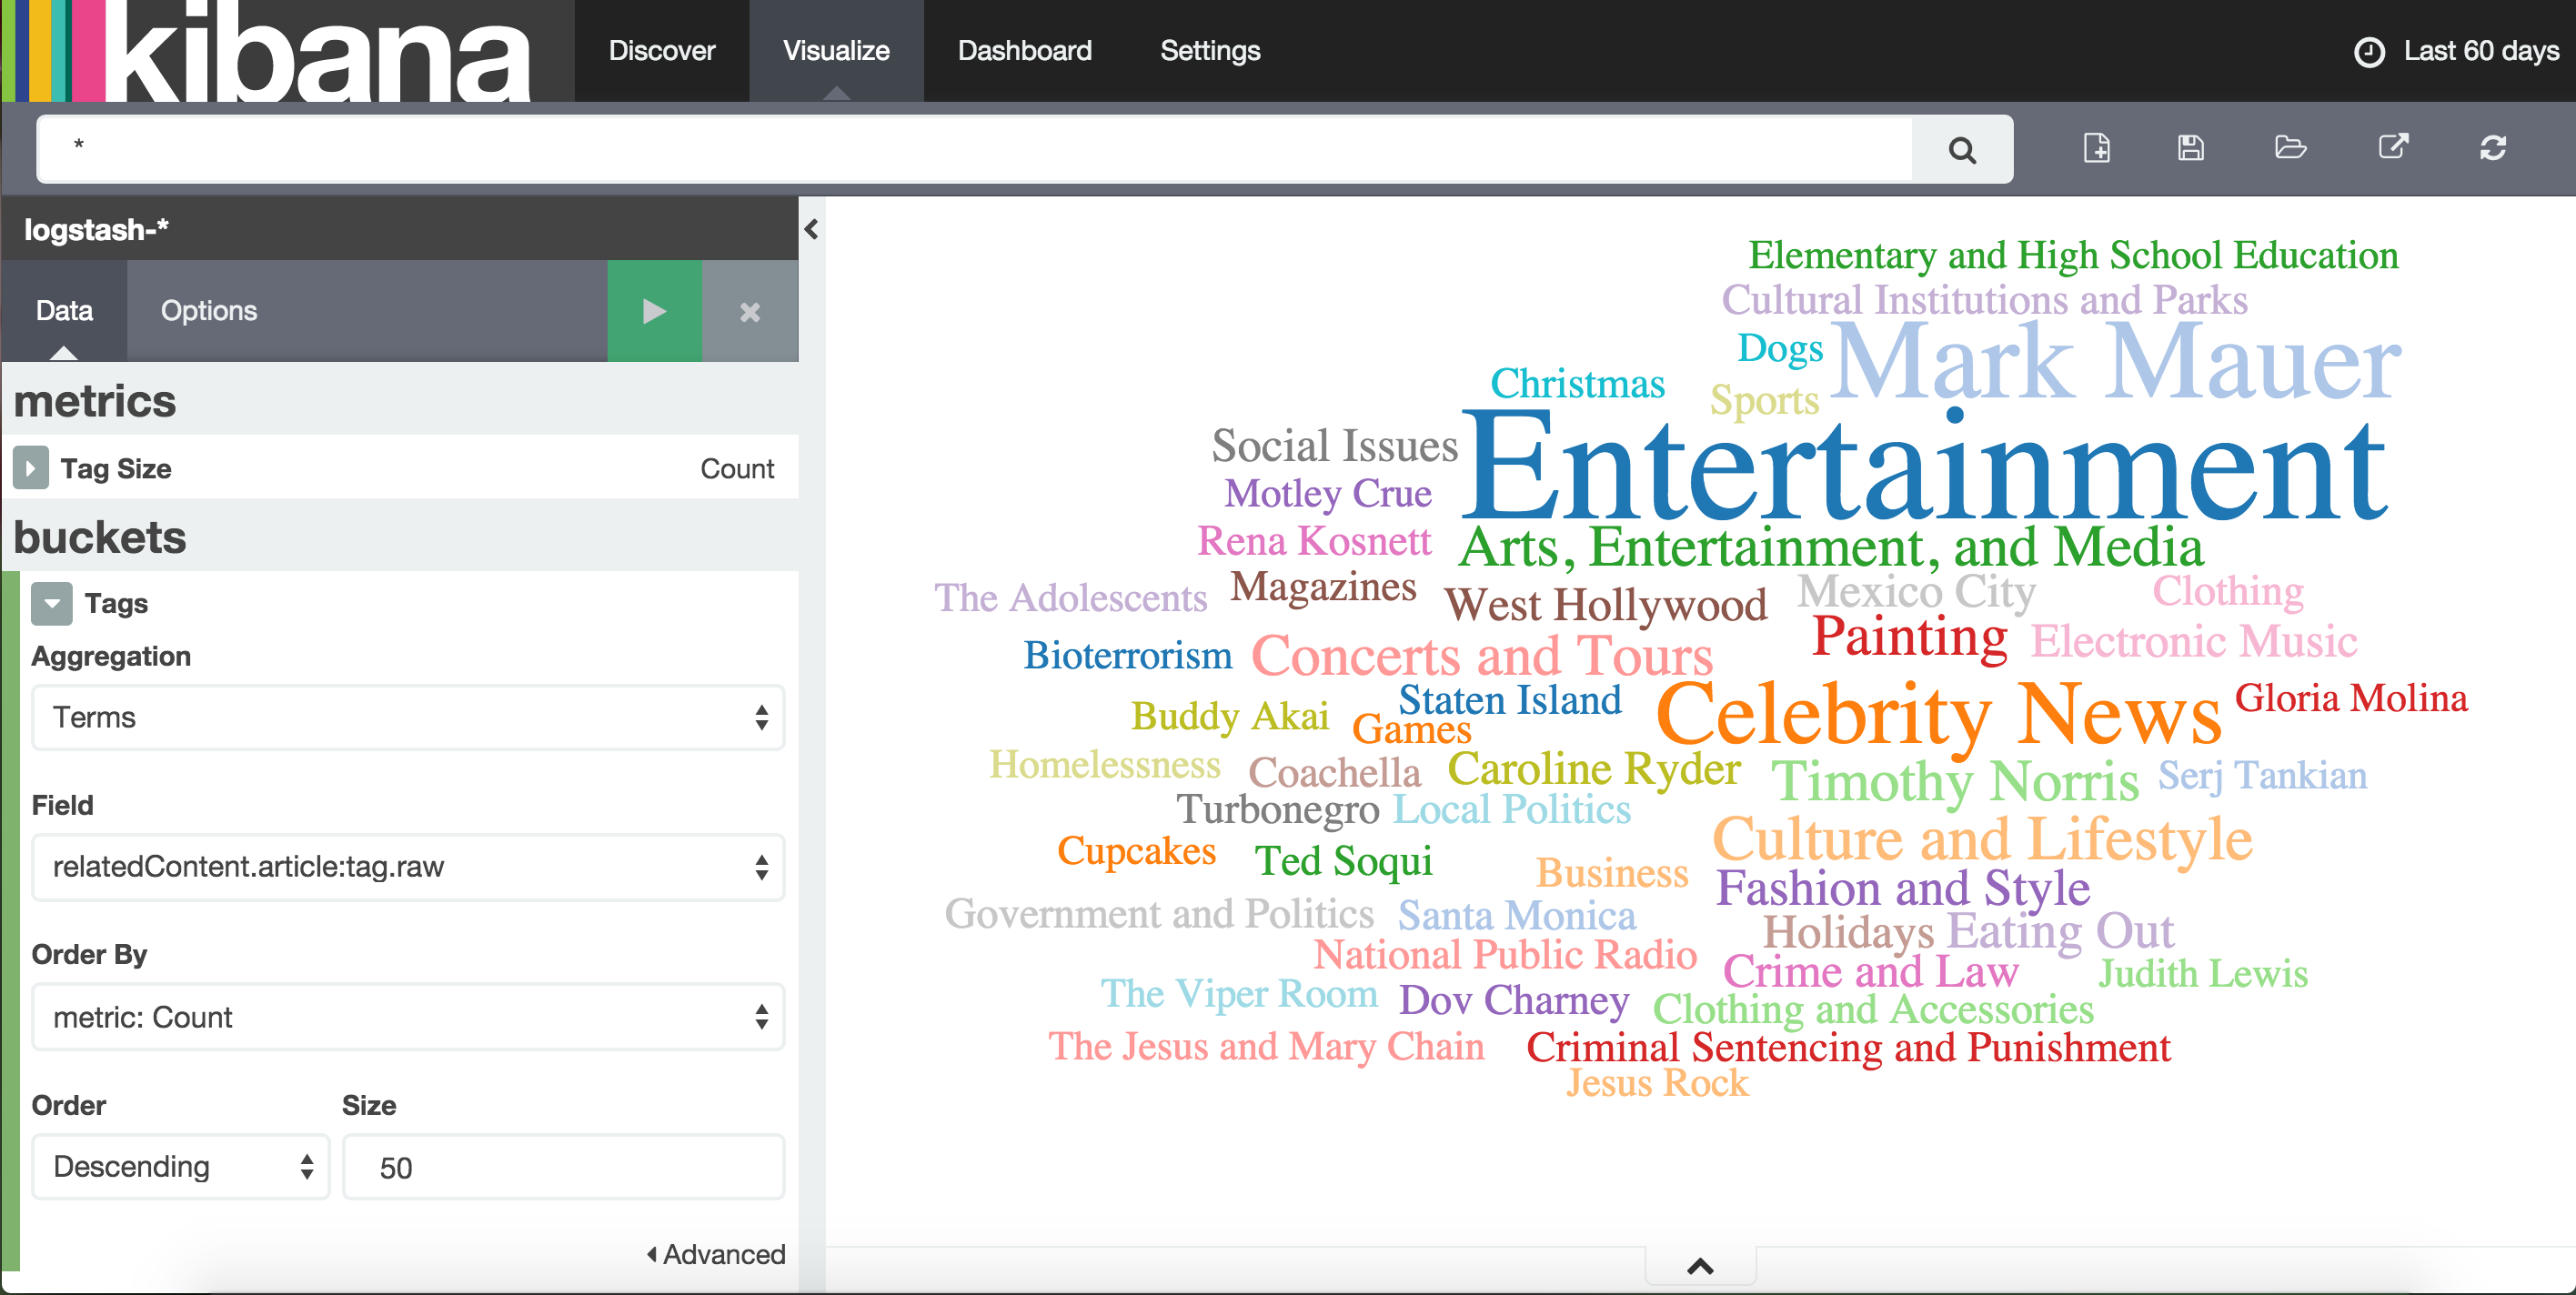
On the copa, copa Kibana
Similar to configuring Elasticsearch, the kibana.yml config denotes server info, elasticsearch info, and log info
# Kibana is served by a back end server. This setting specifies the port to use.
# server.port: 5601

# This setting specifies the IP address of the back end server.
# server.host: "0.0.0.0"
server.basePath: ""
server.maxPayloadBytes: 1048576
server.name: "your-hostname"
elasticsearch.url: "http://localhost:9200"
elasticsearch.preserveHost: true
kibana.index: ".kibana"
kibana.defaultAppId: "discover"
elasticsearch.username: "user"
elasticsearch.password: "pass"
server.ssl.cert: /path/to/your/server.crt
server.ssl.key: /path/to/your/server.key
elasticsearch.ssl.cert: /path/to/your/client.crt
elasticsearch.ssl.key: /path/to/your/client.key
elasticsearch.ssl.ca: /path/to/your/CA.pem
elasticsearch.ssl.verify: true
elasticsearch.pingTimeout: 1500
elasticsearch.requestTimeout: 30000
elasticsearch.requestHeadersWhitelist: [ authorization ]
elasticsearch.shardTimeout: 0
elasticsearch.startupTimeout: 5000
pid.file: /var/run/kibana.pid
logging.dest: stdout
logging.silent: false
logging.quiet: false
logging.verbose: false
ops.interval: 5000docker-compose.yml (v1)
elasticsearch:
  image: elasticsearch:latest
  command: elasticsearch -Des.network.host=0.0.0.0
  ports:
    - "9200:9200"
    - "9300:9300"
logstash:
  image: logstash:latest
  command: logstash -f /etc/logstash/conf.d/logstash.conf
  volumes:
    - ./logstash/config:/etc/logstash/conf.d
  ports:
    - "5000:5000"
  links:
    - elasticsearch
kibana:
  build: kibana/
  volumes:
    - ./kibana/config/:/opt/kibana/config/
  ports:
    - "5601:5601"
  links:
    - elasticsearch
container names are at the outermost level, with the reference image denoted by "image"
port-mappings are local:container
"command" is the command to run after the image is built and started
"build" is used if a sub-directory has a Dockerfile
"volumes" specifies volume-mappings from local:container
"links" link containers to another service; makes hostnames identical to the service name
docker-compose.yml (v2)
version: '2'
services:
  elasticsearch:
    image: elasticsearch:latest
    command: elasticsearch -Des.network.host=0.0.0.0
    ports:
      - "9200:9200"
      - "9300:9300"
  logstash:
    image: logstash:latest
    command: logstash -f /etc/logstash/conf.d/logstash.conf
    volumes:
      - ./logstash/config:/etc/logstash/conf.d
    ports:
      - "5000:5000"
    depends_on:
    - elasticsearch
kibana:
    build: kibana/
    volumes:
      - ./kibana/config/:/opt/kibana/config/
    ports:
      - "5601:5601"
    depends_on:
      - elasticsearch
version denotes which version of docker-compose this file is
links => depends_on
services now sits at the outer layer to describe what containers will be built and run
By Michael Recachinas