XHProf
Nguyen Tien Si
GO1
Agenda
-
What/Why/When??
-
Installing & Configuring
-
Introduction
-
Profiling using XHProf
-
Question?
What?
Profiling is measuring the relative performance of your application at the code-level. Profiling will capture things like CPU usage, memory usage, time and number of calls per function, as well as capturing a call graph.
Why?
Many common cause of slowdowns:
-
Databases (MySQL, PostgreSQL,...)
-
External Resources (APIs, Filesystems, ...)
-
Bad Code
We will be a waste of time for optimization
When?
-
Do I have a performance issue?
-
How big of a problem do I have?
Installing & Configuring
# Debian
sudo apt-get install php5-xhprof

# Pecl
sudo peer upgrade peer
sudo pecl install -f xhprof

# Enable inside php.ini
[xhprof]
extension=xhprof.so
xhprof.output_dir="/tmp/xhprof"

# Restart web server
sudo apachectl restart
With Drupal
<?php
// With Drupal
// Add bottom at settings.php, shared by Andy Truong

if (extension_loaded('xhprof')) {
  define('XHPROF_KEY',    'profile');
  define('XHPROF_ROOT',   '/Users/mrsinguyen/Workspaces/www/xhprof');
  define('XHPROF_DOMAIN', 'localhost/xhprof/xhprof_html');
  define('XHPROF_SOURCE', $_SERVER['SERVER_NAME']);
  define('XHPROF_FLAGS',  XHPROF_FLAGS_NO_BUILTINS | XHPROF_FLAGS_CPU | XHPROF_FLAGS_MEMORY);
  define('XHPROF_SYMBOL', 'menu_execute_active_handler');

  function user_init() {
    if (!empty($_GET[XHPROF_KEY])) {
      require_once XHPROF_ROOT . "/xhprof_lib/utils/xhprof_lib.php";
      require_once XHPROF_ROOT . "/xhprof_lib/utils/xhprof_runs.php";
      xhprof_enable(XHPROF_FLAGS);
    }
  }

  function system_exit() {
    if (!empty($_GET[XHPROF_KEY])) {
      $id = (new XHProfRuns_Default())->save_run(xhprof_disable(), XHPROF_SOURCE);
      echo sprintf(
        '<a href="//%s/?symbol=%s&source=%s&run=%s">%s</a>',
        XHPROF_DOMAIN, XHPROF_SYMBOL, XHPROF_SOURCE, $id, "XHProf #{$id}"
      );
    }
  }
}
With block of code
<?php


// Start profiling
if (extension_loaded('xhprof')) {
  define('XHPROF_ROOT', '/Users/mrsinguyen/Workspaces/www/xhprof');
  define('XHPROF_APP', 'block');
  define('XHPROF_FLAGS', XHPROF_FLAGS_NO_BUILTINS | XHPROF_FLAGS_CPU | XHPROF_FLAGS_MEMORY);
  require_once XHPROF_ROOT . "/xhprof_lib/utils/xhprof_lib.php";
  require_once XHPROF_ROOT . "/xhprof_lib/utils/xhprof_runs.php";
  xhprof_enable(XHPROF_FLAGS);

  // The code need profile


  $id = (new XHProfRuns_Default())->save_run(xhprof_disable(), XHPROF_APP);
}
Support HHVM?
Yes, see more at http://docs.hhvm.com/manual/en/book.xhprof.php
Introduction
-
XHProf is a function-level hierarchical profiler for PHP and has a simple HTML based user interface
-
Originally developed at Facebook, XHProf was open sourced in Mar, 2009.
-
As you know: Xdebug is an active profiler and Xhprof is a passive profiler.
Xhprof provides:
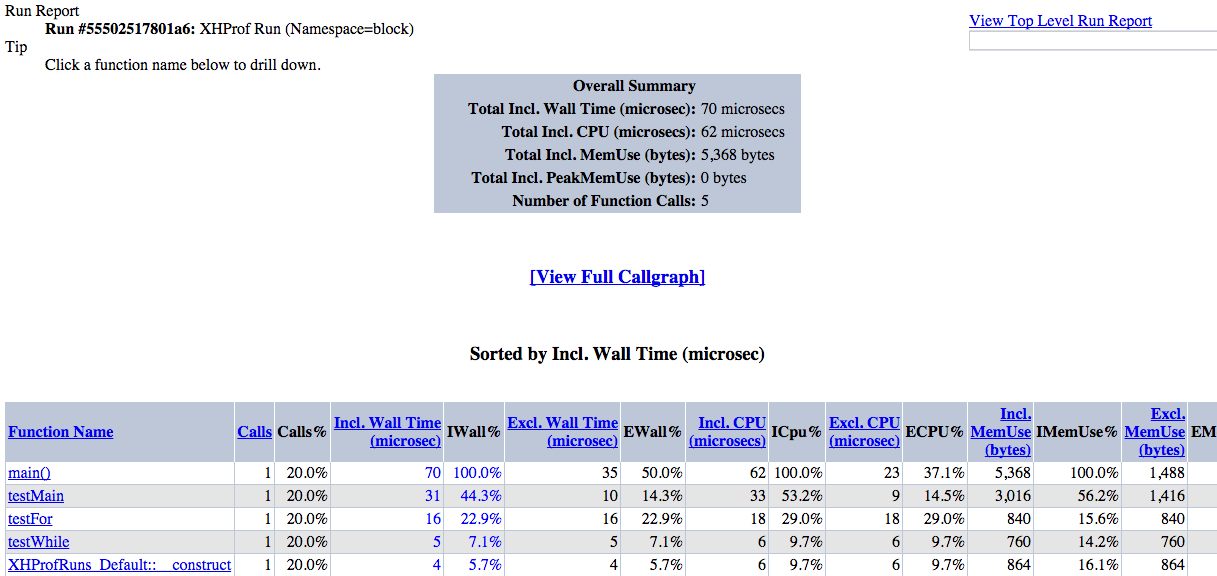
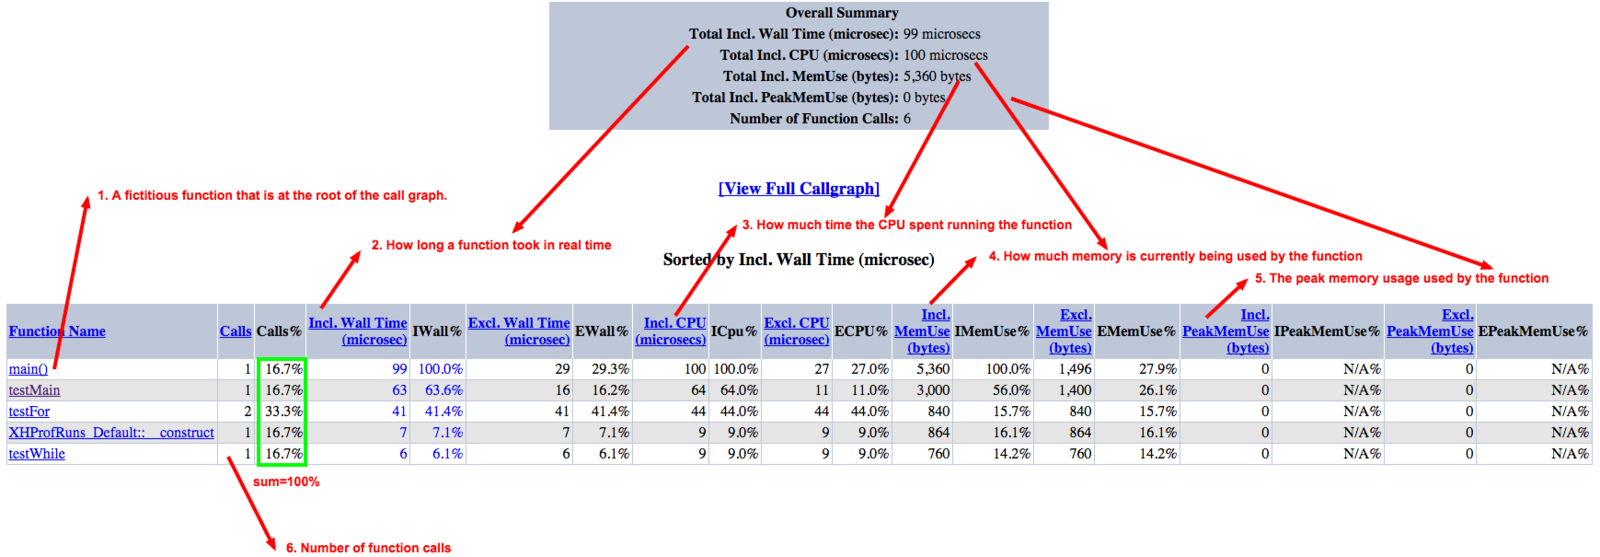
Flat Profile
Function-level summary information such as number of calls, inclusive/exclusive wall time, memory usage, and CPU time.
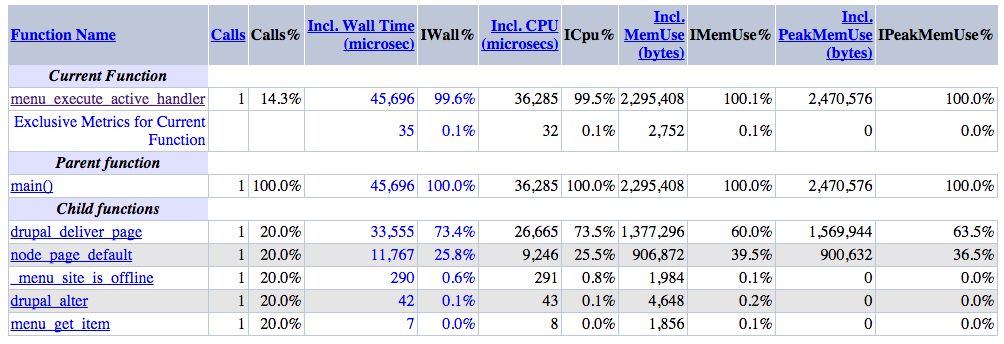
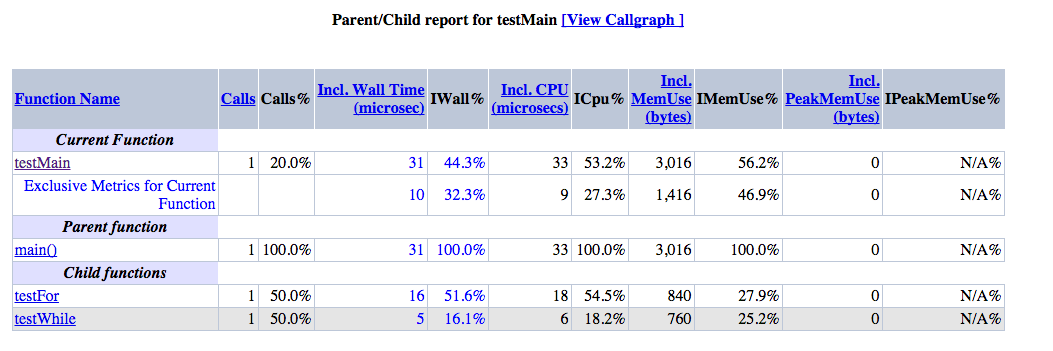
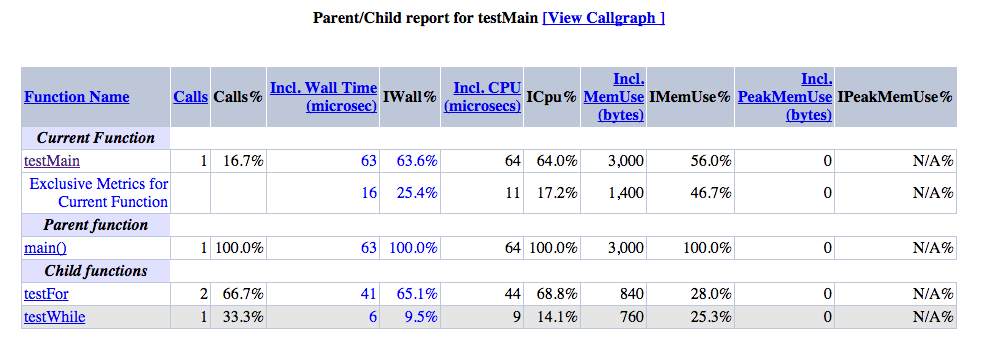
Hierarchical Profile
For each function, it provides a breakdown of calls and times per parent (caller) & child (callee), such as:
-
what functions call a particular function and how many times?
-
what functions does a particular function call?
-
The total time spent under a function when called from a particular parent.
Hierarchical Profile
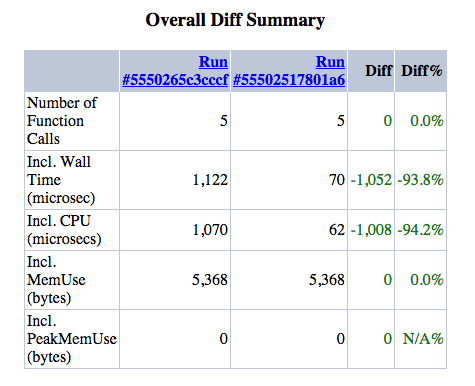
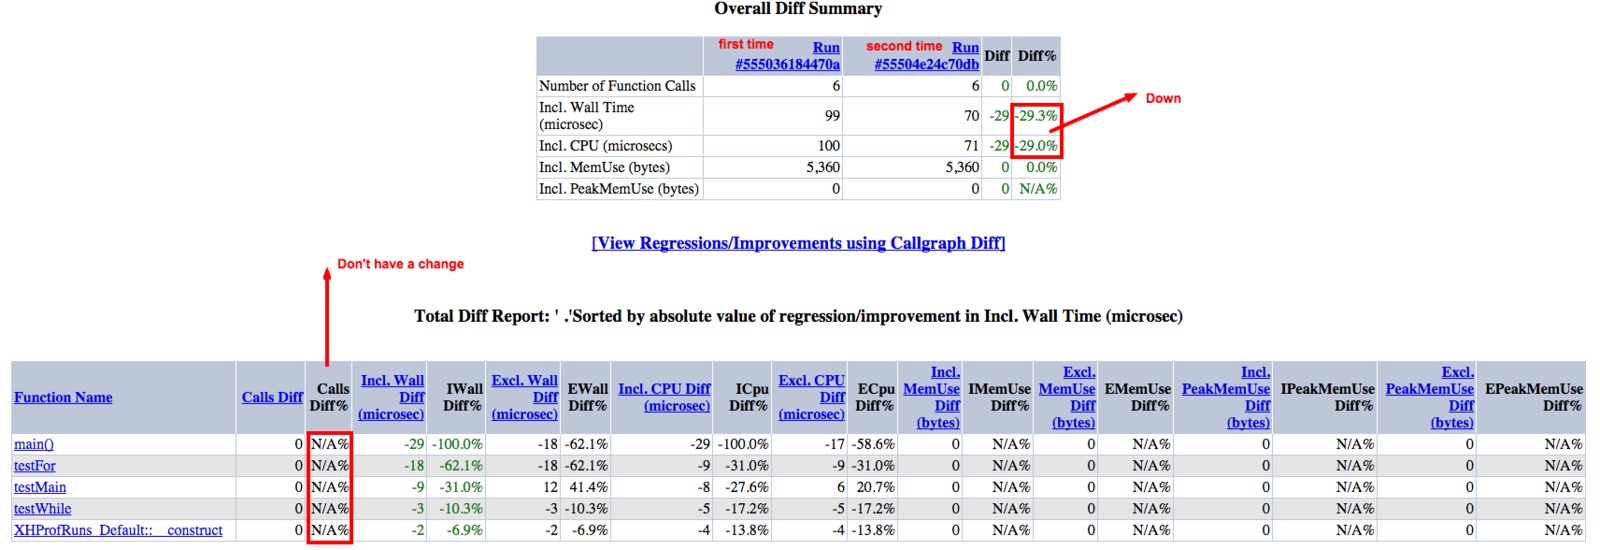
Diff Reports
A diff report takes two runs as input and provides both flat function-level diff information, and hierarchical information (breakdown of the diff by parent/children functions) for each function.
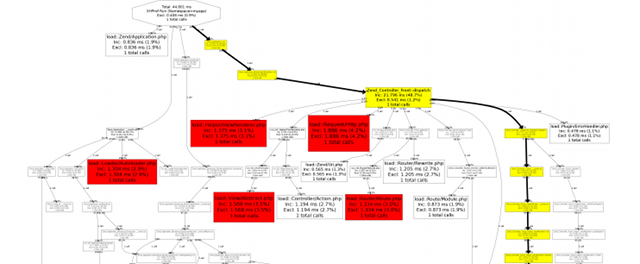
Callgraph View
The profile data can also be viewed as a callgraph. The callgraph view highlights the critical path of the program.
Memory Profile
XHProf's memory profile mode helps track functions that allocate lots of memory.
Limitations
XHProf keeps track of only 1-level of calling context (1-level up or 1-level down).
Profiling using XHProf
Profiling using XHProf
References
-
http://www.kam24.ru/xhprof/docs/
-
https://blog.engineyard.com/2014/profiling-with-xhprof-xhgui-part-2
-
https://pecl.php.net/package/xhprof
-
https://github.com/phacility/xhprof
-
https://gist.github.com/mrsinguyen/4b811a907ae0e915e25c - source code
Question?
Profiling PHP with XHProf
By Nguyen Tien Si
Profiling PHP with XHProf
Profiling PHP with XHProf