Exploratory Data Analysis with

Maria Schreiber
Grace Hopper Program
April 20, 2017
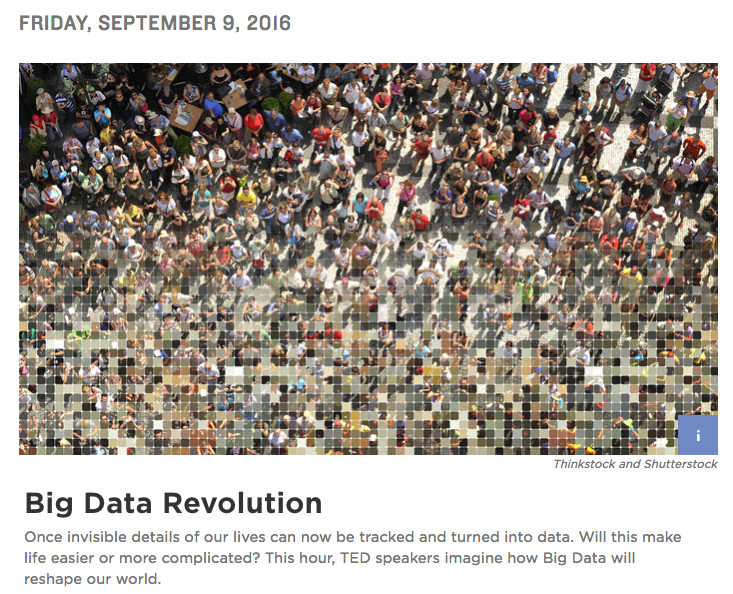
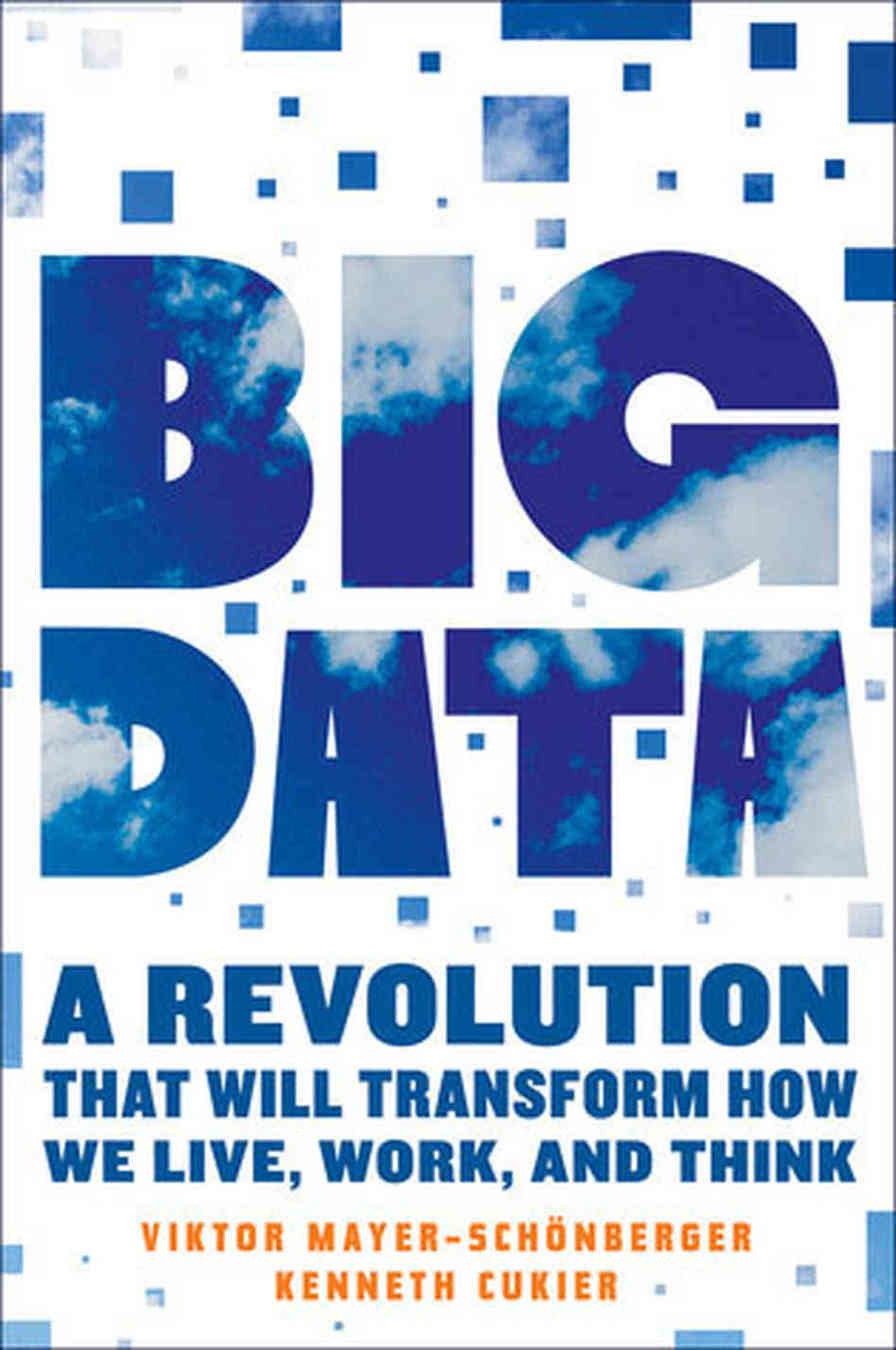
What do you think of when you hear 'big data'?
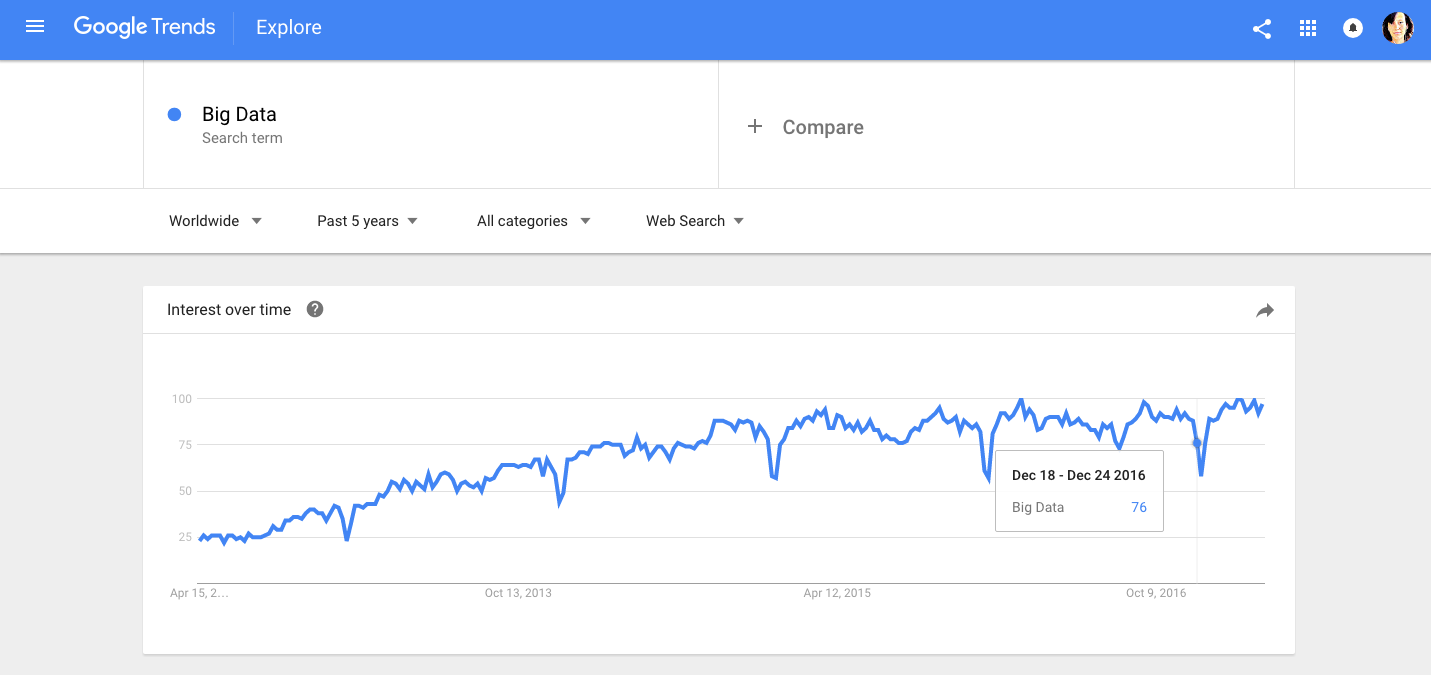
'Big Data'?
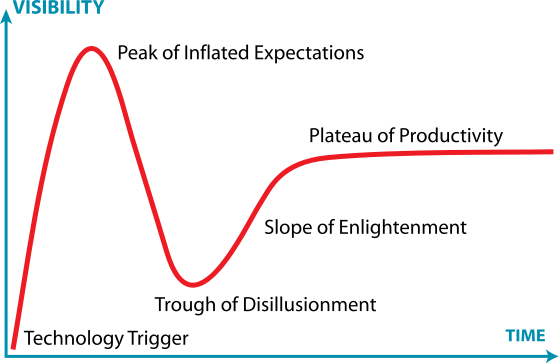
We tend to overestimate the effect of a technology in the short run and underestimate the effect in the long run.
- Roy Amara
Gartner Hype Cycle
How is 'big data' analyzed?
- Formulating questions/hypotheses
- Data collection/identification
- Data wrangling/munging
- Exploratory data analysis
- Formal modeling/prediction/analysis
- Drawing and communicating conclusions
Exploratory Data Analysis
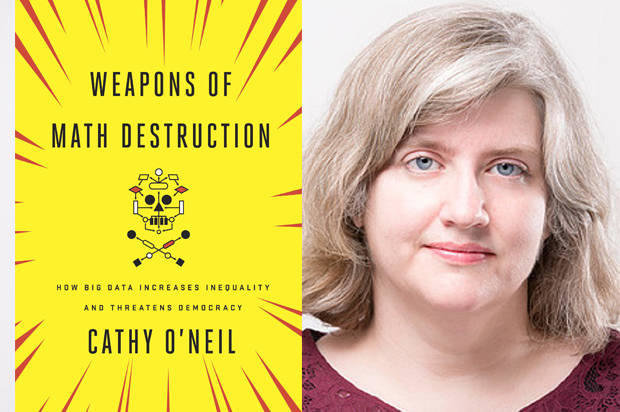
EDA happens between you and the data and isn't about proving anything to anyone else yet.
- Cathy O'Neil

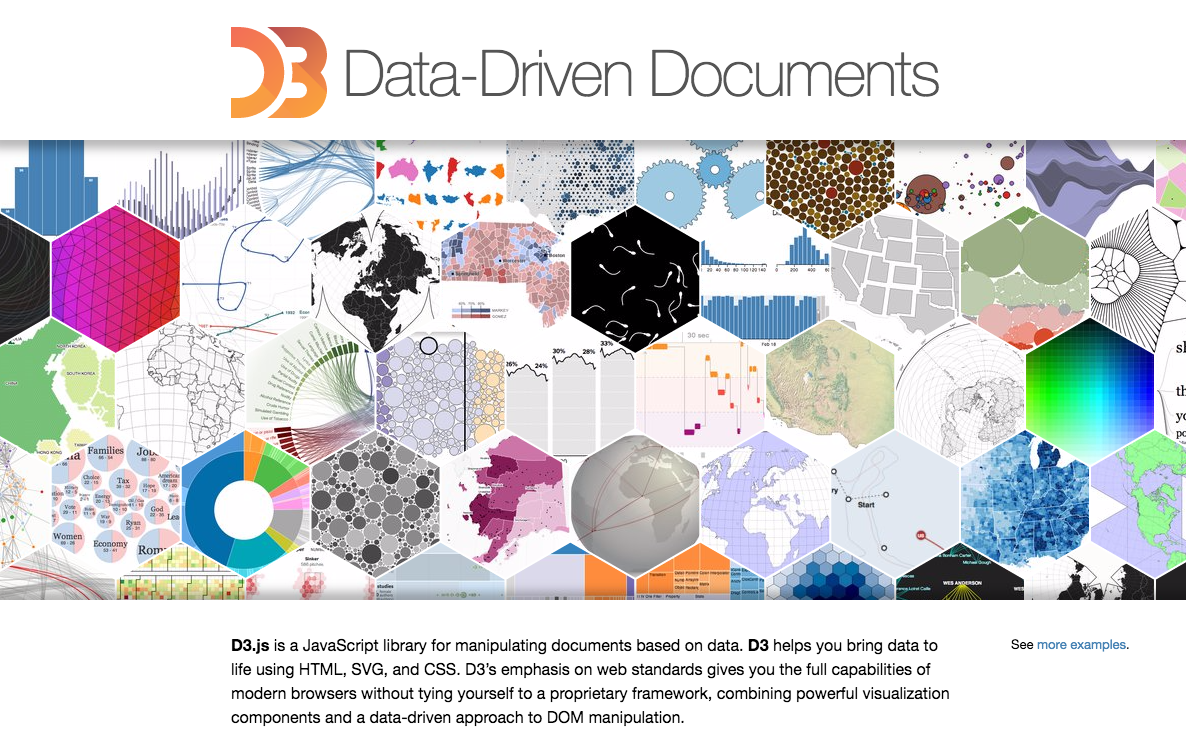
Here's where R comes in!
Wait, what is R?
- Open source statistical programming language
- Initially released in 1995, but is gaining in popularity
- Interpreted language - can be used in the CLI, but there are also many nice GUIs
- Enhanced by user-written packages
Why R ?
And are there other options?
- Yes, it's another programming language, but it's easy to learn and use (at least on a basic level).
- It includes both statistical overviews and visualizations all in one handy package!
- But there are also many other options for visualizations.
But we're here for R!
Live code time..
SHOW AT LEAST ONE MORE VIZ HERE.
Playse.
Resources
Udacity EDA course/Data visualization course
R-bloggers - https://www.r-bloggers.com/
R Cookbook - http://www.cookbook-r.com/
Ggplot 2 - http://ggplot2.tidyverse.org/index.html
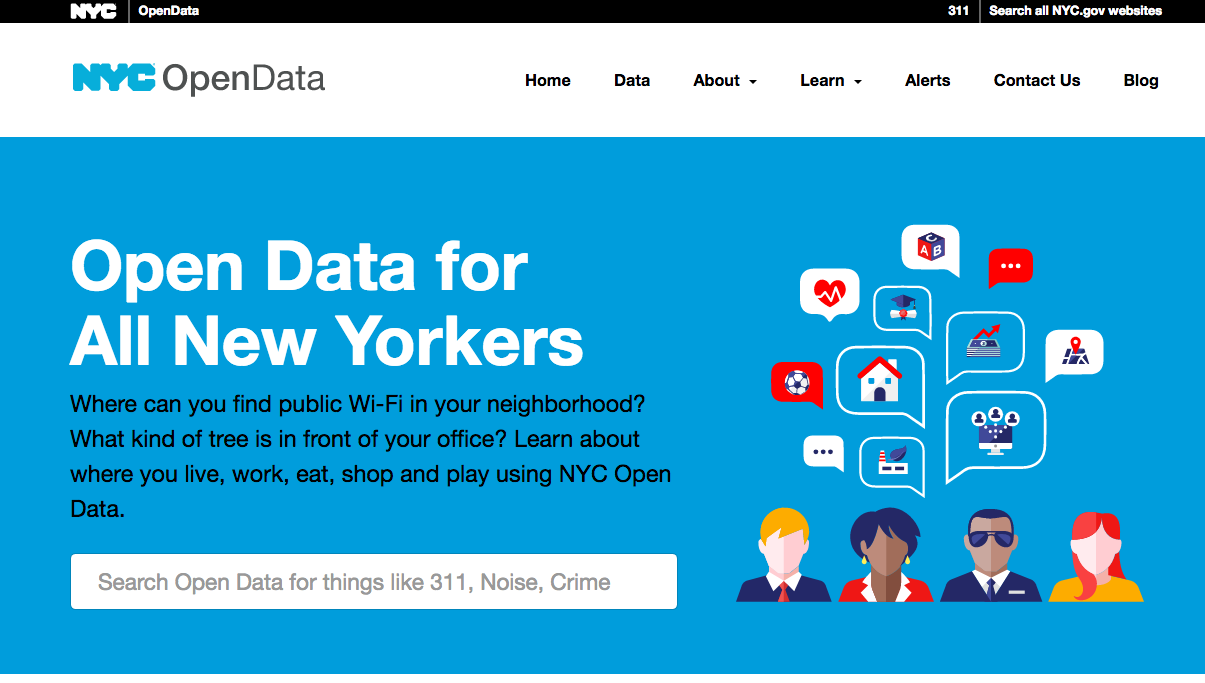
NYC Open Data - https://opendata.cityofnewyork.us/
CHECK OUT MY UPCOMING BLOGPOST!
Thank you!
EDA with R
By mschreiber
EDA with R
EDA with R


