Storytelling with Data
Nadieh Bremer
VisualCinnamon.com
@NadiehBremer
A visualization is worth a million data points
Nobody thinks in words or numbers. We think in images because we are all visual beings
More than 70% of all the sensory receptors in the body are in the eyes
Evolution has transformed our brains to identify patterns

Data is growing bigger
Computers are getting faster
Analyses are becoming more complex
The results from the insights found can no longer be explained with simple charts


Gain Chart
Parallel Coordinates
Heatmap
Streamgraph
When done right
Intuitive to comprehend the whole picture
View both simple and complex data
See abnormalities, dependencies and trends not apparent from tables

January
April
July
October


What are the usual pitfalls?
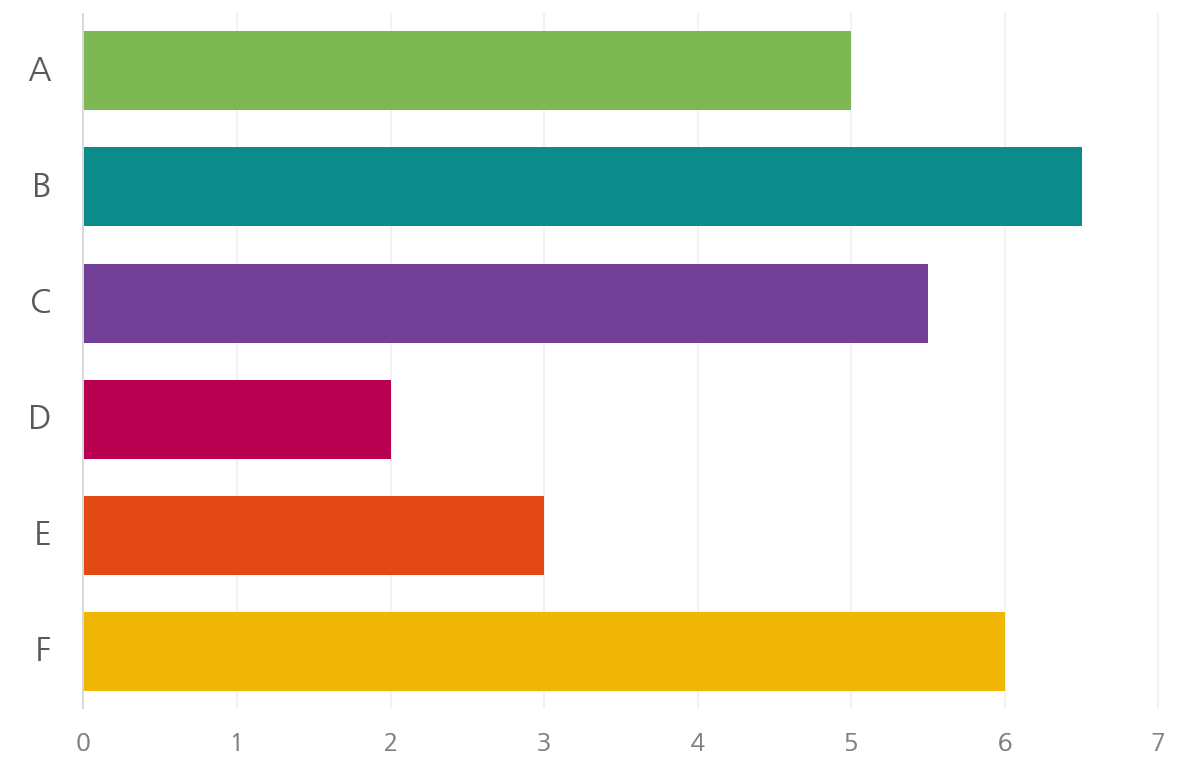
Unclear visual encodings
Too many variables
Too many data points
Too much information at once
What
can we do?
Storytelling
with
In listening to stories we tend to suspend disbelief in order to be entertained
Whereas in evaluating statistics we generally have an opposite inclination to suspend belief in order not to be beguiled
John Allen Paulos
Stories match the way the human brain understands information
You cannot avoid telling stories to yourself


The Sweet Spot

Stories are
| emotional
Stories are
| memorable
Stories are
| impactful
Structuring your
data story
Structure of a Story
Define your audience
Set the scene
Introduce the characters
Create tension
Provide resolution
Define your Audience
Novice
Is new to the subject but doesn't want oversimplification
Manager
Seeks in-depth, actionable understanding of intricacies with access to detail
Expert
Wants more exploration and discovery and less business
Executive
Needs to know the significance and conclusions
Don’t be your own audience
(you already know the story)
Set the Scene
Contextualize by giving the necessary introduction, what will the audience be looking at, before showing any data
Make it clear what to look at, especially where to start looking
Keep in mind that stories have a beginning, middle, and end


Introduce the Characters
Explain gradually what each visual encoding means, e.g.
The essence of a data visualization is converting data into visual elements - bars, lines, points, colors, etc.
Colors
Shapes
Axes
Add meaningful annotation
(don’t just label)
intermezzo


Create Tension
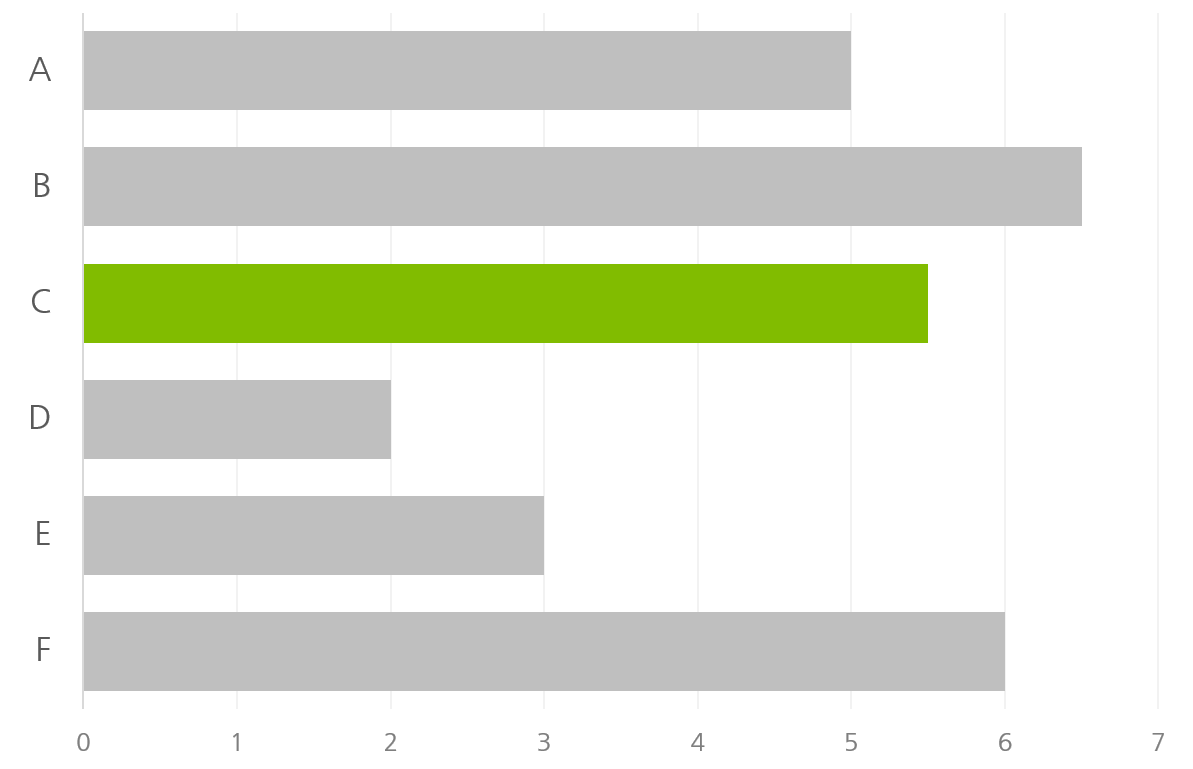
Limit complexity at first by gradually exposing your data
Unfold it, don't dump
Reveal as needed
Start by showing one interesting datapoint or insight and explain this in full detail
Provide Resolution
Inviting readers to draw their own conclusions is risky because even simple data sets can convey different messages
In the end give the audience either
Solid Conclusion
Platform where the audience can explore the data themselves
Wrapping
things up
Why do data stories work?
Unclear visual encodings
Too many data points
Too many variables
Gradual introduction of information
Explicit visual encodings
Gradual introduction of data points
Independent introduction of variables
Storytelling will bring
Engagement
Focus
Memorability
For lasting effect you need to persuade the rational brain
But also resonate with the emotional brain
Data tell Stories
Measles heatmap: http://graphics.wsj.com/infectious-diseases-and-vaccines/
Gain chart: http://sten.tamkivi.com/2013/05/week-37-small-world-churn-measuring-sales-startup-hr/
Streamgraph: http://antheawhittle.com/post/336352214/this-stream-graph-visualisation-shows-your
Parallel Coordinates: http://stackoverflow.com/questions/19213961/parallel-coordinates-program-written-with-processing-cant-show-anything-in-mac
SOM heatmap: http://www.visualcinnamon.com/portfolio/heatmaps
Facebook Tree: http://www.onformative.com/work/4010-facebook-tree/
Flickr Flow: http://hint.fm/projects/flickr/
The color of paintings: http://blog.martinbellander.com/post/115411125748/the-colors-of-paintings-blue-is-the-new-orange
Buildings in the Netherlands: http://code.waag.org/buildings/
Genome similarities: http://www.swissinfographics.com/archives/308
Data Sweetspot: Cannot remember, sorry
Brazil's demographic opportunity: by Alberto Cairo from The Functional Art
Driving shifts into reverse: http://www.nytimes.com/2010/05/02/business/02metrics.html?_r=0
Phone brand Switching: http://www.visualcinnamon.com/portfolio/phone-brand-switching
U.S. Gun Deaths: http://guns.periscopic.com/?year=2013
Apple stock: http://www.nickdiakopoulos.com/2013/09/17/storytelling-with-data-visualization-context-is-king/
Out of Sight, Out of Mind: http://drones.pitchinteractive.com/
Urbanization in East Asia: http://www.visualcinnamon.com/portfolio/urbanization
Brain visualization: http://nxxcxx.github.io/Neural-Network/
General 5 step concept based upon and inspired by Michael Freeman's talk at Strata: http://mfviz.com/strata
Visualization examples:
Slide graveyard


Blue is the new Orange
Pie charts are bad
(there is always a better option)
intermezzo

3D is not effective
(don't assume that just because a program offers a certain chart, that it's a good choice)
intermezzo


Storytelling with Data - Longer
By Nadieh Bremer

