Digdeep | Analytics
Building data driven products using Snowplow Analytics
December, 2015
Today, your product/ customer matrix is overwhelmed with data being made available by all the connected devices out there.

As a data scientist, you are tasked with defining where the growth opportunities are. For the company, the opportunities are real, and they are big. Data is the new currency.

In this talk, I will walk through a use case in monetising your Snowplow data. The focus of this talk is about product development, in building transactional relationships between companies where both sides benefit from new products and services using Snowplow Analytics.


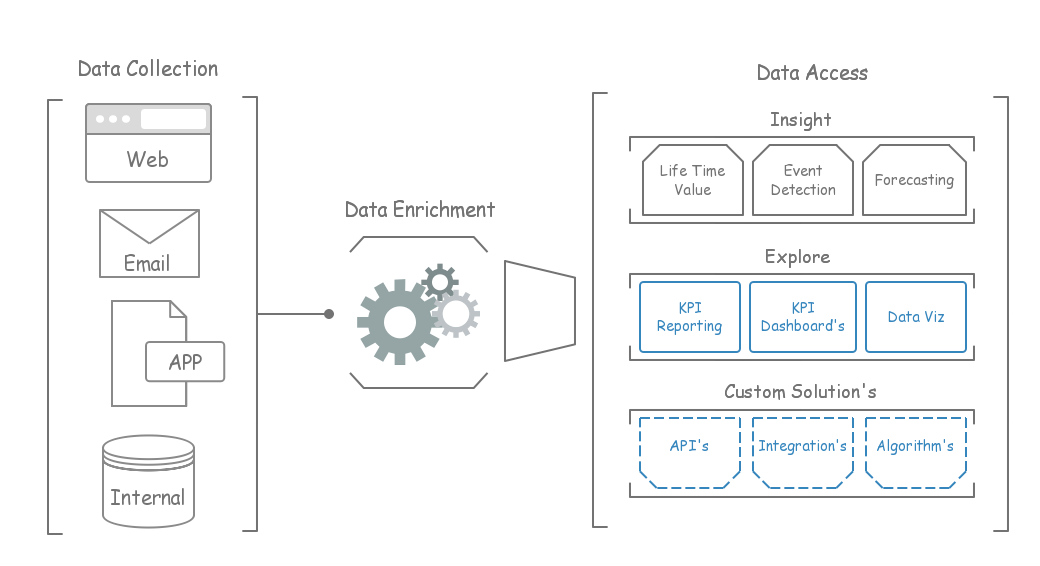
All your Digital analytics data, in the one place.


Customers |
Collect
Enrich
Access


The Growth Opportunity Matrix
Why Snowplow Analytics
A real world example
Agenda
The Growth Opportunity Matrix
Why Snowplow Analytics
A real world example
A Step-by-Step Guide for CMOs and CIOs
As Forrester says, “Customer obsession is easy to talk about but hard to do. It requires remaking your company, systematically, to re-orient each element toward improved customer experience.”
A blueprint for updating product strategy in today’s Age of the Customer, based on four key strategic imperatives:
- Transform the customer experience with a systematic, measurable approach.
- Accelerate your digital business future to deliver greater agility and customer value.
- Embrace the mobile mind shift to serve customers in their moments of need.
- Turn big data into business insights to continuously improve your efforts.
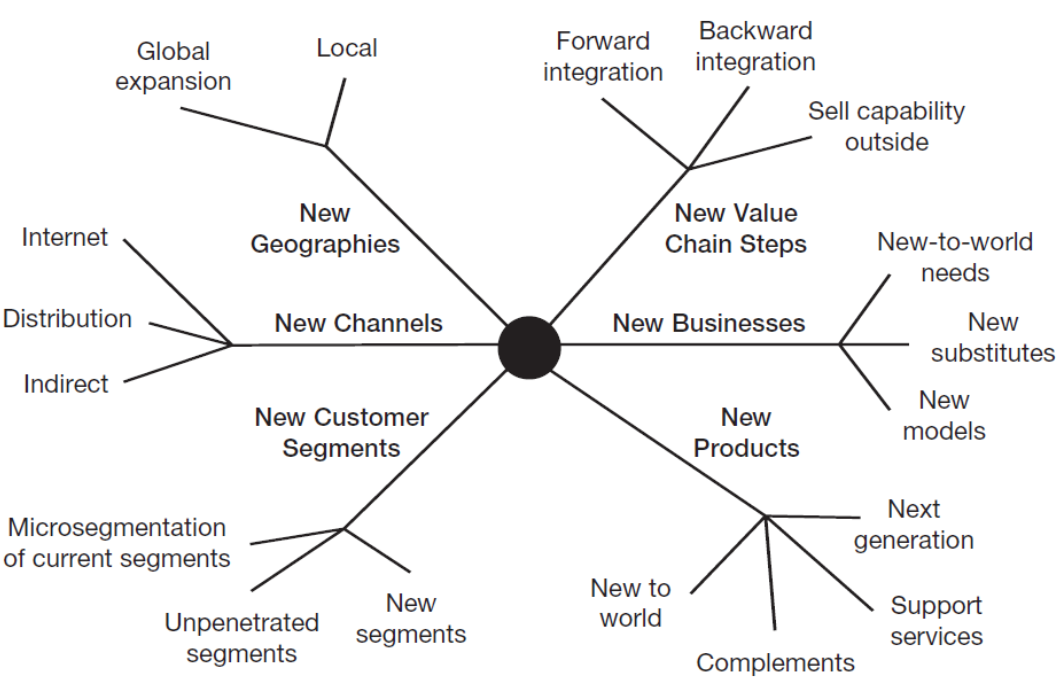
The growth opportunity matrix
5. Pay us lots of money and we will position you in the top right of our magic quadrant
The growth opportunity matrix
Product Development
Customer Penetration
Market Development
Diversification (Venturing)
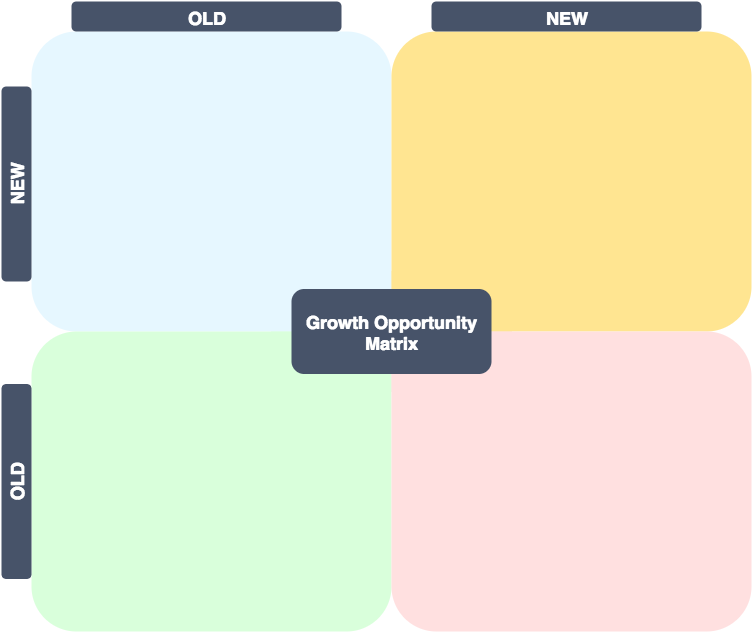


A tried and tested blueprint for updating product strategy in today’s Age of the Customer, based on four key strategic imperatives:
Objective: Distinguish among 4 generic growth strategies by categorizing them along 2 intersecting dimensions based on whether they are “established” or “new” products and markets.
Each of the quadrants has implicit tactical implications, your data strategy should define when/ which quadrant you are in and the what/ how value you are offering.
The growth opportunity matrix
Customer Penetration - OLD / OLD
Increase profitable sales of existing products to customers already being pursued (but not necessarily buying at the current moment).
| TGT Market (Penetration) |
Increase number of user | Diffusion/ Adoption Models |
|---|---|---|
| Current Users (Usage Rate) |
Increase Usage | News uses/ occasions |
| Consumption (Share) |
Increase Share of customer purchases | Higher customer loyalty, Higher Margins |
| Sales | Increase customer lifetime value | BTYD |
Related Frameworks
The growth opportunity matrix
Market development - OLD / new
Increase profitable sales of existing products to groups of customers who are not currently being pursued.
| Geo Expansion | Customer Segmentation | Product Lifecycle |
|---|
Related Frameworks
The growth opportunity matrix
product development - new / old
Sell a wider variety of products to current (existing) customers or upgrade products currently in use.
| OLD | NEW | |
|---|---|---|
| NEW | REACT Follower strategy |
INNOVATION (unrecognised needs, New Tech) |
| OLD | REFINE (incremental improvement) |
REPOSITION/ "PIVOT" (new uses, new contexts) |
Market
Biz
The growth opportunity matrix
diversification - new / old
Risky business. This is hard, let's leave it at that.
</too hard>
The growth opportunity matrix
Does my data support a particular product/ market strategy?, and can my data be the product strategy?
The Growth Opportunity Matrix
Why Snowplow Analytics?
Demo
![]()
Focus on Product
Stay committed to your core product and leave the analytics infrastructure and maintenance to the experts. Snowplow make engineering analytics a non-issue.

Tailored Insights
Accelerating decision lead times with automation, answer the business questions that actually matter with event detection.
![]()
Capture Everything
All your data sits in the one place. Embed analytics anywhere and collect every interaction in batch/ real time using an event driven data model.

Data Products
Profile, classify, score and expose your customer segments back into the application with custom API's. Target opportunities and send data with programmatic solutions and integrations.
An open framework,
flexible and extensible
Why snowplow analytics?
Why snowplow analytics?
![]()
Capture Everything
case study: shifting from a stagnating business model to a growth strategy in the property vertical by using snowplow analytics to drive a “new” product in an existing market.
product development - new / old
Why snowplow analytics?
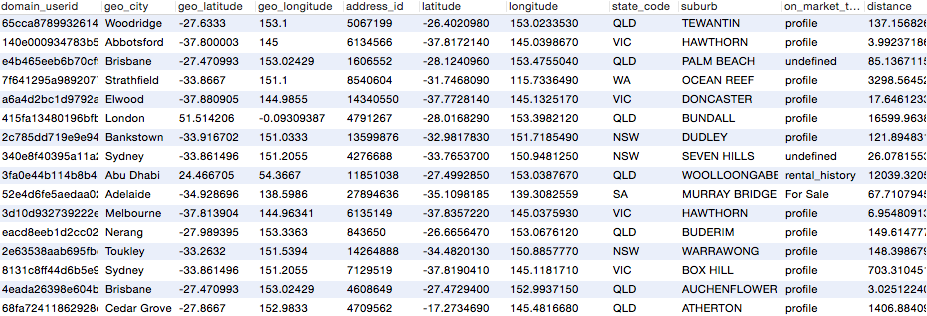
select a.domain_userid, a.event_id, a.geo_city, a.geo_latitude, a.geo_longitude,
b.address_id, b.latitude, b.longitude, b.postcode, b.state_code, b.suburb, b.on_market_type,
2 * 6373 * asin(sqrt((sin(radians((latitude::float - geo_latitude) / 2))) ^ 2 +
	cos(radians(geo_latitude)) * cos(radians(latitude::float)) *
        (sin(radians((longitude::float - geo_longitude) / 2))) ^ 2)) as distance
from (
select distinct domain_userid, event_id, geo_city, geo_latitude, geo_longitude
from a.b
where event = 'page_view' AND geo_city IS NOT NULL AND geo_latitude != -27 AND geo_latitude IS NOT NULL
AND ( br_type = 'Browser' OR br_type = 'Browser (mobile)' )
AND user_ipaddress != 'x.x.x.x'
and exists (
select device_id
from (
select distinct device_id,
count(distinct(domain_userid)) as count
from a.b
group by 1
order by 2 desc
)
where count < 20
)
AND exists (
select event_id
from (
select distinct event_id,
count(event_id) as count
from a.b
group by 1
order by 2 desc
)
where count < 10
)
) a LEFT JOIN (
select distinct root_id, address_id, latitude, longitude, postcode, state_code, suburb, on_market_type
from a.c
WHERE longitude != 'x' AND longitude is not null AND longitude != 'undefined'
) b ON a.event_id = b.root_id
Your data, you own it. Raw access to SQL, scaleable and extensible columnar database.
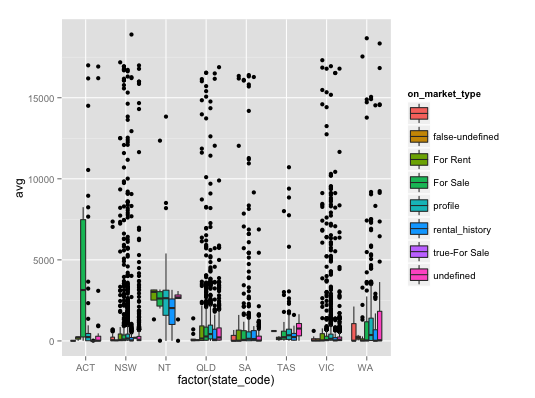
Tailored Insights
Quantile |
0% |
25% |
50% |
75% |
100% |
|---|---|---|---|---|---|
Distance |
6km |
12km |
41km |
672km |
1,889km |
| Users | 12,406 |
12,550 |
12,575 |
6,109 |
6,360 |
Sample == 50K users
Why snowplow analytics?
Tailored Insights
Blending geo centric data streams with 3rd party data sources.
Why snowplow analytics?
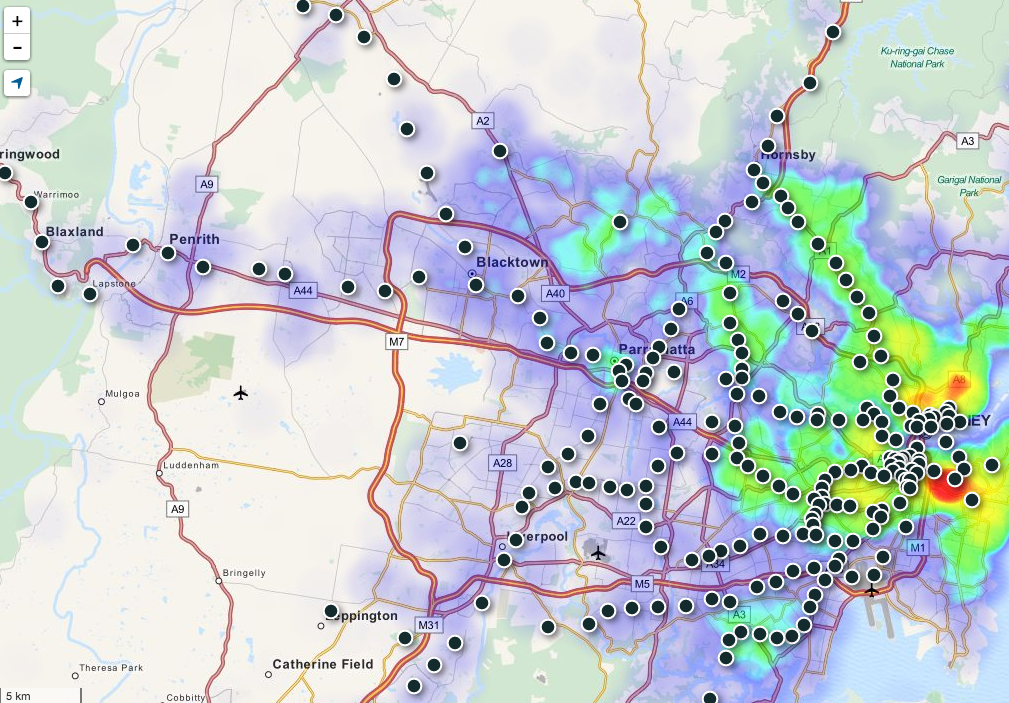
Data Products
Made with
OPEN street maps + leaflet.js + mapbox
Blending geo centric data streams with 3rd party data sources.
Why snowplow analytics?
Data Products
data = [{
              'data': {
                'user': {
                  'UID': ..., 'DID': ..., 'member_id': ..., 'member_type': ...
                },
                'geoLocation': {
                  "city": ...,
                  "continent": ...,
                  "latitude": ...,
                  "longitude": ...,
                  "country": ...,
                  "deviceTimezone": ...,
                  "region": ...
                },
                'Affinity': {
                  "type": ...,
                  ...
                },
                'Distance': {
                  "AVG_distance": ... , "MIN_distance": ... , "MAX_distance": ... ,
                  "STD_distance": ... , "MDN_distance": ...
                },
                'Price': {
                  'Buy': {
                    "AVG_price": ..., "MIN_price": ..., "MAX_price": ..., "STD_price": ..., "MDN_price": ...
                    },
                  'Rent': {
                    ...
                    },
                  'Share': {
                    ...
                    }
                  }}}]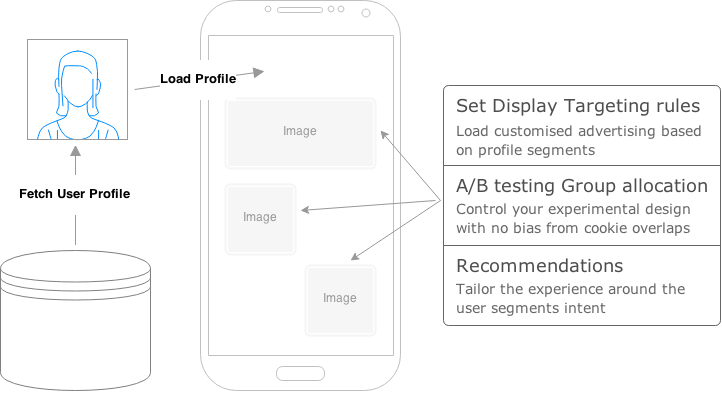
Recommendations, content targeting and experiments - power all your services with an open architecture to build and expose data products through RESTful API's.
Why snowplow analytics?
Data Products
The Growth Opportunity Matrix
Why Snowplow Analytics?
Demo
Building Data Driven Products using Snowplow Analytics
By Narbeh Yousefian
Building Data Driven Products using Snowplow Analytics
Digdeep snowplow Analytics meet up