The DeKalb County Board, the Office of Watershed Management, and UCO/Finance present the following analysis,
current as of December 20th, 2016.
This analysis is focused on providing transparency on the analytical data investigation the county has been conducting since the beginning of October 2016
Navigation is on the bottom right - please click to begin
The below video is a sample of the feedback we've received. Please know that we hear you, and that we have been working, and continue to work, to resolve each and every customer's issue.
Credit: Fox5 Atlanta via Youtube
We're also aware of the number of discussions happening on social media. We've engaged in a number of these conversations, and worked to resolve issues that have come to light through these platforms. We will continue these efforts going forward.
Credit: Unbelievable Dekalb Water Bills via Facebook
We also want to highlight resources to help provide context around our customers' water usage and billing explanation.
Finally, we'd like to provide additional context and statistics on the DeKalb County Water System to help frame the following analysis.
-
Currently, the County’s inventory of manual read, brass small water meters is 112,783
-
61,652 of these meters were installed prior to 2001
-
An additional 52,643 meters were installed between 2001 and 2011
-
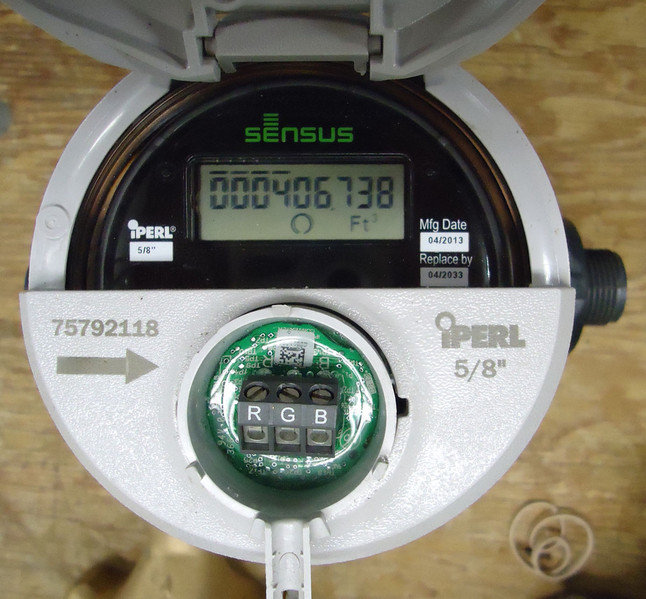
In 2010, DeKalb County entered into a pilot program of the iPERL meters, with a number of goals (accuracy and automation)
-
Currently, there are 71,301 iPERL meters in use
-
This brings the total to 184,080 meters throughout the county
-
The County is beginning to consider using a second type of water meter from AccuSTREAM, evaluation will continue through July 1, 2017
The following analysis walks through some of the findings that resulted from an exploration of the data.
The analysis must be explored in its entirety before the reader draws any conclusions.
Taking any piece of the analysis out of context of the rest, will result in a misinterpretation of the reality.
All visualizations are powered by Tableau Public, and are interactive for your exploration. We welcome your feedback at the conclusion.
Is there a problem?
There certainly is....
We see a period of
dramatically increased
water usage in the
most recent few months
As we look at the water usage by month from
January 2015 to November 2016...
We realize our citizens are seeing this same issue -
So what's going on?
The data shows that something changed
When looking at countywide water usage prior to September 2016, there is some variability (we'll explore this further in a bit), but usage hovers around an average of 1.3 Billion gallons of water per month
By moving this toggle from left...
to right....
Zoomed area
By zooming in, you can better see the variability, but note that there's no overt shifts during the 19 month period
The data shows that something changed
...We begin to see what looks like abnormal usage:
By September 2016, issues were rapidly increasing, on a different magnitude than had been seen before - 22 times higher than the before September 2016 monthly average
October 2016 was the height of the issues that occurred with water billing, on the order of 89 times the before September 2016 average
The issues began to be corrected in November 2016, as the county began to examine the process end to end, though by no means complete
However, you need to know that most issues were never actually billed to the customer...
Here we're showing four different, but significant trends
Monthly volume of meter usage
and
Monthly number of meters read
For bills that were sent to the customer...
...and bills that were not sent to the customer
However, you need to know that most issues were never actually billed to the customer...
Every month about 100,000 meters are read, some of which are determined to be in error, and are not sent to the customer
Normally, it's a very small fraction of the total number of readings (less than 20 most months)
And results in a very small portion of overall usage
However, you need to know that most issues were never actually billed to the customer...
But the last few months have been abnormal, with a dramatic increase in bills that resulted in an "exception" (more on these in a moment), and have not yet been billed to the customer.
In October and November 2016, over 10,000 readings remain unbilled and are in the process of resolution.
These readings that remain unbilled, are the cause of the vast majority (98%+) of the sky rocketing usage shown previously.
However, you need to know that most issues were never actually billed to the customer...
When we look at the data for only what has been billed and sent to the customer, the dramatic increase seems to disappear...
The issue is that only about 85% of the bills for October and November have been sent
Instead, October and November 2016, are below the average (billed + unbilled) month
But citizens still have bad water bills -
Even if the data says that what was billed to the customer in October and November 2016 was within the expectation, we know thousands of citizens have bills in error.
How could this be?
Let's continue....
Issues with the process
Many of the erroneous meter readings covered previously were the results of process issues.
In this next section we're going to walk you through a number of process issues that were identified as a part of our thorough analysis, and then we will show you the impact of what those issues caused.
It is worth noting again, that most of the time these issues never actually reach the customer. However, as the backlog of issues grew in the latter part of 2016, a higher percentage passed through the auditing process and became a bad bill for a customer.
Now that we have identified the process pieces causing the issues in the first place we are implementing changes to dramatically reduce the possibility of these issues happening in the future.
Process Issue #1
Replacing meters without updating the data
One of the biggest issues discovered over the course of our review was the realization that the installation of a new meter was not always done in tandem with an update of the database.
This is an issue for a number of reasons:
- The dial placement of the new meter is going to be drastically different than the old one (remember, water meters have a dial just like the odometer on your car - were you just swap the odometer out on your car for a new one it's very likely to be in a dramatically different place than the old one). a customer's usage is calculated by taking the current reading and subtracting it from the previous
reading. If those two readings happened on two different
meters, problems abound. - Many of the older meters have dials that are measured in
hundreds of gallons. This means that you would have to
multiply both the current reading in the previous reading by
100 in order to get the correct usage. Some of the new
meters are more precise and do not require a multiplier.
therefore,
The Exception Process
We mentioned earlier that the majority of meters in the county are still read manually, about 110,000 of the 180,000 total meters
Either during, or as a result of, the reading, there maybe a noted abnormal circumstance, called an "exception".
61.1%
Exceptions can come both from automatically read meters, and from manual read meters. Logically, the human element introduces a higher percentage of exceptions per meter read, with it being over 3x higher than automatic meters over the last few months.
The Exception Process
Realizing that almost 30% of manual meter readings come back with an exception, let's take a closer look.
For the moment, we'll only focus on the manually read meters, noting some of the common problems that can result.
The Exception Process -
DeKalb Water Analysis
By Nelson Davis


