Improving Efficiency in Transportation Networks using Python
Into The Logisticverse:
Presented by
Uzoma Nicholas Muoh

About Me


Your friendly neighborhood data nerd

$1.26T
Contribution by the Transportation industry to USA GDP as of 2022
$875.5B
Annual revenue of the U.S. Trucking Industry in 2021
Substantial Impact...
72.5%
Market share of freight moved in the U.S by trucks.
10.9B tonnes
Total weight of freight transported by trucks in 2021
Trucking Industry

Over-the-road Trucking
A type of trucking where drivers transport goods over long distances, such as interstate or international routes.


At the 🫀 of the Problem
Carriers
These are the companies that pickup freight from a location and delivers it to the destination.
-
More customers and more orders
-
Fewer empty miles
-
Keep existing drivers and hire new ones
What Do They Care About?
i.e J.B. Hunt, Landstar
Shippers
These are companies that need their frieght moved.
-
Availability of trucks and drivers
-
Cheaper rates
What Do They Care About?
i.e P&G, Nestlé
Drivers
These are either owner-operators meaning they own or lease their own truck or they are employed by a carrier or broker.
-
Pay
-
Time
-
Being Safe
What Do They Care About?
The Carrier Network

Graph Analytics
A type of data analysis that focuses on studying the relationships between different entities which could be products, customers or even devices.
Graph Analytics

Undirected
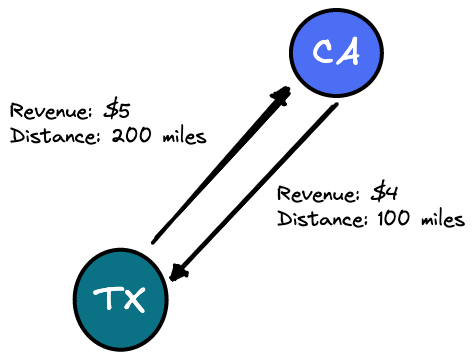
Directed
Nodes
Edge
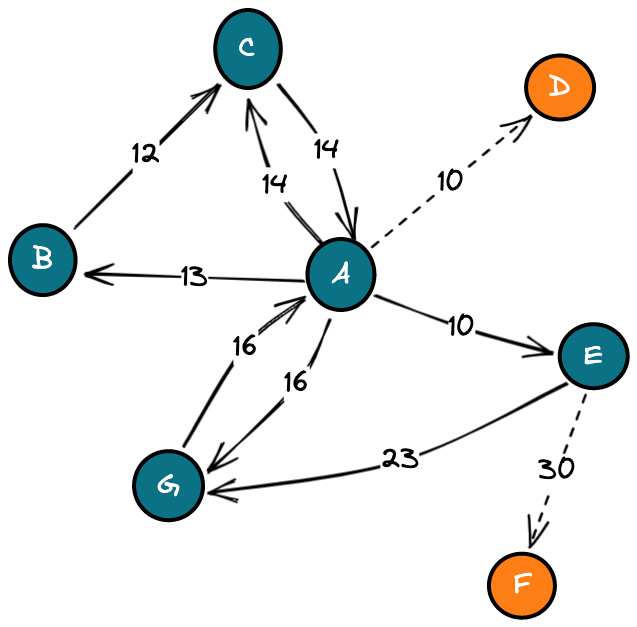
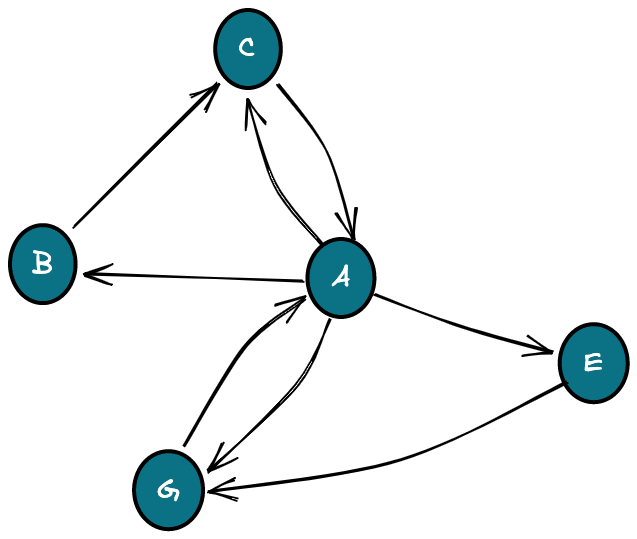
from io import StringIO
import pandas as pd
import networkx as nx

freight_activity = """
pickup,delivery,cost
A,B,13
A,C,14
A,D,10
A,E,10
A,G,16
B,C,12
C,A,14
E,F,30
E,G,23
G,A,16
"""

graph_df = pd.read_csv(StringIO(freight_activity))

graph = nx.from_pandas_edgelist(
    df=graph_df,
    source="pickup",
    target="delivery",
    edge_attr=["cost"],
    create_using=nx.DiGraph,
)

nx.draw(graph, with_labels=True)
Graph Analytics
pip install networkxImproving Connectivity
...
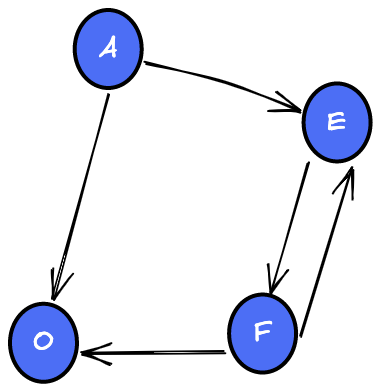
for node in graph.nodes:
if graph.out_degree(node) == 0:
print(f"Leaf Node: {node}")Improving Connectivity
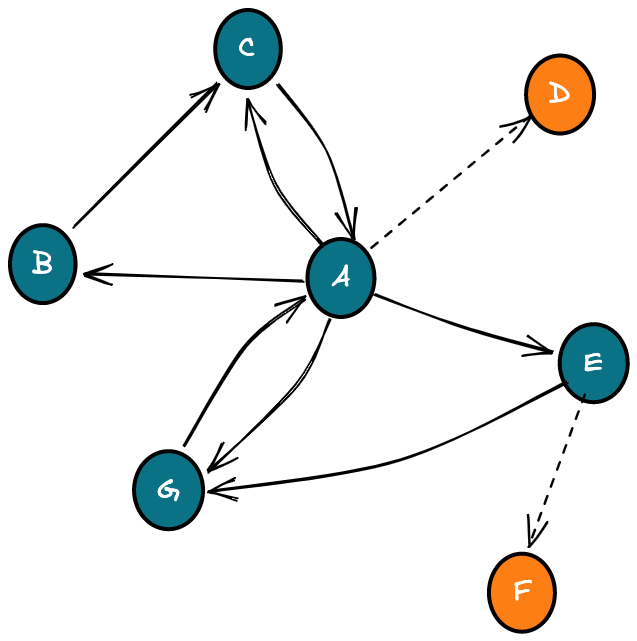
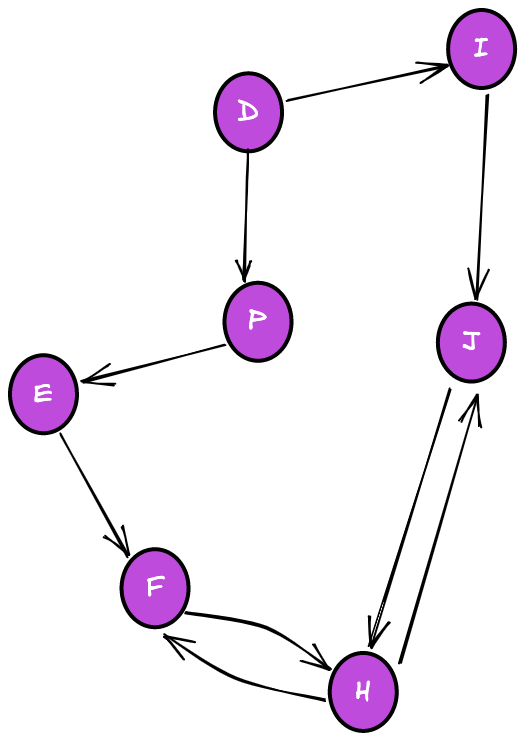
\alpha = \frac{e-v}{\frac{v(v-1)}{2} - (v-1) }
\beta = \frac{e}{v}
1.43
0.2
1.6
0.6
Collaborative Decision Making
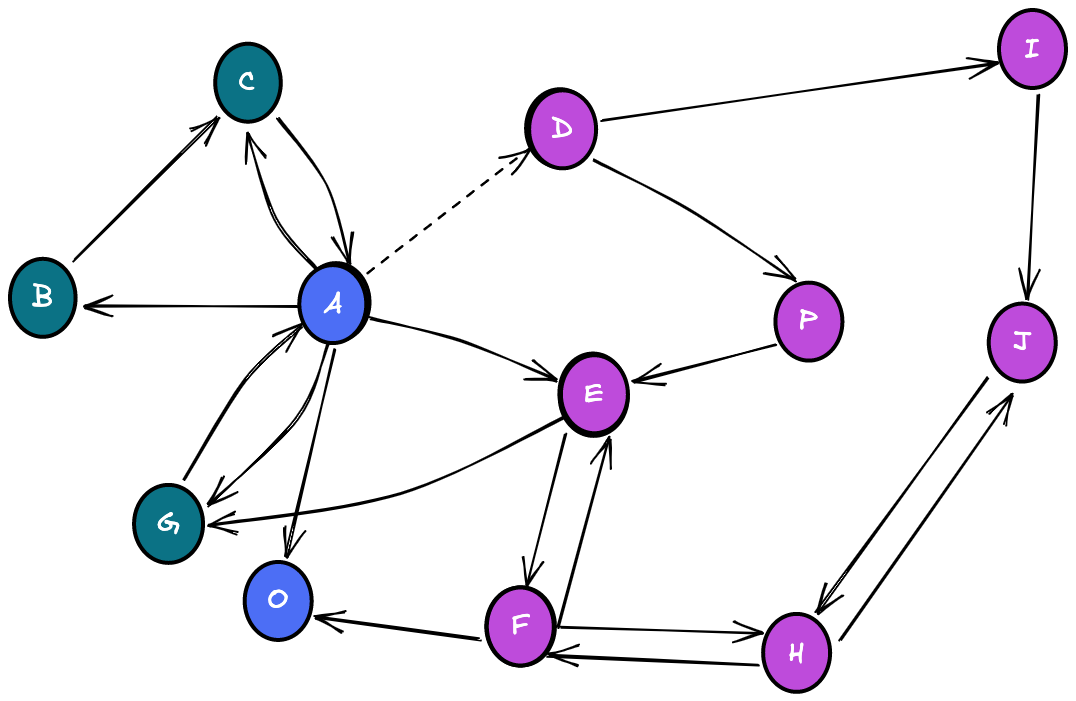
Graphs for the Win 🤘🏾

Graphs
Analytics
Finding The Right Order


Shippers
Carriers
The Challenges
Shippers
Carrier
Factors, Components & Ratings

Components

Factors

Rating
Factors & Components
- Financial
- Order Throughput
- Shipper Payment Turnaround
- Order Attribute
- Equipment Type
Rating Mechanism

Is this a good order for us?
It is mostly good.
Fuzzy Logic

pip install scikit-fuzzy
Fuzzy Logic
import numpy as np
import skfuzzy as fuzz
from skfuzzy import control as ctrl

# Input Variables
order_input = ctrl.Antecedent(
    "order_throughput",
    np.arange(0, 3500, 150),
)
pay_input = ctrl.Antecedent(
    "pay_turnaround",
    np.arange(-365, 60, 1),
)
# Output Variable
fin_ouput = ctrl.Consequent(
    "financial",
    np.arange(0, 100, 10),
)
# Defining triangular membership functions
order_input["poor"] = fuzz.trimf(order_input.universe, [0, 0, 1750])
order_input["average"] = fuzz.trimf(order_input.universe, [1200, 1750, 2250])
order_input["good"] = fuzz.trimf(order_input.universe, [1750, 3500, 3500])
pay_input["poor"] = fuzz.trimf(pay_input.universe, [-365, -365, -120])
pay_input["average"] = fuzz.trimf(pay_input.universe, [-120, -30, -10])
pay_input["good"] = fuzz.trimf(pay_input.universe, [-30, 0, 60])
fin_ouput["poor"] = fuzz.trimf(fin_ouput.universe, [0, 0, 50])
fin_ouput["average"] = fuzz.trimf(fin_ouput.universe, [0, 50, 100])
fin_ouput["good"] = fuzz.trimf(fin_ouput.universe, [50, 100, 100])# Create Rules
rule1 = ctrl.Rule(
order_input["poor"] | pay_input["poor"],
fin_ouput["poor"],
)
rule2 = ctrl.Rule(
order_input["average"] | pay_input["average"],
fin_ouput["average"],
)
rule3 = ctrl.Rule(
order_input["good"] | pay_input["good"],
fin_ouput["good"],
)# Create Fuzzy Logic System
fin_ctrl = ctrl.ControlSystem([rule1, rule2, rule3])
financials = ctrl.ControlSystemSimulation(fin_ctrl)
financials.compute()
financials.input["order_throughput"] = 2600.94
financials.input["pay_turnaround"] = 10
print(financials.output["financial"]) # 76.67
fin_ouput.view(sim=financials) # good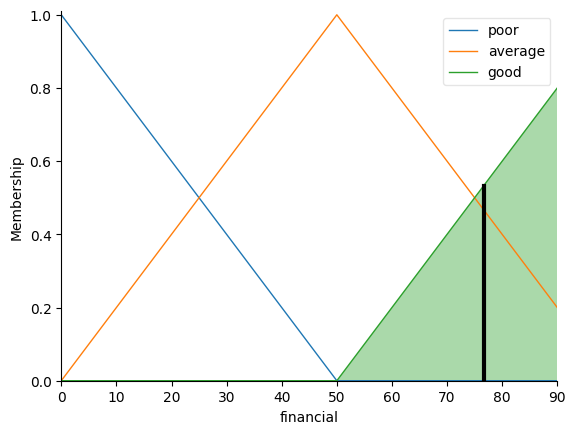
👍🏾 good
Making Decisions Easier


Accept
Reject
Fuzzy Logic


Accept
Reject
Give Up
Matching Powers to Loads


Power
Loads
Drivers
&
Truck

?
Fleet Dispatcher
What Is a Good Match?

Combinatorial Assignment Problem

Tasks, Jobs, Facilities, Drivers etc
Workers, Processors, Locations, Loads etc
Cost Matrix

Cost Function
import numpy as np

def calculate_cost(power, load):
    cost = (
        w1 * hours_of_service_match(power, load)
        + w2 * route_distance_match(power, load)
        + w3 * driver_preference_match(power, load)
        + ...
        + wx * some_other_criteria(driver, load)
    )

    return cost

cost_matrix = np.empty((2, 2))

for i, p in enumerate(powers):
    for j, l in enumerate(loads):
        cost_matrix[i][j] = calculate_cost(p, l)
Mathematically...
C_{i,j} = \sum_{i=1}^{m} \sum_{j=1}^{n} \sum_{k=1}^{N} w_k * m_{k,i,j}
Minimizing The Cost Matrix
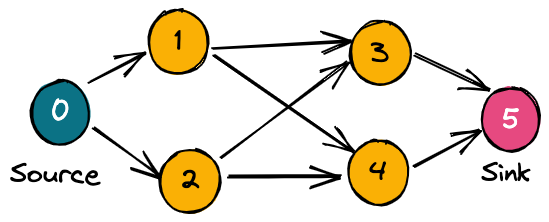

Google OR Tools
pip install ortoolsMinimizing The Cost Matrix
# Instantiate a SimpleMinCostFlow solver.
smcf = min_cost_flow.SimpleMinCostFlow()

# Add each arc with their respective cost.
for i in range(len(start_nodes)):
    smcf.add_arc_with_capacity_and_unit_cost(
        start_nodes[i],
        end_nodes[i],
        capacities[i],
        costs[i],
    )

# Add node supplies.
for i in range(len(supplies)):
    smcf.set_node_supply(i, supplies[i])

# Find the minimum cost flow between
# node 0 and node 5.
solve_status = smcf.solve()
import numpy as np
from itertools import product
from ortools.graph.python import min_cost_flow
# if ortools==9.3.10497
# from ortools.graph.pywrapgraph import SimpleMinCostFlow
NUM_POWERS = 2
NUM_LOADS = 2
TOTAL_ASSIGNMENTS = NUM_POWERS + NUM_LOADS
start_nodes = [0] * NUM_POWERS
end_nodes = list(range(1, NUM_POWERS + 1))
edge_cost = []
for i, j in product(range(NUM_POWERS), range(NUM_LOADS)):
cost = cost_matrix[i][j]
edge_cost.append(cost)
start_nodes.append(i + 1)
end_nodes.append(j + NUM_POWERS + 1)
costs = [0] * NUM_POWERS + edge_cost + [0] * NUM_POWERS
start_nodes += list(range(NUM_POWERS + 1, TOTAL_ASSIGNMENTS + 1))
end_nodes += [TOTAL_ASSIGNMENTS + 1] * NUM_LOADS
capacities = [1] * len(start_nodes)
supplies = (
[NUM_POWERS]
+ [0] * TOTAL_ASSIGNMENTS
+ [-NUM_POWERS]
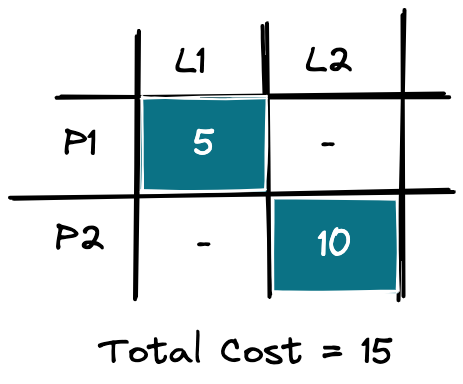
)Et Voilà, We have Matches
Take aways 🥡
- There is a significant complexity in the problems the trucking industry deals with, things are not as simple.
- Formulating the problem and getting the data to solve it is just half the battle.
- Improving efficiency in transportation can look very different depending on the business needs.
Using Python's rich scientific ecosystem of libraries, we looked at:
- Graph Analytics with
networkx - Finding the right order with
skfuzzy - Assignment Problem with google's
ortools

Questions & Resources
Fosstodon: @nicksspirit

Twitter: @nicksspirit

Code Example:
Assignment Problem
Transportation Network
Into the Logisticverse: Improving Efficiency in Transportation Networks using Python
By Nick Muoh
Into the Logisticverse: Improving Efficiency in Transportation Networks using Python
When we think about what Python is for, we often think of things like analytics, machine learning, and web apps but python is a workhorse that plays a tremendous and often invisible role in our day-to-day lives, from medicine to finance, and even the transportation of goods from manufacturers to the shelves of our neighborhood stores. Transportation networks are highly dynamic, goods are always moving from point A to point B and money every minute is being gained or lost. Improving efficiency in a transportation network is critical to the survival of a business that provides transportation and distribution services as well as ensuring timely delivery of goods to customers. This talk examines 3 real-world examples of how Python is used to improve the efficiency of transportation networks, particularly we will explore: * Finding the optimal match between a driver and a load at the lowest possible cost using google's `ortools`. * Generating recommendations for macro level optimizations to a transportation network using `networkX`. * Helping the descision making process by answering the question "Should I accept this work?" using `skfuzzy`. Key Takeaways: * Graph analytics and data science concepts that facilitate getting goods from manufacturers to stores more efficiently and at a lower cost to businesses. * An appreciation of the complexity of the logistics industry and the