The current state of speckle imaging
Nic Scott
NASA ARC
-
brief history and introduction
-
milestones
-
technology
-
-
publications
-
instrument programs
-
science programs & recent highlights
-
future
The Rayleigh criterion and the tyranny of the atmosphere
\Theta = 1.22 \lambda/d
\approx \lambda / r_0
but in atmosphere, turbulent cells limit resolution to
Fizeau & Michelson
Brown & Twiss
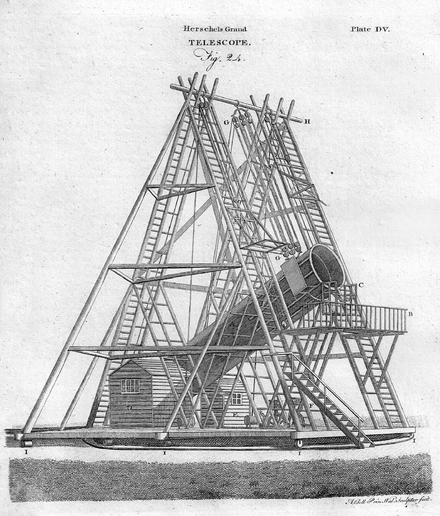
1850s
1890s
1920 - measured Betelgeuse (with Pease)
1956 - HBT effect, correlation b/t coherent photons
detail lost to the atmosphere can be regained through interferometric analysis
Intensity interferometry
Labeyrie
1970
Text
a method to obtain diffraction-limited resolution across the full aperture of a large telescope
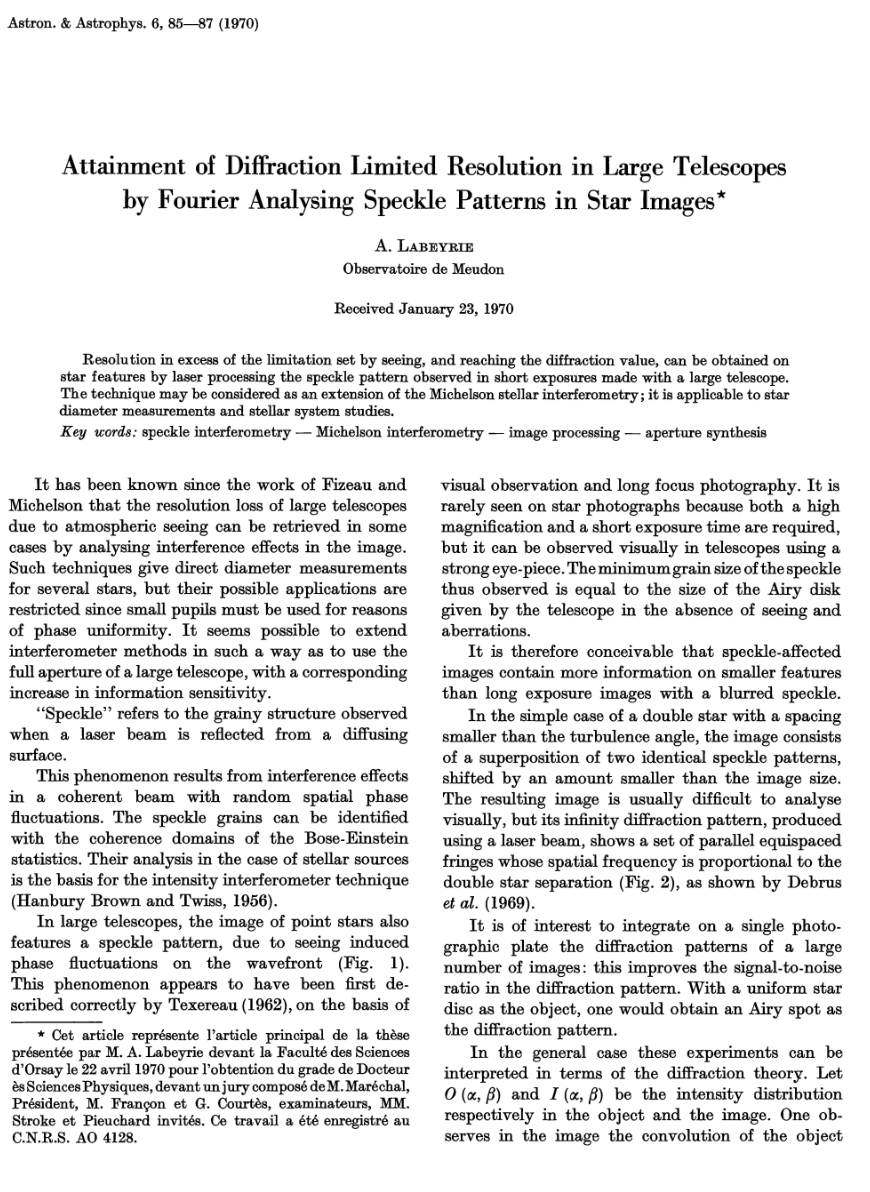
long exposure
speckles blur
produce Airy pattern
true images are impossible, only centrosymmetric objects can be reconstructed
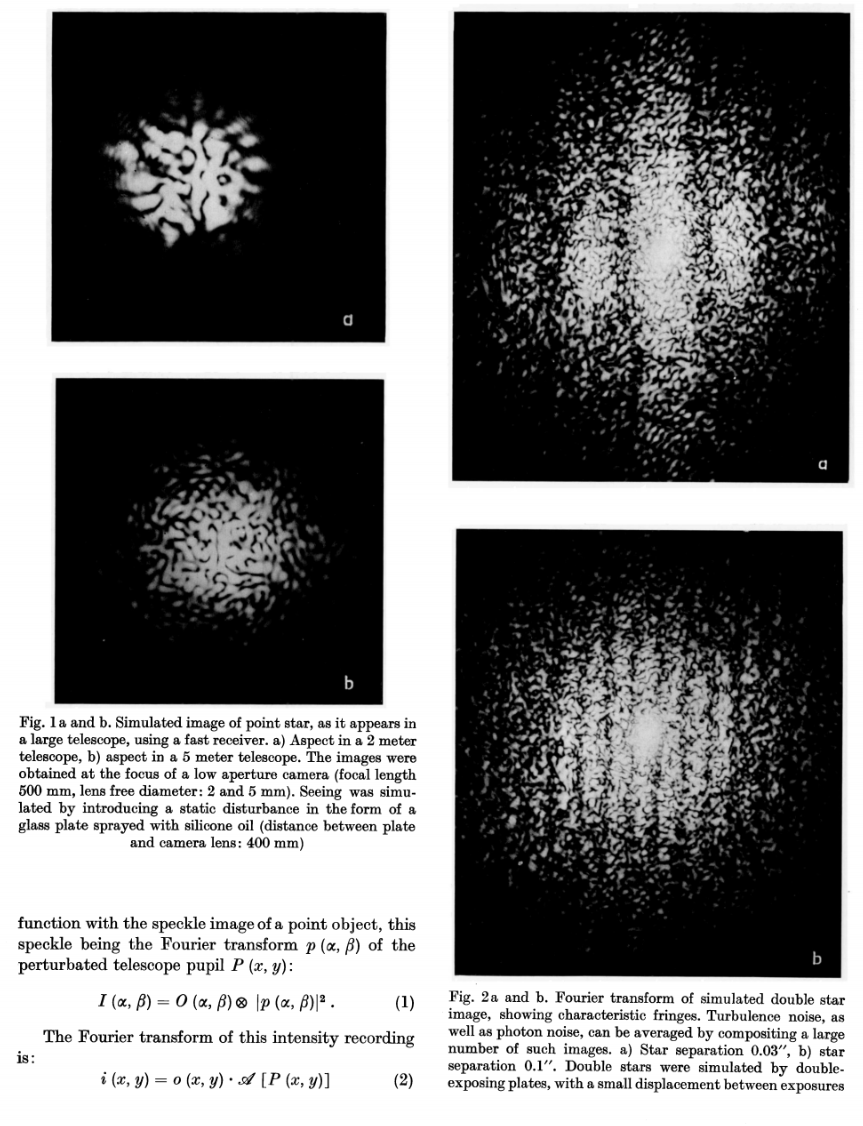
speckle pattern is the Fourier transform of telescope pupil
autocorrelation of speckles
(in Fourier space)
modulus
(time-averaged intensity)
Knox & Thompson
cross-spectrum, a 2nd order correlation
1974
non-symmetric input
long exposure avg
Labeyrie technique
Knox & Thompson method
mean square of the image transform
modulus of the object transform
autocorrelation of the image transform
phase of the object transform
diffraction-limited image of the object
unambiguous reconstruction of arbitrary shapes but has ambiguity
+
180\degree
In 1980’s bispectral analysis was found to have higher S/N and be less susceptible to systematic error.
Weigelt & Lohmann
1977-1983
double star simulation
bispectrum modulus
triple correlation
record PSF of object
produce synthetic reference star by shifting the speckle pattern
phase is preserved
Speckle masking/triple correlation theory/bispectral analysis, a 3rd order correlation
deconvolve
true images

An aside on Lucky Imaging
- reaches higher resolution than typical seeing
- does not utilize Fourier analysis
- not capable of reaching the diffraction limit
- requires a very large number of images

http://inspirehep.net/record/823349/plots
Fried
1978
record a large series of images
discard instances of poor resolution
combine the remainder through shift-and-add techniques
Can reach
Changes in technology
ICCDs


EMCCDs
- CCD + image intensifier tube
- tube gating and amplification
- up to 500kHz
- lower resolution and low QE
- interline detector 50% QE
- CCD + series of HV gain registers
- + photoelectric events w/ each register
- greatly amplified signal w/ single readout of the array
- 2008: Tokovinin published the first speckle imaging results
- frame transfer, QE > 90%, low readout noise
- higher S/N than ICCDs
- 10-100 times faster than a CCD

- active pixel sensor: amplification and conversion happens directly on each pixel
- cheap, less power and lower gain needed
- higher S/N,
- fast readout
- no clocking the charge across the array
- further on-chip processing can be added
CMOS (complementary metal–oxide–semiconductor)
EMCMOS
- each pixel has a series of HV registers
- + photoelectric events w/ each register


2015: first EMCMOS results reported by Brugière
Publications
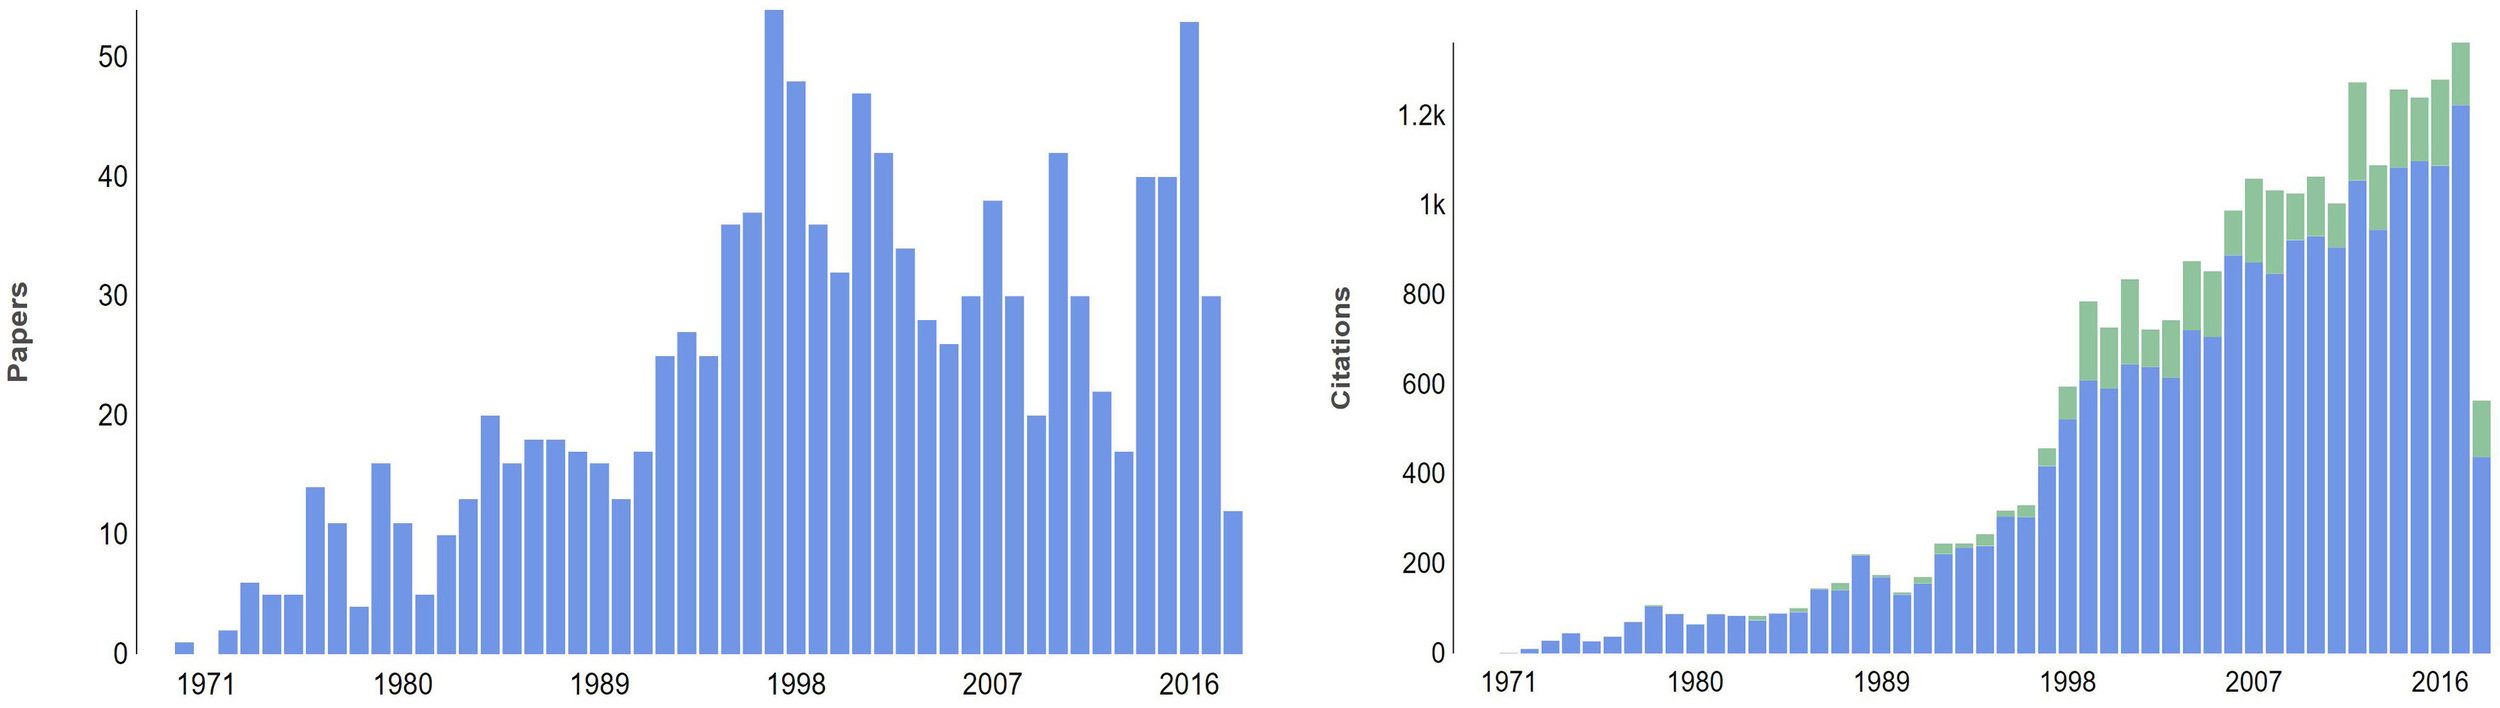
Text
blue bars are refereed citations to refereed papers
green bars are non-refereed citations to refereed papers
SAO/NASA ADS “Bumblebee” search: ‘‘speckle’’ - ‘‘speckle noise’’
- limited to astronomy and refereed
- removed AO speckle noise references
- excluded AO and spectroscopic techniques
- constrained to 1970+ sorted by citation count
This search returned 1,139 papers with 24,181 total citations
release of EMCCDs
& start of large speckle survey programs.
Instrument Programs -
- often non-hierarchical or bottom-up
- if successful, use may spread to the broader community
- many for a specific use and have a finite lifespan
- limitations of the technology or availability of people
- many have quiescent phases
- information is limited to what is publicly available (update your websites)
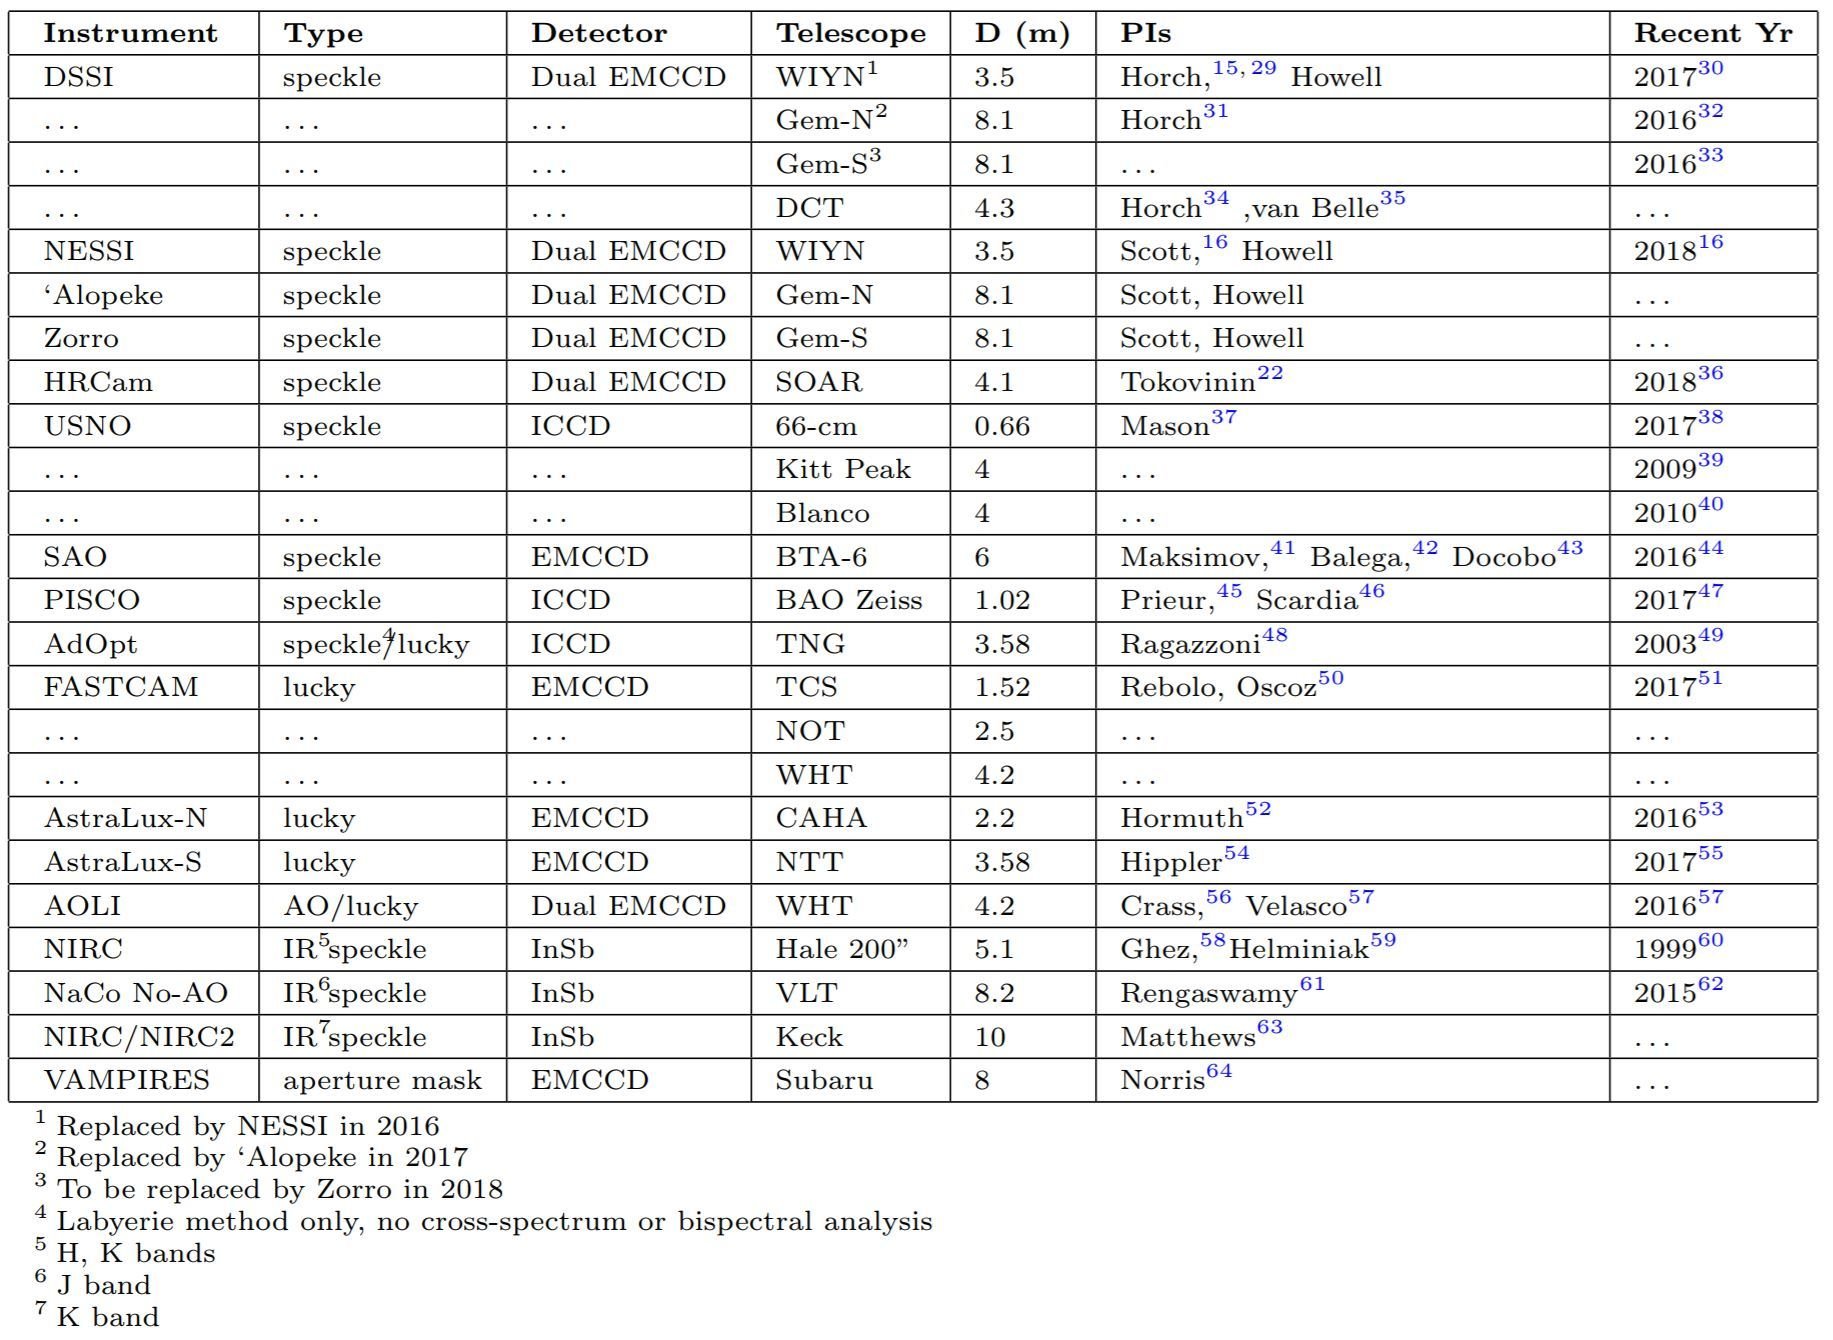
The following table lists current or recently active major optical speckle imaging programs along with a few IR speckle and lucky imaging instruments and selected other high-resolution programs.
Disclaimer
Title Text
Text

|
Source: Wikimedia
|
|


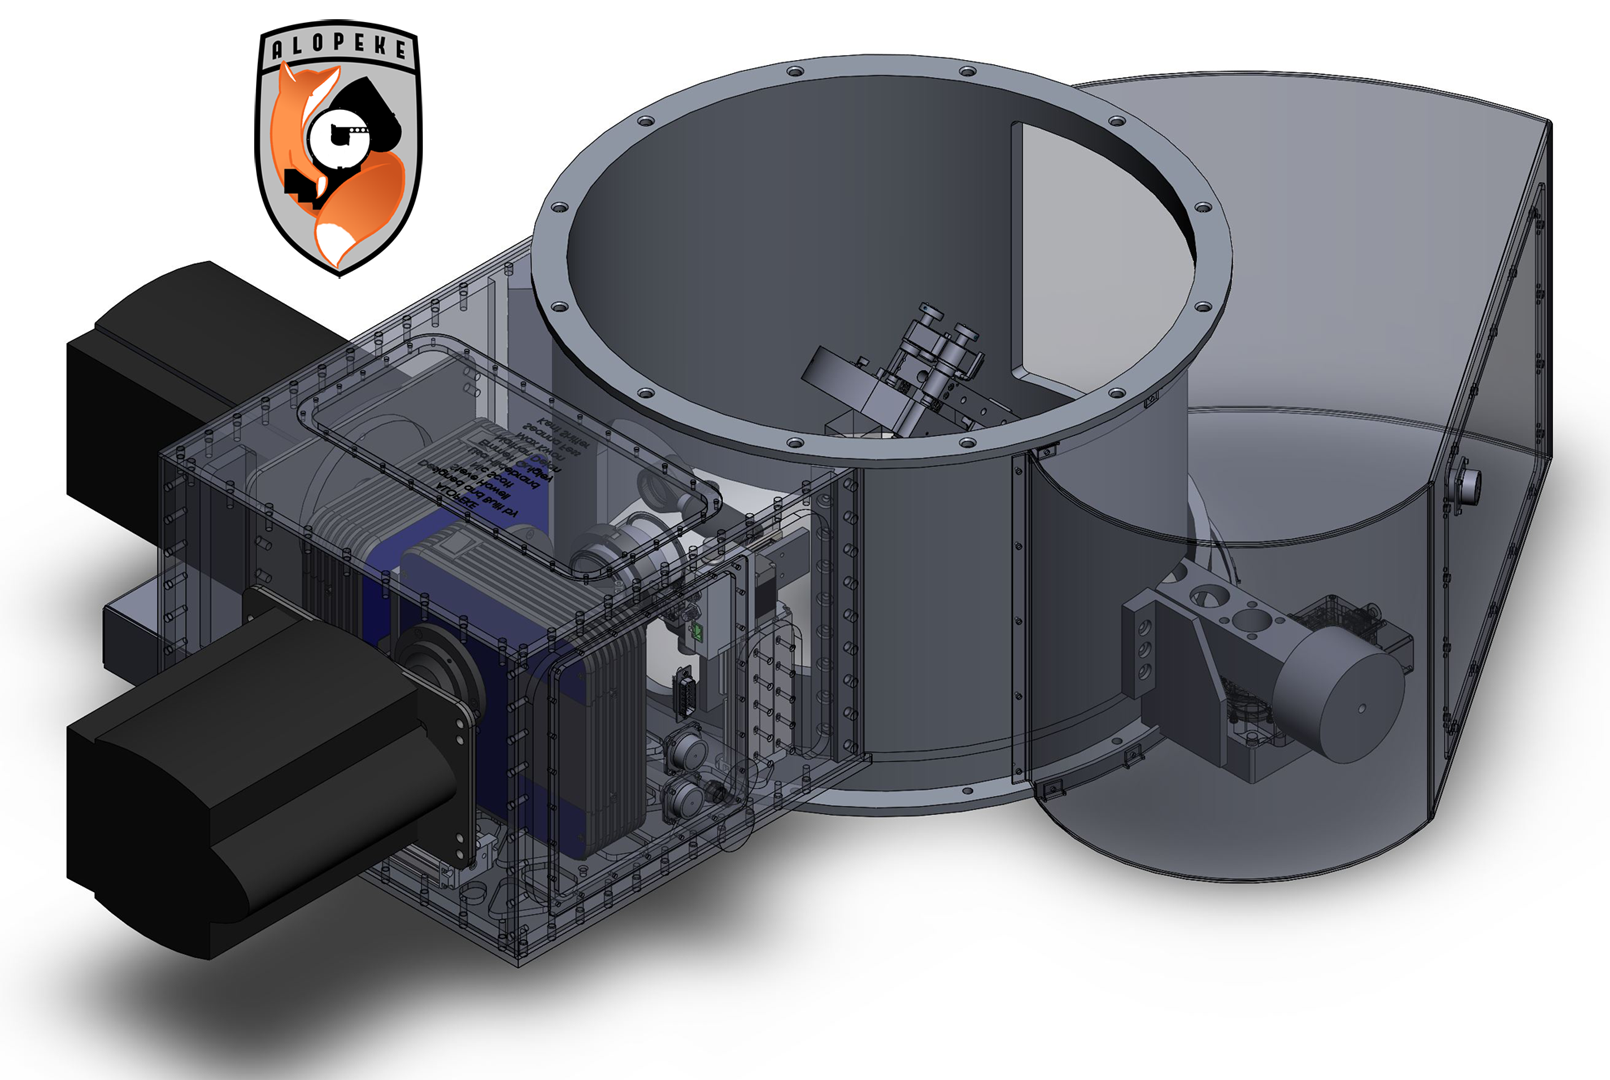
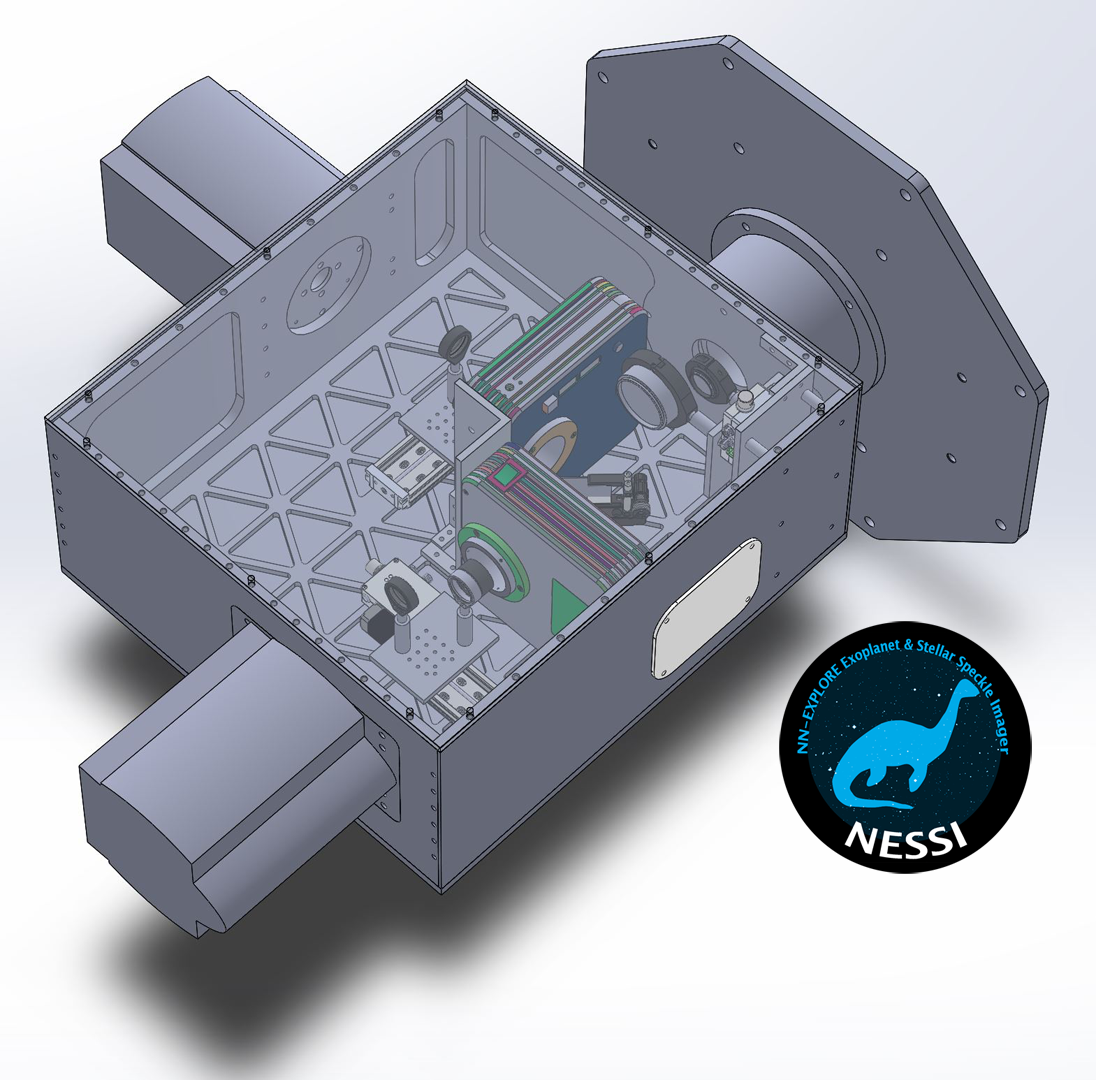
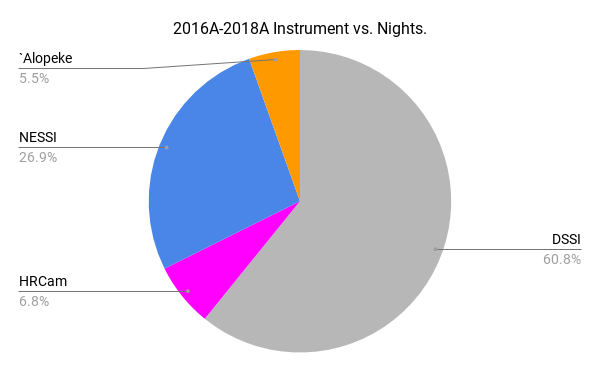
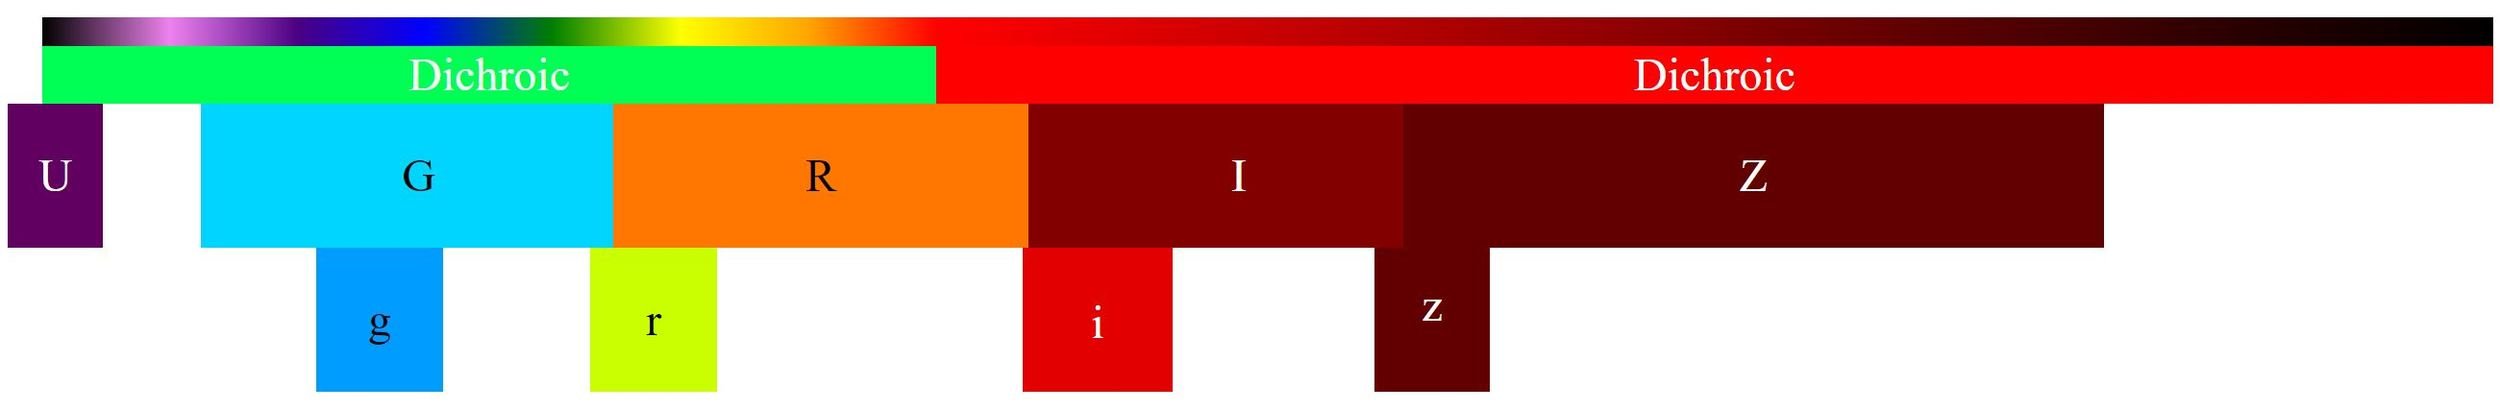
DSSI/NESSI/`Alopeke/Zorro


Speckle
- 10mas/pxl
- mag limit ~17
- contrast limit ~8
Wide Field
- 73mas/pxl
Speckle
- 18mas/pxl
- mag limit ~14
- contrast limit ~6
Wide Field
- 81mas/pxl


0.011'' @u
0.026'' @832nm
0.025'' @u
0.060'' @832nm
6.7''
60''
19''
56''

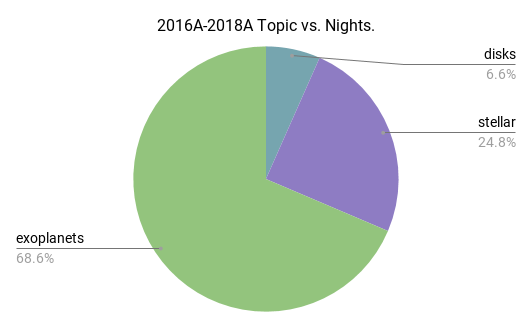
Science Programs
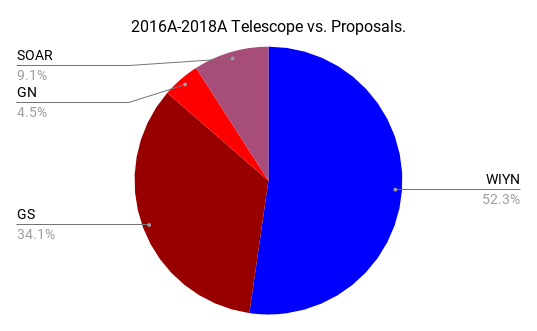
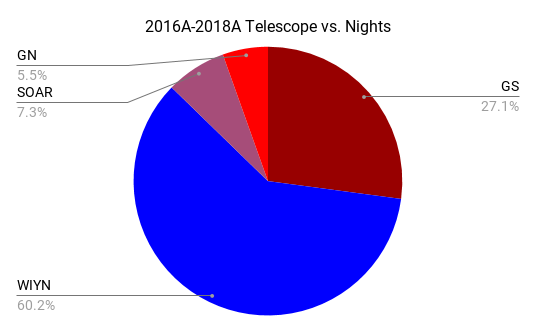
40 total proposals
110.04 total nights
(NOAO 2016A to 2018B)
- Constrain NEA diameters. Image SS objects
- Determine multiplicity of nearby K and M-dwarfs, does it vary across spectral type?
- Imaging of brown dwarfs and distant large planets, particularly around M dwarfs
- Investigate differences in planetary system architectures between multiple vs not (known) multiple host stars
- Examine long-term RV trends/determine binarity of RV planet hosts.
- K2, TESS follow-up
- Provide an unbiased sample for TESS, so statistical determinations of planet occurrence rates can be made
- Occultations, transit photometry, pulsar time scales, observe pulsating WDs at high cadence
Some proposals so far:
Recent Science Results

- optical, NIR imaging of host stars of KOIs
- ~ 90% of the confirmed and candidate exoplanet hosts
-
separations, PA, and dm for all detected, bound and
LoS companion stars. - 2297 companions around 1903 primary stars ~ 10% of the observed stars 1+ companions detected w/
i 1” - correction factors for exoplanet radii caused by the dilution of the transit depth
decreases the number of KOI planets with radii smaller than 2 Earth radii by 2% - 23%

Furlan's previous results applied to planets w/ known masses & radii, analyze the effects of a close stellar companion on planetary density.
- 50 planets orbiting 26 stars in the Kepler field
- a transit dilution requires the planet radii to be revised upward, decreasing the density of the planet
- if
planet orbits a faint companion star,density may decrease by ~ 3x
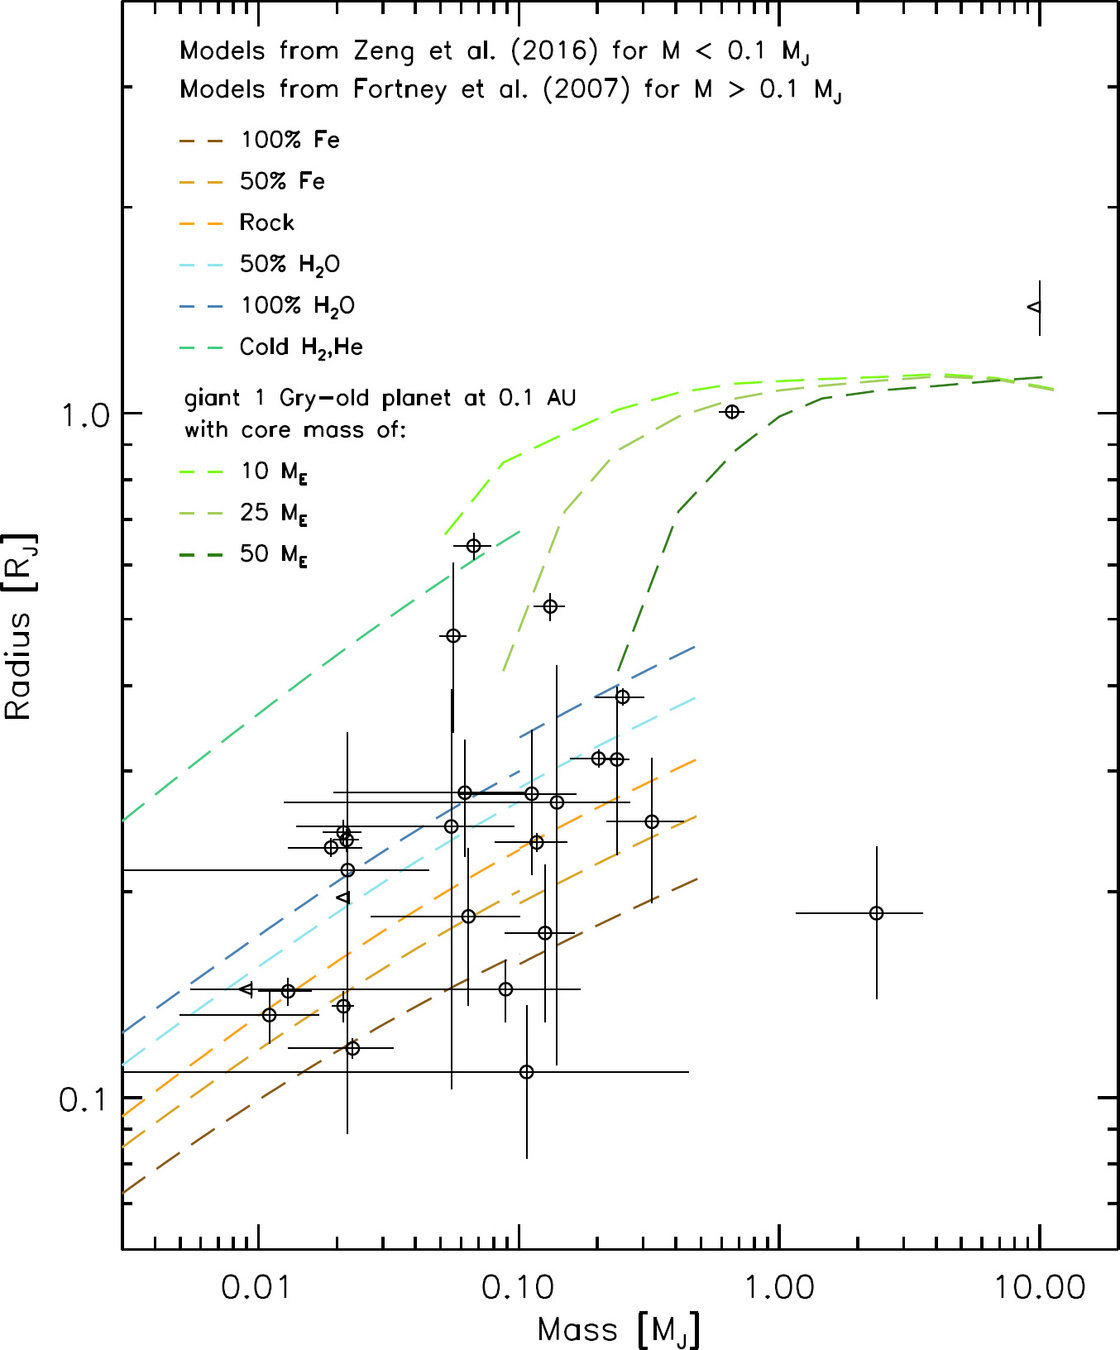


The effect of close ~ 0.5” companions of Kepler and K2 planet candidate hosts had on the inferred exoplanet radius distribution.
- Fulton gap is robust regarding undetected stellar companions
- gap became broader & shallower when accounting for possible undetected stellar companions
- core composition of super-Earth and sub-Neptune exoplanets may not have so strong a divide as is suggested initially
- w/o high-resolution imaging of Kepler and TESS host stars, the exoplanet radius distribution will be incorrectly inferred.
(2018, in press)

Fulton
mini-neptunes
super-Earths
- Large radius errors originally hid distribution features
- Fulton gap revealed after CKS (10% stellar radius errors)
- Accounting for binarity shifts gap in the distribution

brightest companion 1''
brightest companion 2''
Shift from 1.8 to 2.2
- increased water/ice vs pure Si rock
R_E

- 170 KOI companions < 2” using AO, speckle, lucky, or the HST
- constrained their stellar properties and assessed the probability that the companions are physically bound
- 60 - 80% of companions < 1” & > 90% of companions < 0.5” were found to be bound
- assuming the planet is equally likely to be orbiting the primary or
secondary, unless they are vetted, nearly half of all Kepler planets may have radii underestimated by an average of 65%.


- DSSI @ G-S
- highest-resolution images to date
- 27 mas
- imaging from 0.32 to 14.5
au - excludes all possible stellar and brown dwarf companions


Future
- Quad-channel
- Wave-front sensing
- Possible near-IR channel?
- DSSI heritage at the DCT+NPOI
- novel construction
QWSSI

NEAs
- sizes
- radar typically quotes 40% uncertainties
- albedo/radar size mismatch
- shapes
- adapt stellar surface modeling tools
- light curve inversion/illumination model

a~2.8AU
d~270km x 80km
(neck~50-65km)

model: Franck Marchis


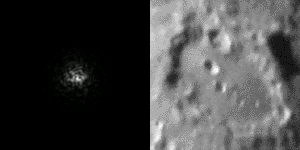
Phaethon
Dec 2017 ~ 0.07AU
d~6km


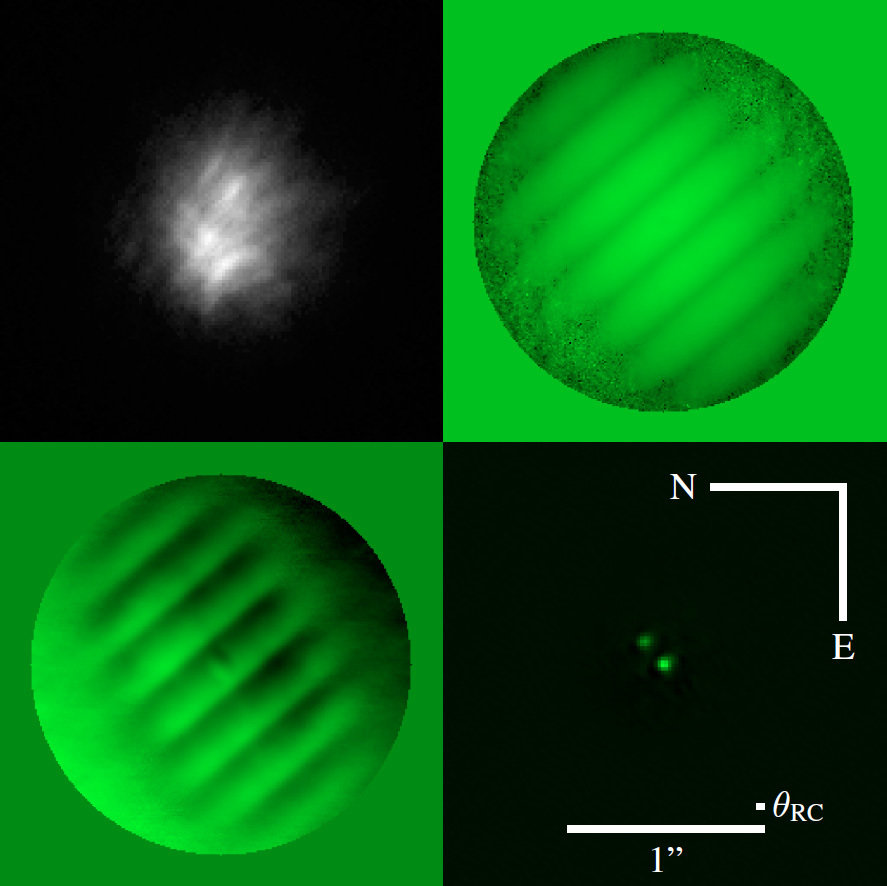
Point source PS
Phaethon power spectrum (resolved)

Seeing-limited
Reconstructed

42''
Two-color wide-field speckle reconstruction
from NESSI
- 0.25'' resolution from 500 frames (20s)
- compromise b/t angres and contrast
- Seeing ~ 0.85''
Urban telescope WF speckle
Wide-field speckle techniques for small, urban telescopes, Nicole M. Granucci, Elliott P. Horch, Southern Connecticut State Univ. (USA) talk Tues (coming up next actually)[10701-20]
Text
Text


M13
- astrometry of clusters
- very early results and little calibration or modelling over the FoV
Reconstructed
Seeing-limited
Abs astrometry residuals
~6-7 mas
4.2 mas
Further improvement possible to obtain ~0.02 pix (~0.4mas)
- optics, dither, deeper obs
0.05 mag accuracy on aperture photometry
FWHM ~7pix (0.57'')
FWHM ~4pix (0.3'')
MuSIC
- Davidson, Horch, and Majewski
- coherent fiber bundles to feed images from the focal plane to a speckle camera
- diffraction-limited imaging over a wide FoV
- analogous to integral field unit spectrograph
- simultaneous diffraction-limited speckle images for each object
- could go into place at the WIYN
Speckle imaging through a coherent fiber bundle, James W. Davidson, University of Virginia (USA), et al. poster Tues [10701-105]
Conclusions
- a brief history and introduction has attempted to set the stage for the current research
- highlighting the relevance of high angular resolution imaging to exoplanet and stellar research
- high demand for speckle imaging observing
- development of future community instruments
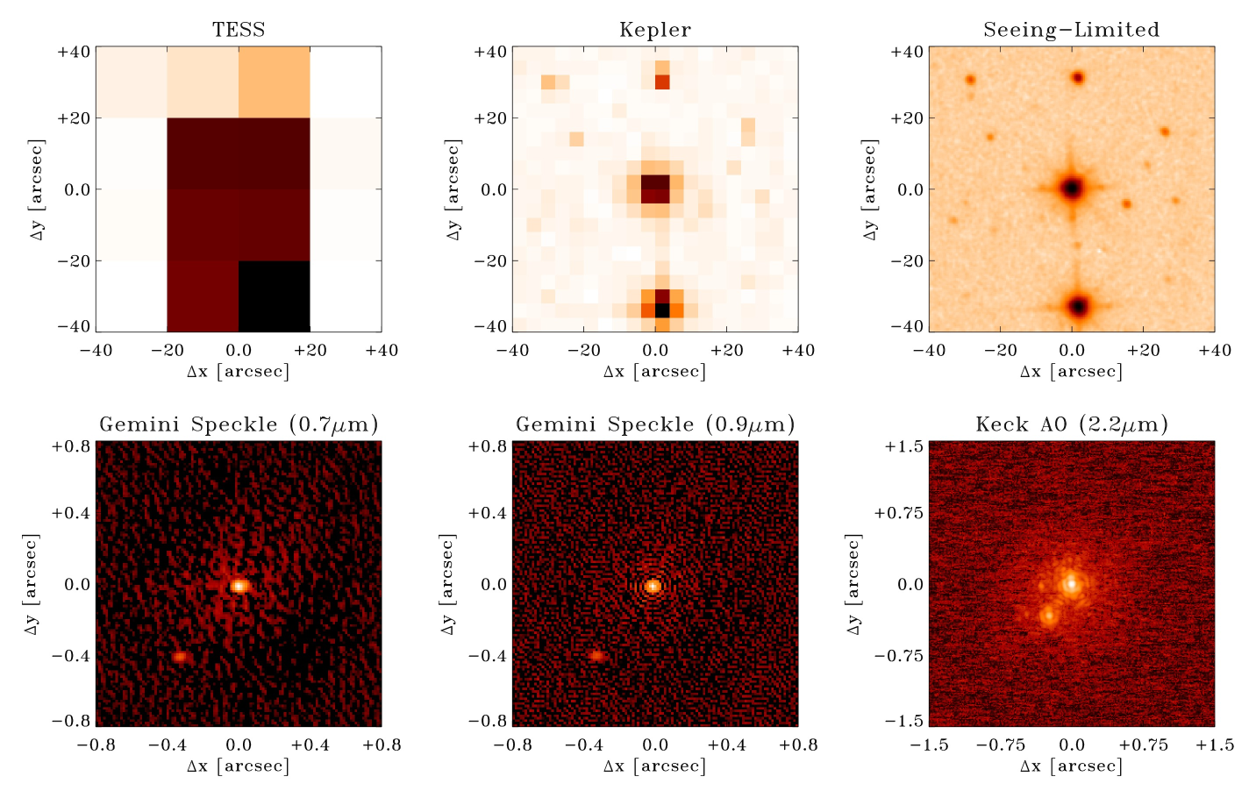
- small space telescopes, optimized for large surveys of the sky, like TESS and GAIA, perform relatively poorly at high-contrast, sub-arcsecond resolution where speckle imaging excels
- a cost-effective, efficient means to reach the diffraction limit with single aperture telescopes
Selected References -full list in manuscript
Brown, R. H. and Twiss, R. Q., Nature 177, 27{29 (Jan. 1956).
Hanbury Brown, R., Davis, J., and Allen, L. R., MNRAS 137, 375 (1967).
Labeyrie, A., A&A 6, 85 (May 1970).
Knox, K. T. and Thompson, B. J., ApJ 193, L45{L48 (Oct. 1974).
Weigelt, G., Scientifc Importance of High Angular Resolution at Infrared and Optical Wavelengths, Ulrich, M. H. and Kjaer, K., eds., 95{114 (1981).
Weigelt, G., Lowell Observatory Bulletin 9, 144{152 (1983).
Weigelt, G. P., Optics Communications 21, 55{59 (Apr. 1977).
Lohmann, A. W., Weigelt, G., and Wirnitzer, B., Appl. Opt. 22, 4028{4037 (Dec. 1983).
Fried, D. L., Journal of the Optical Society of America (1917-1983) 68, 1651–1658 (Dec. 1978).
Horch, E. P., Veillette, D. R., Baena Galle, R., Shah, S. C.,O'Rielly, G. V., and van Altena, W. F., AJ 137, 5057{5067 (June 2009).
Brugière, T., Mayer, F., Fereyre, P., Gu´erin, C., Dominjon, A., and Barbier, R., Nuclear Instruments and Methods in Physics Research A 787, 336–339 (July 2015).
Scott, N. J., Howell, S. B., Horch, E. P., and Everett, M. E., PASP 130, 054502 (May 2018).
Hofmann, K.-H. and Weigelt, G., A&A 278, 328-339 (Oct. 1993).
Law, N. M., Mackay, C. D., and Baldwin, J. E., A&A 446, 739{745 (Feb. 2006).
Tokovinin, A. and Cantarutti, R., PASP 120, 170 (Feb. 2008).
Andor, CCD, EMCCD and ICCDComparions & Minimizing Clock Induced Charge.
Howell, S. B., Everett, M. E., Sherry, W., Horch, E., and Ciardi, D. R., AJ 142, 19 (July 2011).
Furlan, E., Ciardi, D. R., Everett, M. E., Saylors, M., Teske, J. K., Horch, E. P., Howell, S. B., van Belle, G. T., Hirsch, L. A., Gautier, III, T. N., Adams, E. R., Barrado, D., Cartier, K. M. S., Dressing C. D., Dupree, A. K., Gilliland, R. L., Lillo-Box, J., Lucas, P. W., and Wang, J., AJ 153, 71 (Feb. 2017).
Furlan, E. and Howell, S. B., AJ 154, 66 (Aug. 2017).
Teske, J. K., Ciardi, D. R., Howell, S. B., Hirsch, L. A., and Johnson, R. A., ArXiv e-prints (Apr. 2018).
Fulton, B. J., Petigura, E. A., Howard, A. W., Isaacson, H., Marcy, G. W., Cargile, P. A., Hebb, L., Weiss, L. M., Johnson, J. A., Morton, T. D.,Sinuko , E., Cross eld, I. J. M., and Hirsch, L. A., AJ 154, 109 (Sept. 2017).
Hirsch, L. A., Ciardi, D. R., Howard, A. W., Everett, M. E., Furlan, E., Saylors, M., Horch, E. P., Howell, S. B., Teske, J., and Marcy, G. W., AJ 153, 117 (Mar. 2017).
Matson, R. A., Howell, S. B., Horch, E. P., Everett, M. E., ArXiv e-prints (May. 2018)
Backup Slides


Open to the community
- NOAO proposal process
- NESSI - WIYN@KPNO
- `Alopeke - Gemini-N
- DSSI - Gemini-S
- Transitioning from block queue operation to Facility Instrument status
NPP & internship opportunities: see me for details

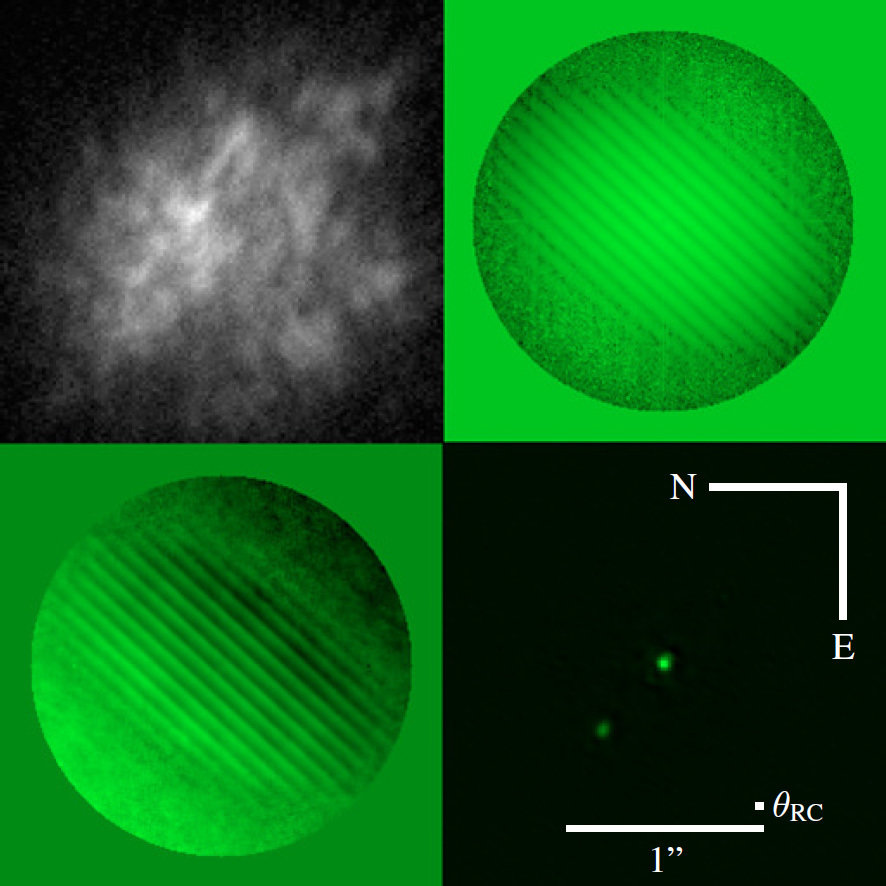
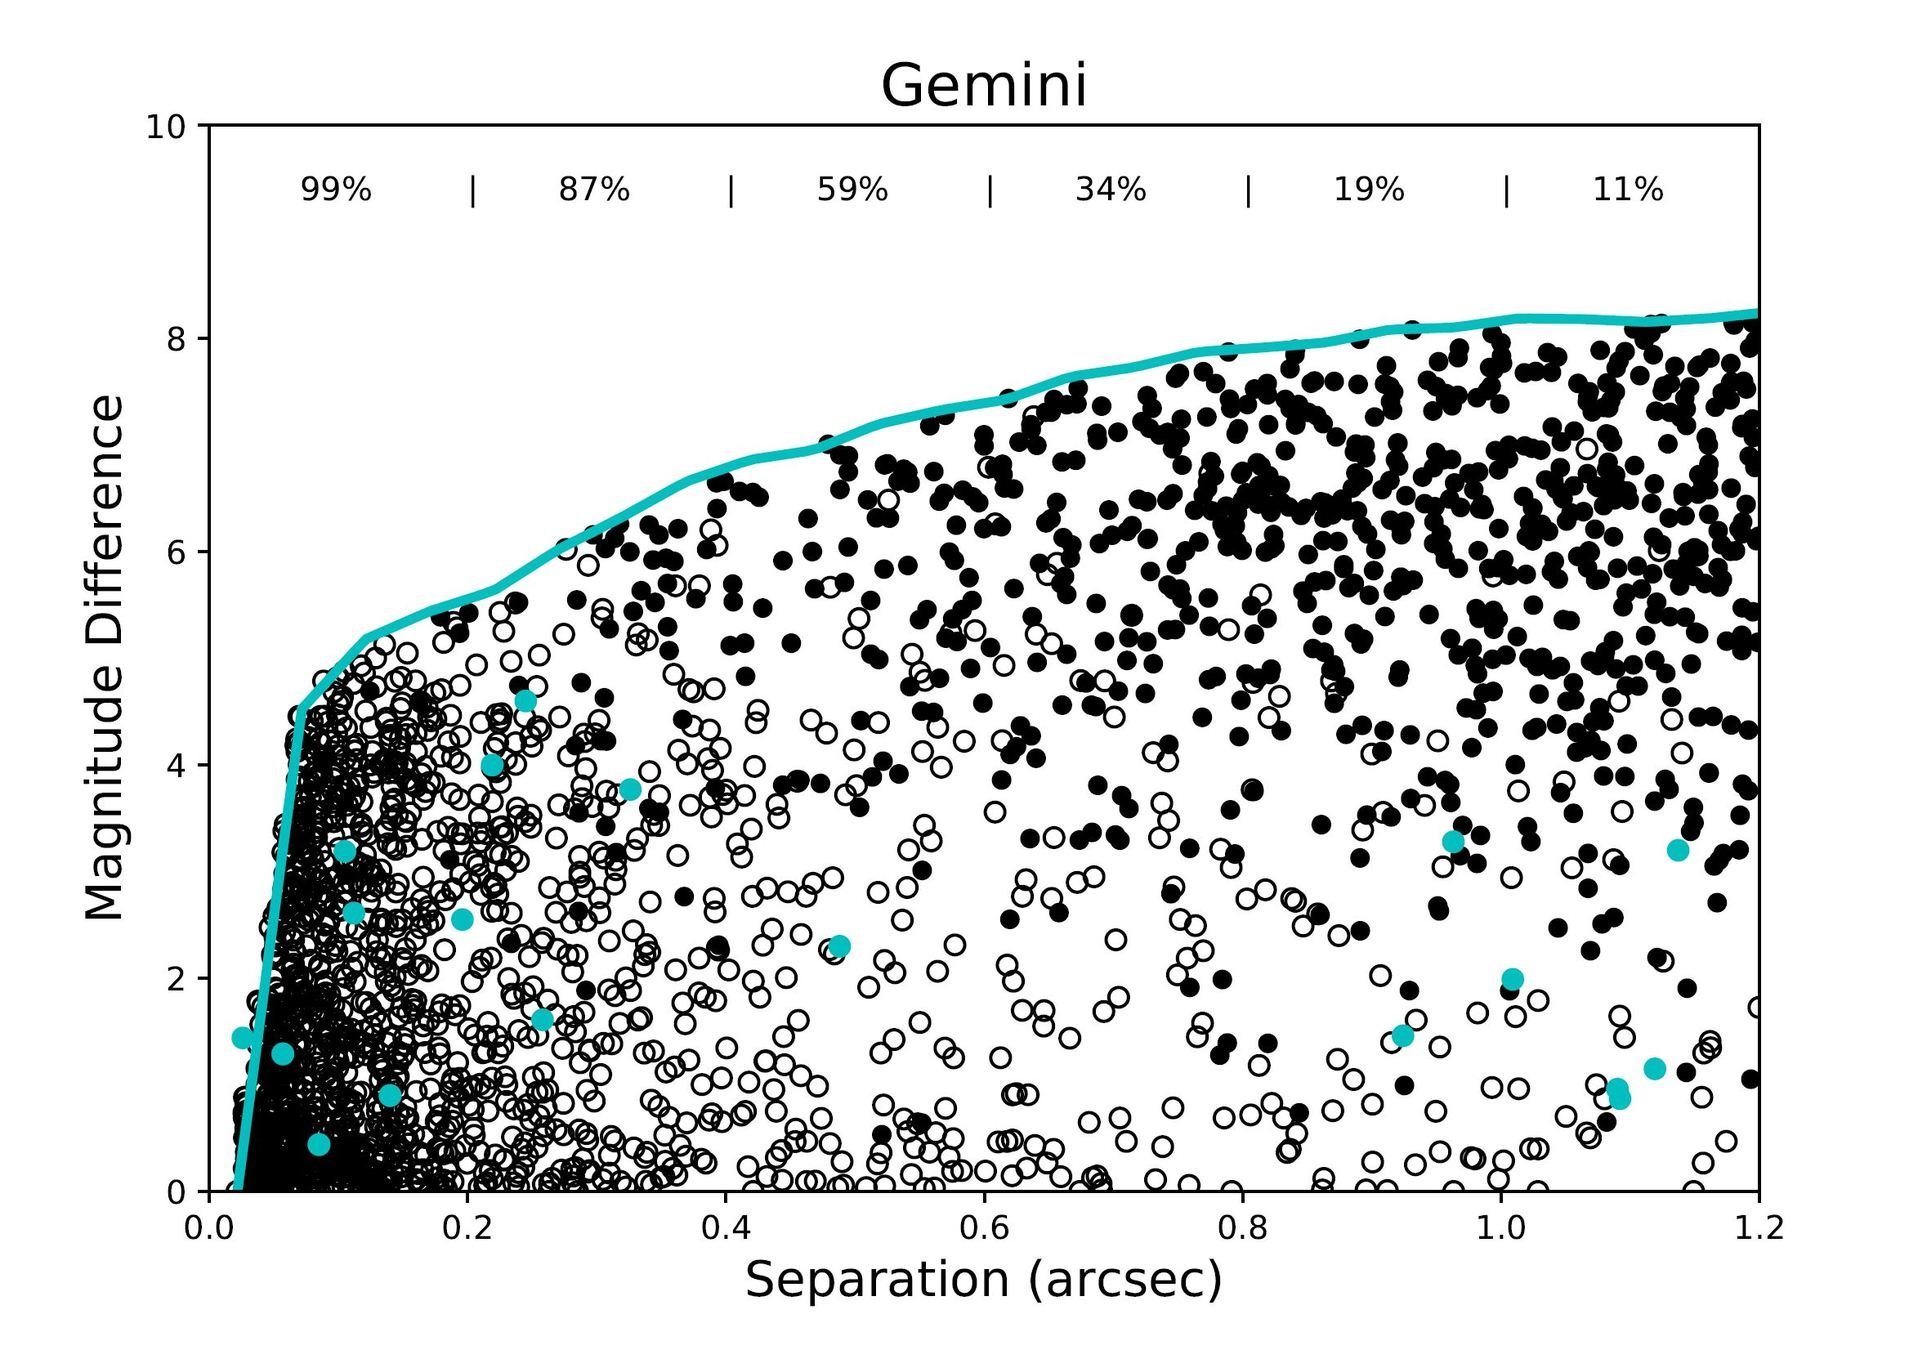
Detection percentage as a function of projected angular separation for the 883 nm speckle image of TRAPPIST-1. The curve is the 5σ detection limit from our image convolved with the detection likelihood (see the text). The result eliminates all companions in the blue region at separations of 0.32–17 au for the observed contrast ratios. Numbers on the plot represent the delta magnitude and spectral type limits at the corresponding points. For example, all companions earlier than T7 are eliminated to an inner separation of ∼8 au.
observed
bound (simulated)
line-of-sight (simulated)
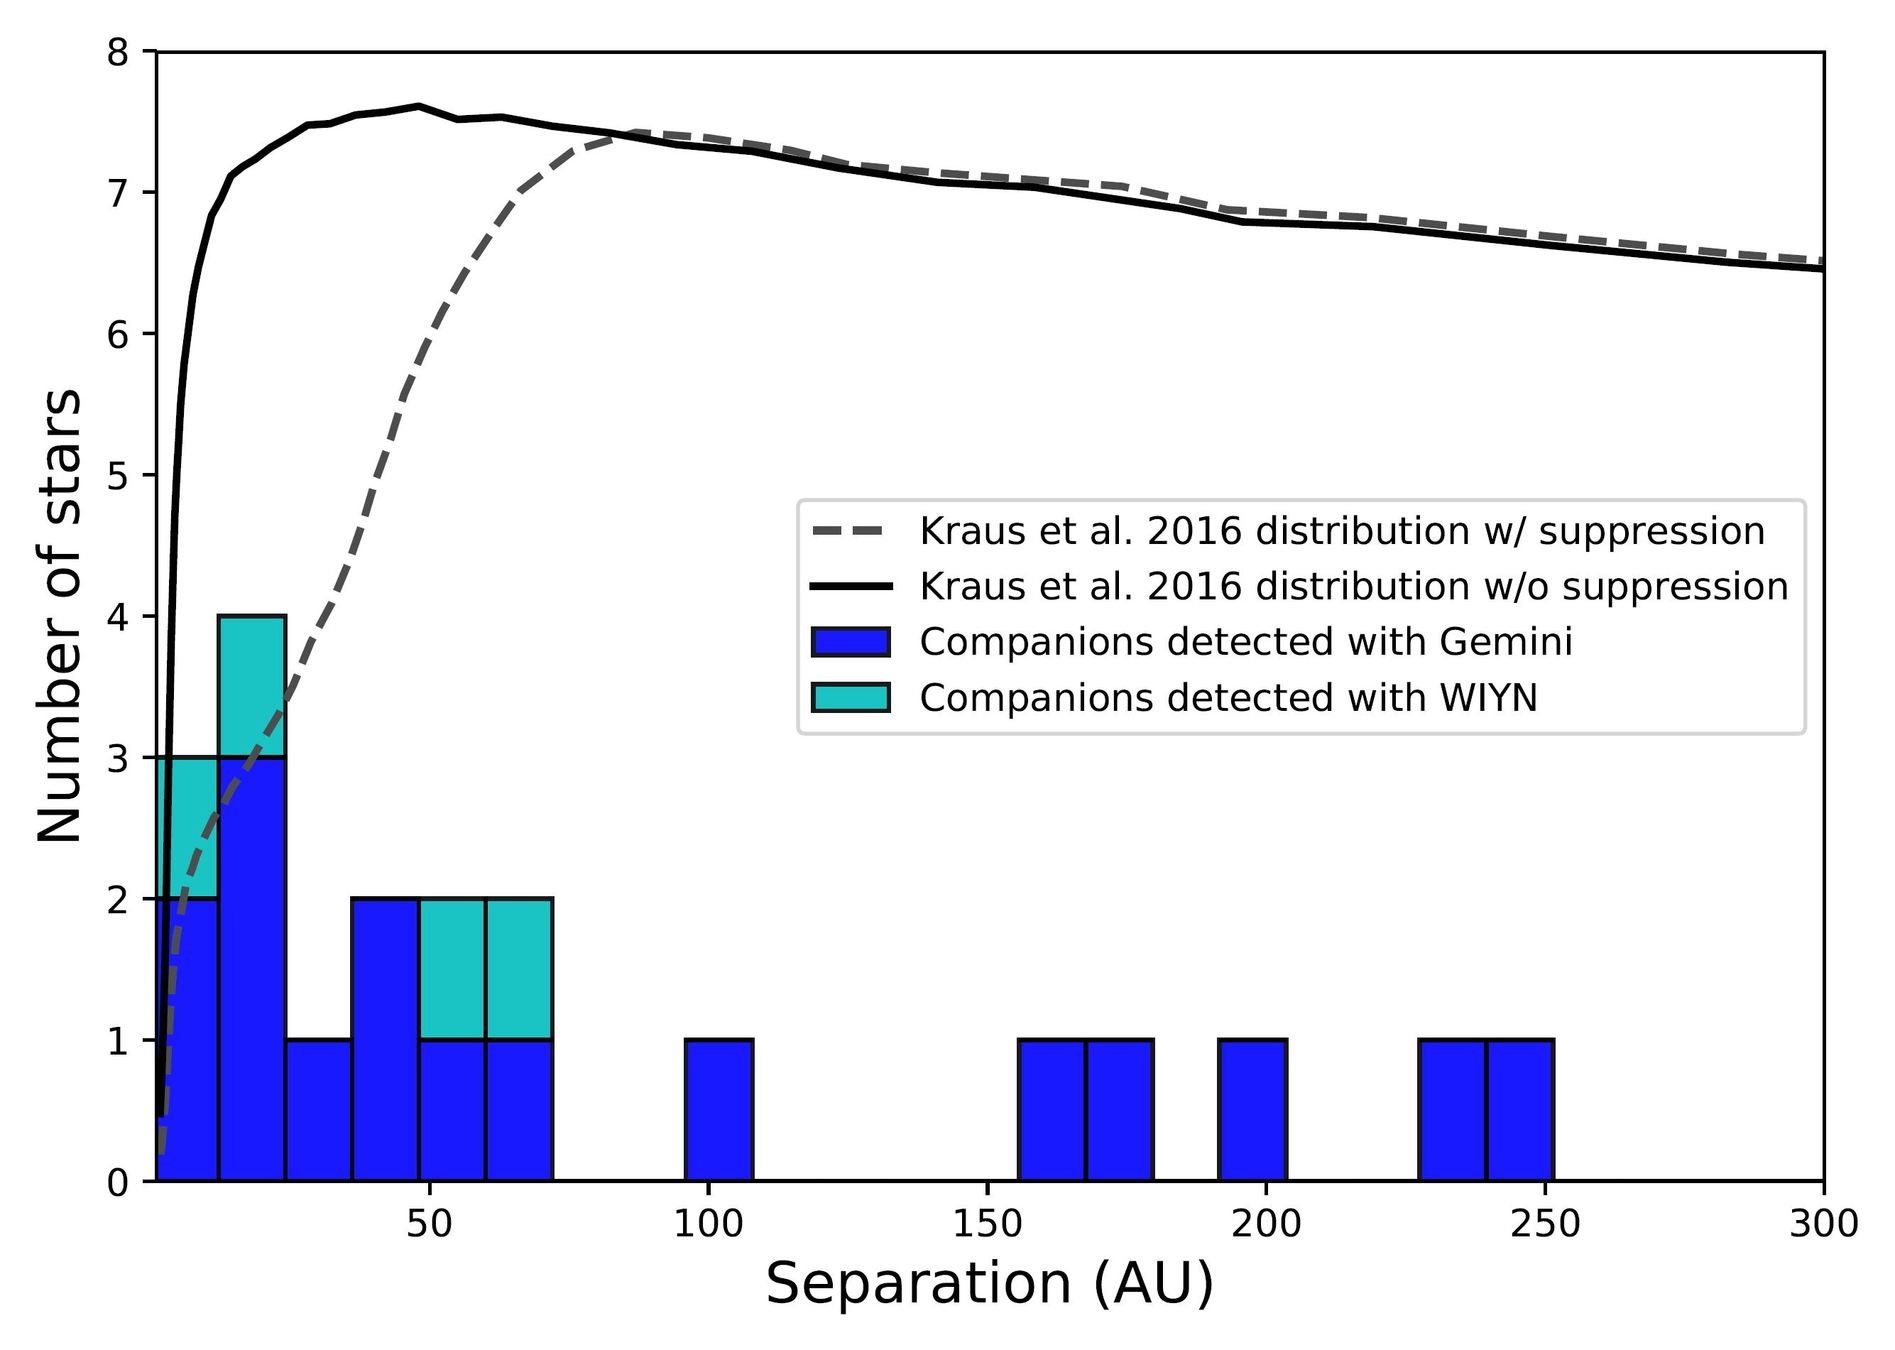
K2 binaries detectable with DSSI-
Matson et al. 2018 (submitted)
the current state of speckle imaging
By Nic Scott


