Sensible monitoring with Sensu
Avishai Ish-Shalom (@nukemberg)
In the beginning
God created The Servers and The Network
Now the dashboard was formless and empty, darkness was over the surface of the deep, and the Spirit of God was hovering over the servers.

And God said:
"Let there be Monitoring", and there was Monitoring
God saw that the monitoring was good, and he separated the green from the red.
And God said
“Let the data under the system be gathered to one place, and let a single process appear.” And it was so. God called the single process “server,” and the gathered data he called “checks” And God saw that it was good

Let's skip ahead a bit...
Now the cloud
was more crafty than any of the wild platforms the Lord God had made. He said to the sysadmin, “Did God really say, ‘You must configure everything manually’?”

The sysadmin said
to the cloud, “We may automate the servers in the system, but God did say, ‘You must not automate the monitoring that is in the middle of the system, and you must not touch it, or it will break.’”

“It will not certainly crash,”
the Cloud said to the Sysadmin. “For God knows that when you automate it your eyes will be opened, and you will be like Google, knowing good and evil.”

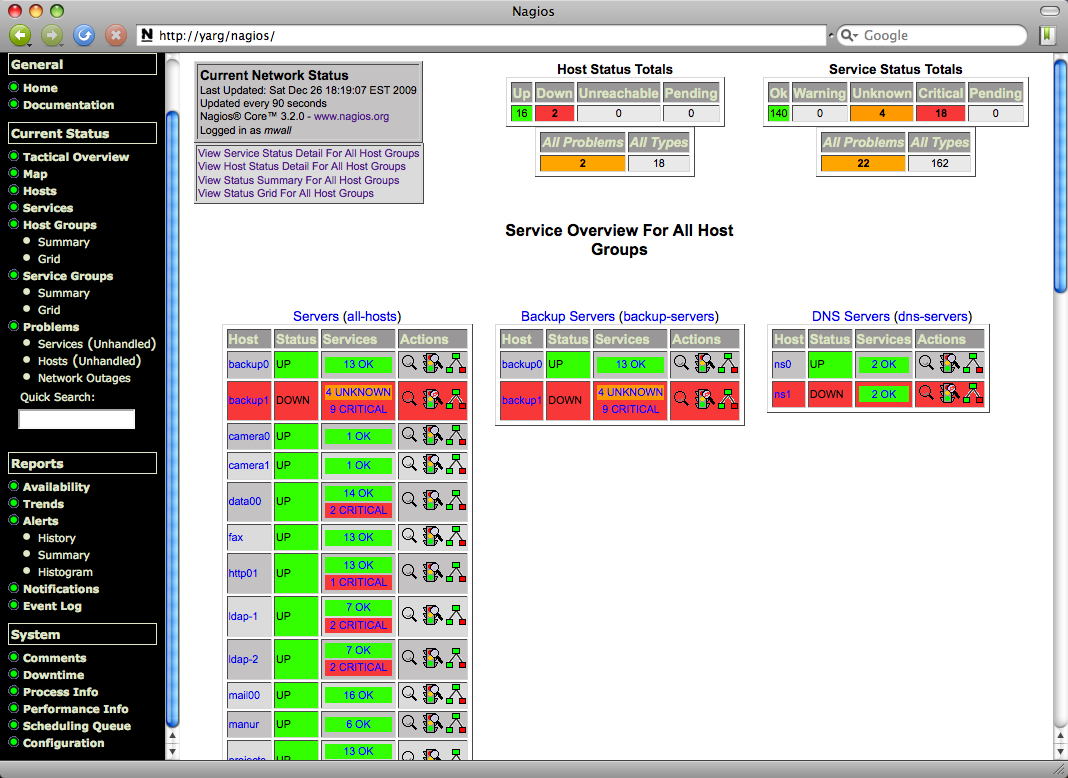
OK... jokes aside, what's wrong with Nagios?
Nagios was built for a static world of Pet servers
The Nagios model
- Checks executed on central server
- Host oriented model
- Every server needs to be configured
- File based configurations
- Scalability
- Configurations
- API
- Cluster aggregation
What's wrong?
A wild Sensu appears
Architecture

Features
- Auto client registration
- API
- Scalable
- Built for automation
- Aggregation
- Support for time-series data
Uchiwa

Mergable Json config files
{
  "checks": {
    "check_disk_usage": {
      "command": "check-disk-usage.rb -w :::disk.warning|80::: -c :::disk.critical|90:::",
      "subscribers": [
        "production"
      ],
      "interval": 60,
      "environment": ":::environment|production:::"
    }
  }
}
Check plugins
Compatible with Nagios
API
$ curl -s http://127.0.0.1:4567/clients | jq .
[
  {
    "timestamp": 1458625739,
    "version": "0.25.0",
    "socket": {
      "port": 3030,
      "bind": "127.0.0.1"
    },
    "subscriptions": [
      "dev"
    ],
    "environment": "development",
    "address": "127.0.0.1",
    "name": "client-01"
  }
]
Client (de)registration
- Auto register
- Deregister on clean shutdown (optional)
-
Deregister by API call (DELETE /clients/:id)
Integrations
- Notifications (Slack, PagerDuty)
- Time-series data (Graphite, InfluxDB)
- Events (ELK, GrayLog, Slack)
- CM (puppet, chef, ansible)
Checks collect data and create events
Handlers process the events passed on by Filters and optionally Mutate the event
Aggregates are pseudo checks that derive events from a group of checks
Checks are scheduled by the server and executed on the client
Stand-Alone checks are scheduled by the client
Sensu
- Auto client discovery
- Checks executed on clients
- Arbitrary aggregations
- API
- Mergeable json configs
Nagios
- Hosts must be configured
- Checks executed on server
- No aggregations*
- No API*
- Special config language
Cut the crap, let's have the bottom line
Pros
- Close to the Nagios model
- Compatible with Nagios plugins
- Scalable
- Automation friendly
- Modern
- Integration friendly
- Simple
Cons
- Close to the Nagios model
- Not powerful enough for serious app centric monitoring
- Barebones - no analytics, lame dashboard, no dependency graph, etc
Questions?

Sensible monitoring with Sensu
By Avishai Ish-Shalom


