Building a Real-Time GIS Services Workflow
Brent Porter
Center for Space Research
bporter@csr.utexas.edu
Experience
-
Web-based GIS
-
Desktop/os-level Applications/Scripts
-
GIS Infrastructure & Architecture
So, I am always torn in these kinds of meetings!

Do I talk about the programming and the lessons learned creating that code?
Or do I talk about the processes I set up to make the Real Time App a success?
Let me apologize now if you were looking for the coding option - I think in this venue going through the process is useful.

Today's Outline
-
Design of application data
-
Example application - MOVES
-
Workflow development

Let's discuss real time data...
or really any 'living' GIS mapping application or data flow
Living?
- One that may be different from access point to access point
- In other words, not static
- That is really what we mean we say 'Near Real Time' or 'Real Time' data/application

Which isn't to say...
Much of our discussion will work with static data too....
So.
Back to Design Characteristics. In particular Data design.
- One to a FEW operational layers (data streams)
- Temporal component that is intrinsic to the value of the data that is being visualized
- Not too many attributes! (Users don't need to see 50 fields - think 10 as a rule of thumb)
- Not too many features. This is the web - and now more often than not it is also mobile. Too many features will make your app slow/unstable
- Not too complex - ask yourself if you need data with large numbers of vertices.
Data Design Continued
- Also you want some common geographic features - something familiar to the users
- Think of the common mapping patterns online
- Aerials/Streets
- Remember who your users are - if they are the public they will not be as familiar as you with your application. Using a common set of features sets them up to succeed.
- Think of the common mapping patterns online
Operational Layers - examples
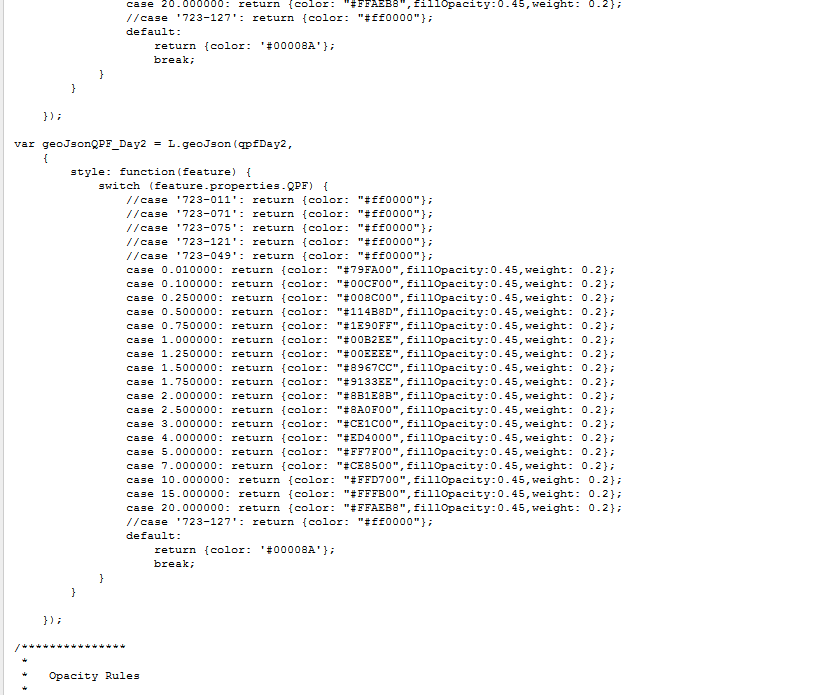
- Precipitation accumulation
- Precipitation forecast
- Geotagged photos
- Radar
- River gauges
Base Layer - examples
- Seamless or Patchwork Aerials or Satellite Imagery
- Streets based vector layer(s) - like open streetmap, bing maps, google maps or map quest maps
- Other thematic vector layer(s) - topographic, oceanographic, etc.
- Vector tiles - think Streets map like but YOU get to decide how it looks (colors/weights/etc)
Other Design considerations
- UI/UX
- mobile first, responsive, native app, etc
- Bootstrap, SASS/Less
- Application Design
- collection of pages, single page app, thick client app
- Architecture Design
- MVC, MVVC, etc
Unfortunately
each of those could be a separate presentation

Today's Outline
-
Design of application data
-
Example application - MOVES
-
Workflow development
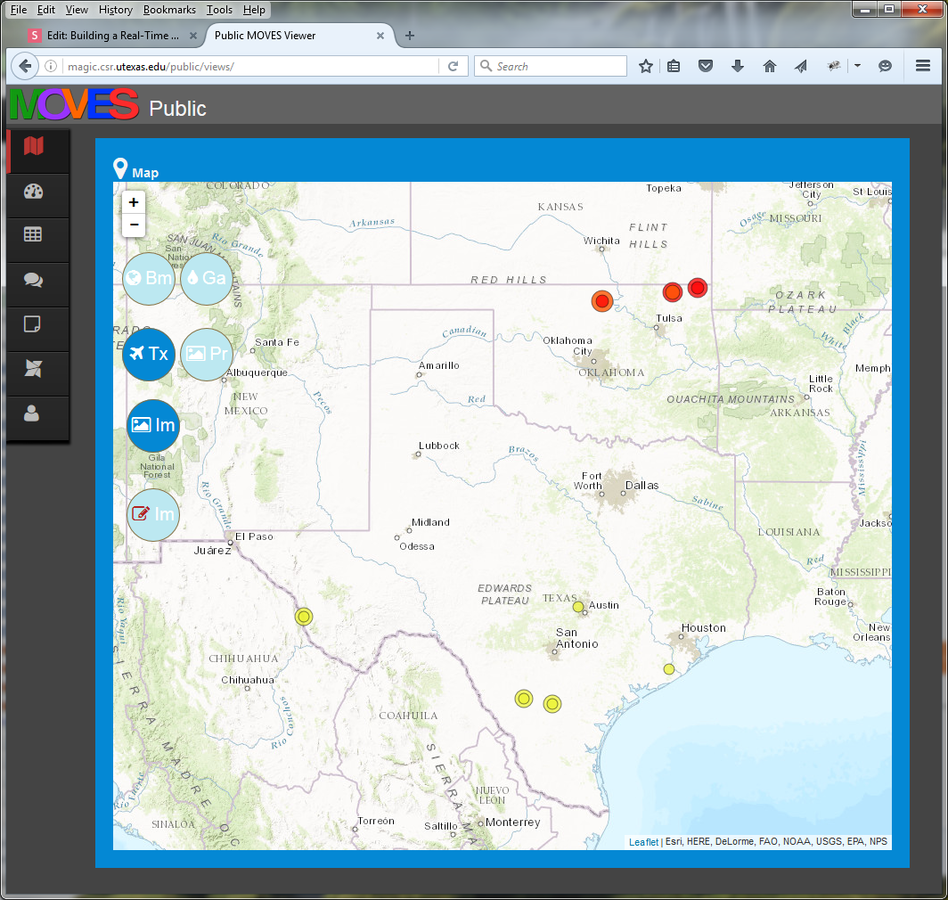
Working Example
- MOVES stands for Modeling, Observations and Visualization for Emergency Support (MOVES) Network
- http://magic.csr.utexas.edu/public/views/
Today's Outline
-
Design of application data
-
Example application - MOVES
-
Workflow development
Putting it all together
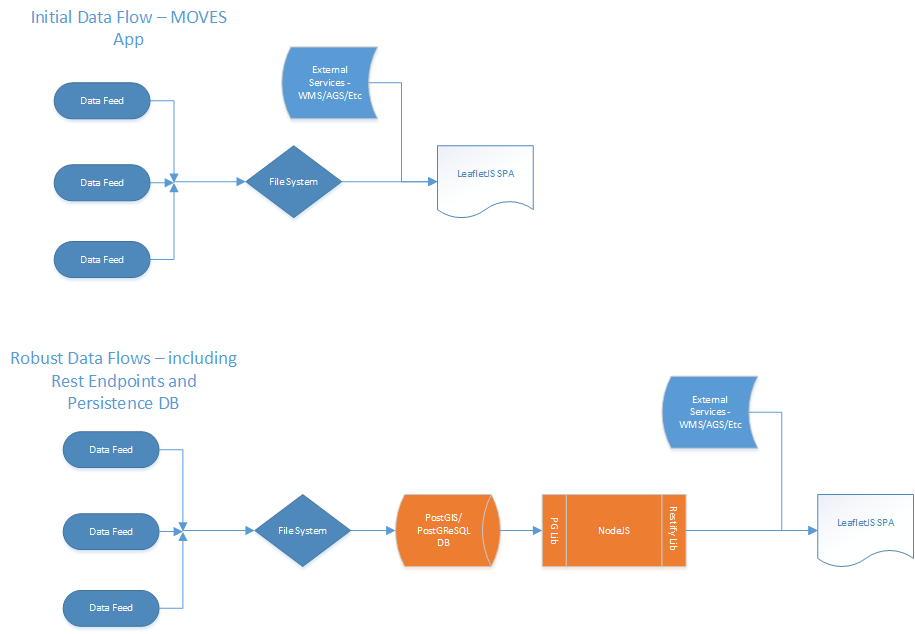
Workflow Considerations
- Data - incoming
- Data - storage
- Data - access
- Data - visualization
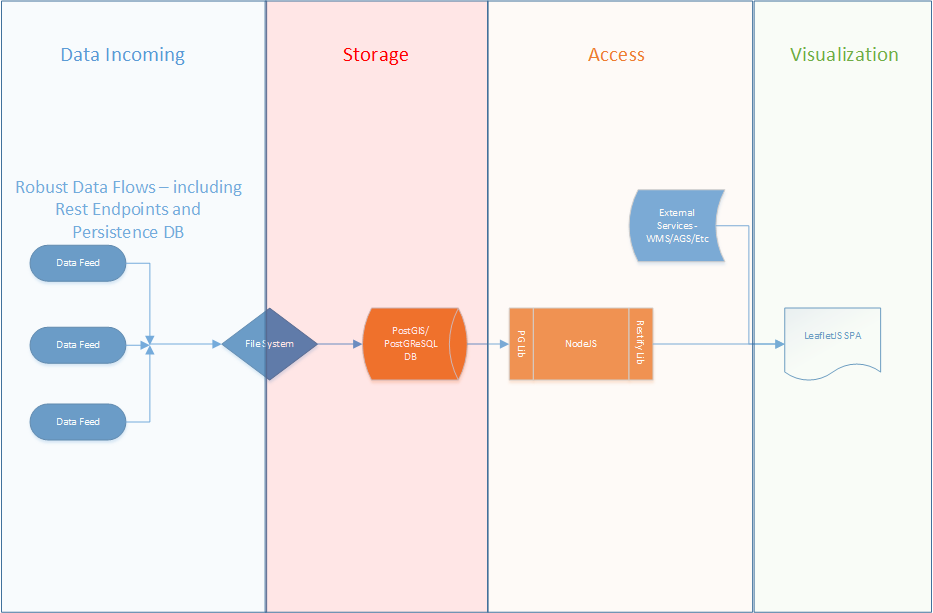
Data - incoming
- Need to use some tool to gather/process data into formats that can be used to store data
- Java/Python are my two favorite candidates
- We have expertise with each
- GIS api availability to allow you to focus on collection rather than creation of functionality
- GDAL/ogr2ogr - http://www.gdal.org/ We use this primarily for the ogr2ogr functionality that dovetails nicely with our data storage solution.
Data - storage
- PostgreSQL
- with PostGIS installed
- using built in functions to create javascript object notation (JSON) snippets
- https://www.postgresql.org/
- http://postgis.net/
- But... we still do have some data stored on file as well! - for uses such as image tiles in rest endpoint access
Data - access
- Rest endpoints! YMMV on how to implement these but I am currently using Nodejs for most of my rest endpoints - https://nodejs.org/en/
- Also both the pg/pg-connect libraries and restlet library for Nodejs from the npm js repository - https://www.npmjs.com/
- Make sure to emit JSON from the rest end point queries - http://json.org/
Data - visualization
- LeafletJS - http://leafletjs.com/
- very intuitive, open source javascript library that is easy to begin creating mapping applications with
- also has many third party plug-ins like ESRI (see next bullet)
- ESRI leaflet plugin - https://github.com/Esri/esri-leaflet
- allows you to access ArcGIS server tiled maps, feature layers and other ESRI Rest-based technology
- JQuery - http://jquery.com/ - used to integrate your spatial functionality with the common behaviors users need from a web 2.0 application.

URL
https://slides.com/organizedchaos/building-a-gis-services-workflow/
Questions?
email - bporter@csr.utexas.edu
twitter - brentaporter

Building a Real-Time GIS Services Workflow
By organizedchaos