May & June Floods 2015
What
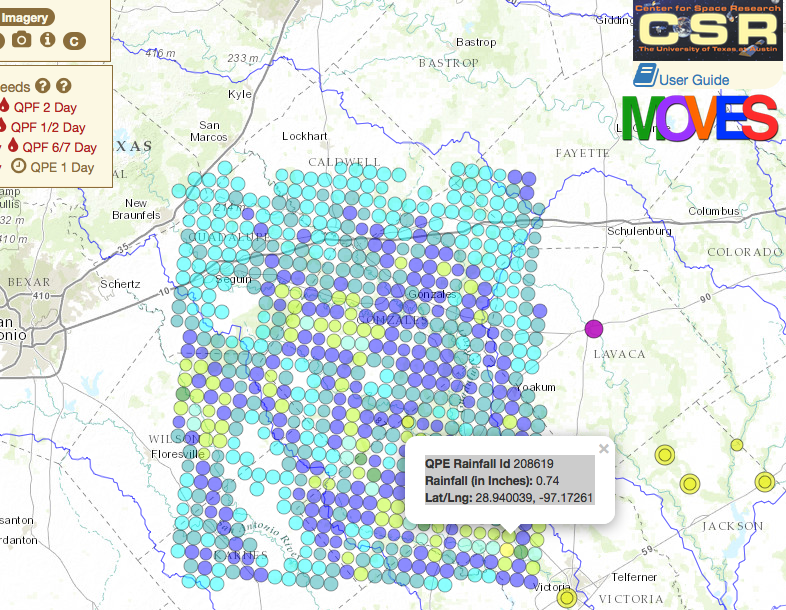
- Case study and walk through of some of the features I created as part of our MOVES application in response to the flooding of May/June 2015
Remember the earlier talk?
Refresher
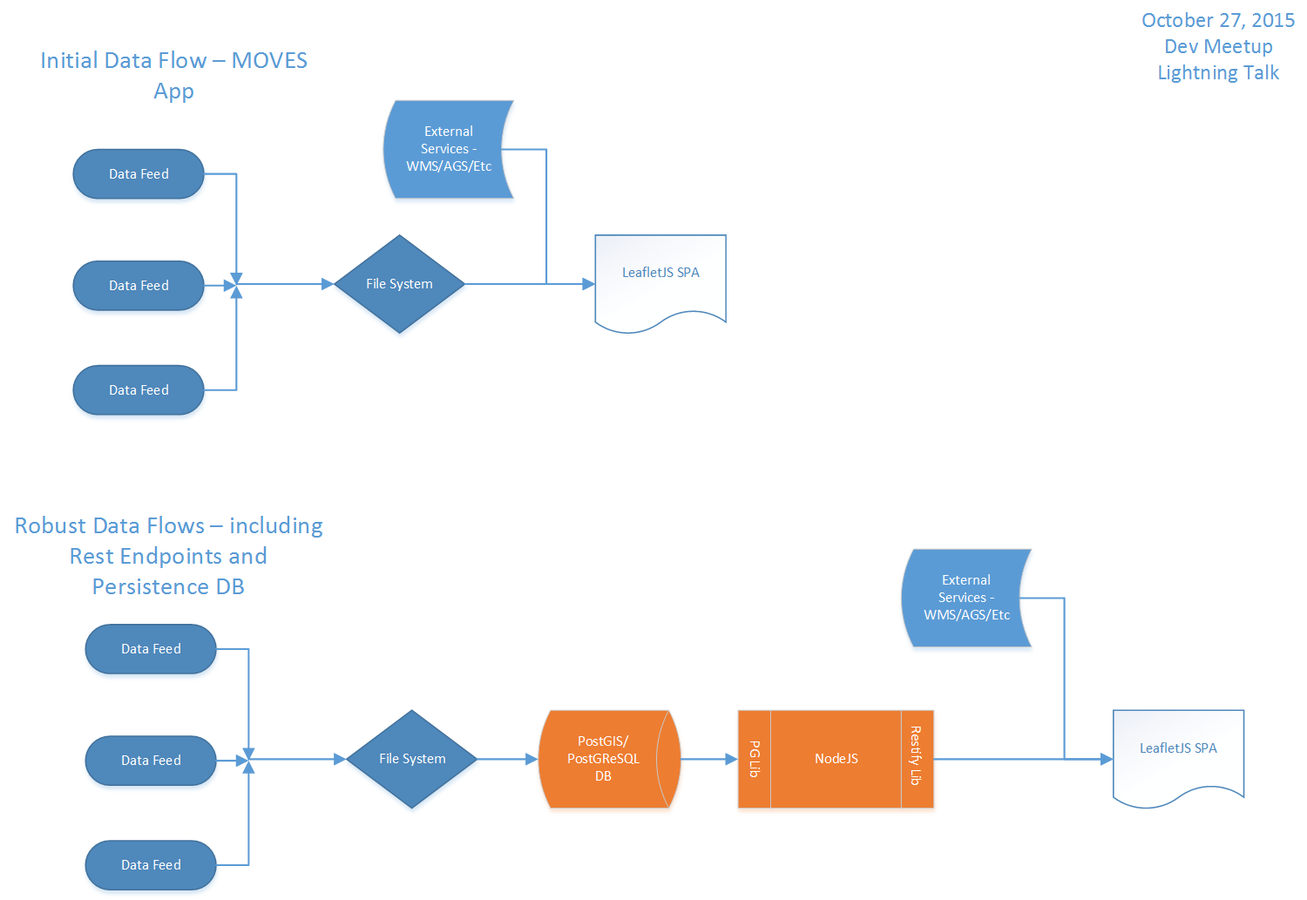
- Data flow
- scraped data from sources and included it in application as geojson
- river gauge data
- qpf/qpe
- Tx CAP photography of the areas impacted
- esri base maps & some custom tiles
- UAV data
- custom satellite data
- arcgis server rest endpoint (vs esri leaflet plugin)
- other wms layers
- google imagery service
- army corp of engineers levees layer
- radar data
- scraped data from sources and included it in application as geojson
Impressive?
- I know I'm not the most impartial person to ask but I think so...
- So lets take a look at some of this
How about that ArcGIS Server Rest API example?
Ok let's circle back around
Interesting but...
- as we added more and more data
- the app became slower... and slower
Why?
- because we were hanging more and more geojson files off of the application
- and this is still a browser based app!
- within those constraints it is impossible not to run into these sorts of slow downs
- we had hundreds...
- and then thousands of spatial objects that were being loaded into the app
- also, for the plane based imagery, the archive grew and grew
Solution?
Refactoring the app will fix performance!
More!
- nodejs
- pg and pg-query
- restify
Example
UT Dashboard we created
- started out with the same initial model as the MOVES app
- quickly became apparent that it didn't scale
Results
- after implementing the NodeJS and PostGres solution for the application it is both performant and scalable
- this is the model for moving forward with MOVES application
May & June Floods 2015
By organizedchaos