Bi-Weekly Presentation
Comparer Tool
Why?
- How can we distinguish online users from one another?
- Within a specified audience there exists clusters or segments of users who behave in a certain way
- If we can determine what distinguishes some segments from one another using clickstream history, we can more accurately make marketing decisions
What Do We Want?
- Quick, simple, automated way of classifying, distinguishing, and interpreting how users are behaving on the web.
-
Because this is clickstream data there can be a lot of features to deal with and wrap our heads around.
Chi-square:
- Univariate
- No dependent variables to define and you cannot make predictions.
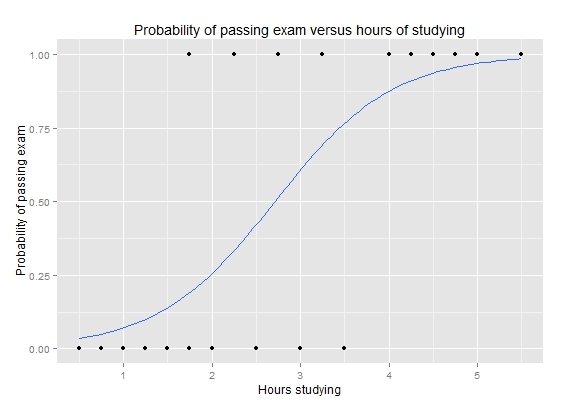
Logistic Regression
Dealing with a very sparse and high dimensional data set, how do we find a small number of features that separate an audience?
- Lasso
- Interpretable
- Reproducible (Utility)
Regularization
- Selecting K parameters;
- Tuning to return desired number of interpretable coefficients.
Classification
Domain visits, demographics, impressions, attributes, category, etc. for ebay shoppers and amazon shoppers
Model
Domain visits, demographics, impressions, attributes, category (without segment type)
Model
Amazon shopper
or
Ebay shopper
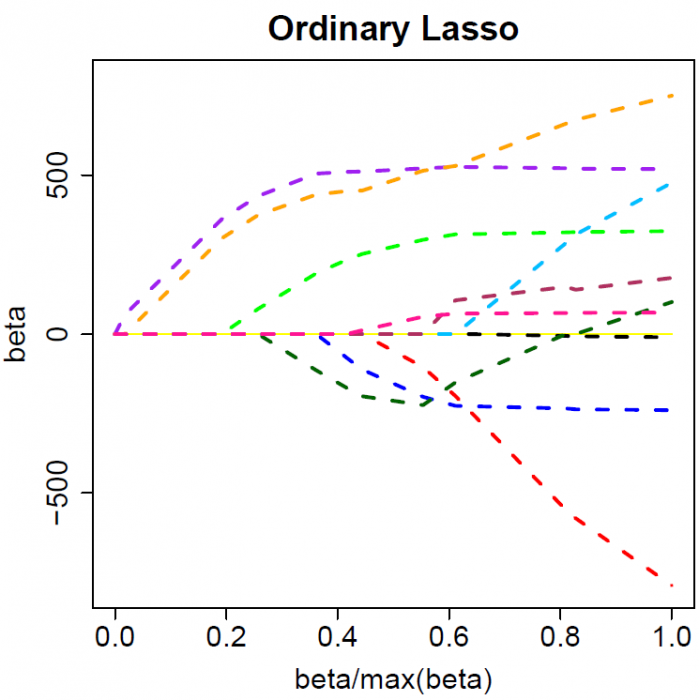
Lasso (least absolute shrinkage and selection operator)
- Simplification for easier interpretability
- Quick
- Reduction of overfitting
Feature Selection
Regularization
- Applying a penalty to increasing the magnitude of parameter values to reduce overfitting.
- Penalize large values of the parameters.
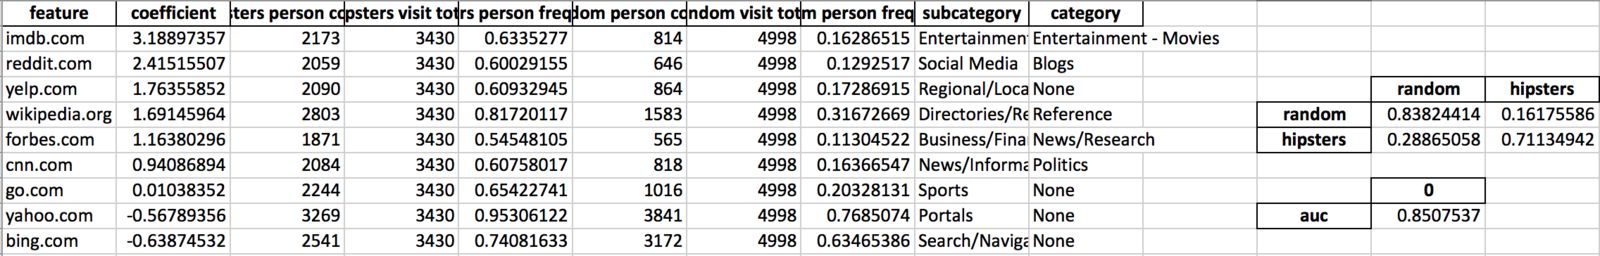
Output
- Within the constraints of the generalization value, the output will contain the most distinguishing features.
- leaves just the number of features we consider to be meaningful
- It will also have understandable summary values such as a confusion matrix and AUC score.
Python
Python 3 (its time)
Scikit-Learn - machine learning
SciPy - scientific computing
OpenPyXl - read and write Excel files
What?
Prepare > Setup > Run > Analyze
| Person_id | Domain | url_count | Segment |
|---|---|---|---|
| 4321 | etsy.com | 4 | amazon |
| 4321 | reuters.com | 1 | amazon |
| 4321 | slate.com | 2 | amazon |
| 5442 | yahoo.com | 1 | ebay |
| 5442 | cragslist.com | 10 | ebay |
Prepare > Setup > Run > Analyze
Metric
Value
Gather and Prepare Data
Setup and Installation
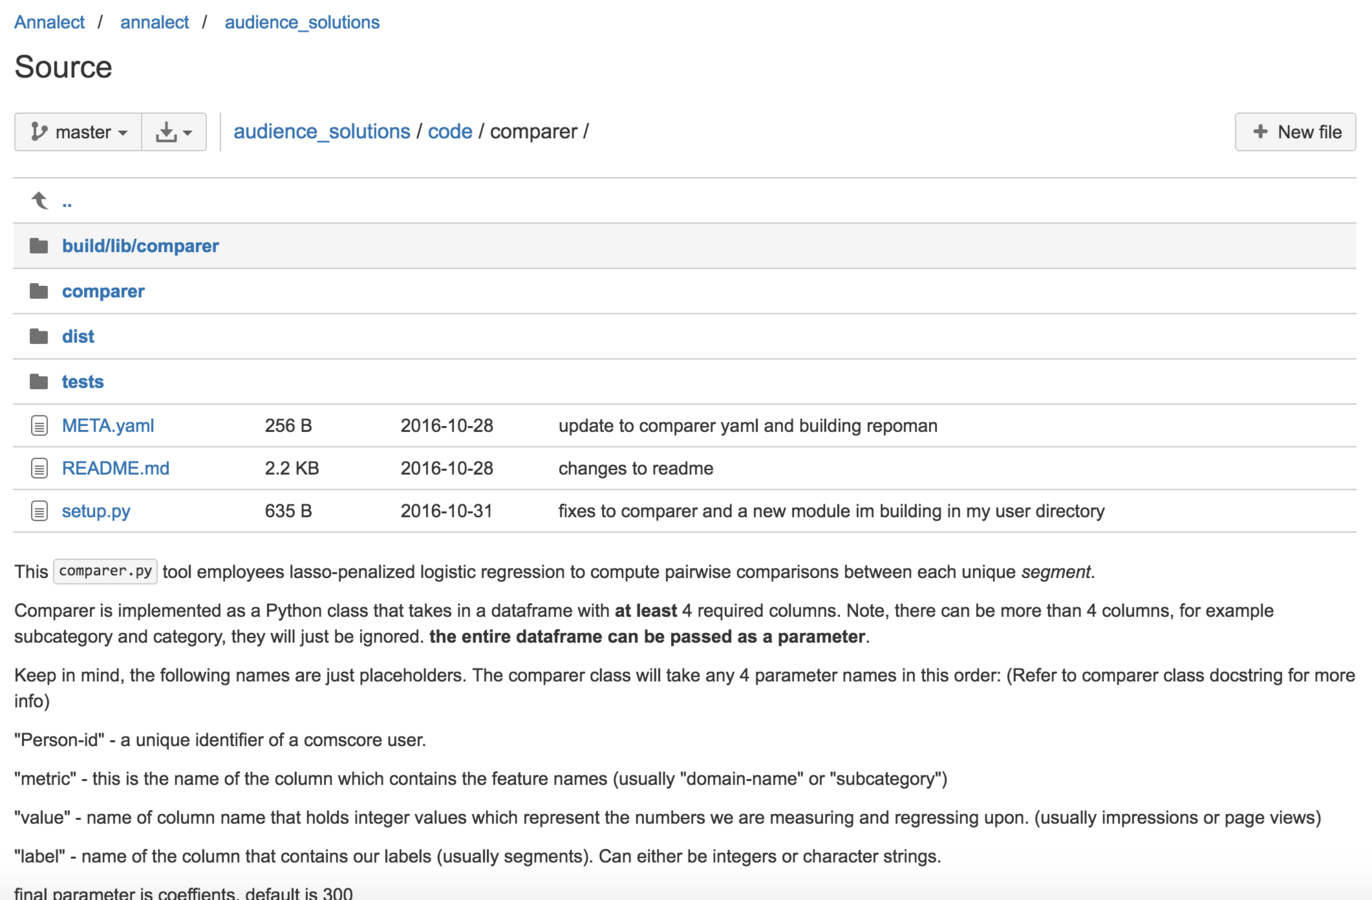
Possible sources to get the code:
- Clone repo from BitBucket
- Download file structure from shared zip file
- Hopefully soon: Pip install from git link
Prepare > Setup > Run > Analyze
One inside the pkg/directory:
>> python setup.py install
Load File and Run
import pandas as pd
from comparer import *

filepath = 'lays_comparer_input.csv'
data = pd.read_csv(filepath, low_memory=False)
data.segment = data.segment.astype(str)
lays = Comparer(data, 'domain_name', 'views', 'segment', 300)
lays.export_report("/Users/patrick.nieto/Documents/lays_comparer_output")
Prepare > Setup > Run > Analyze
Example script:
Once installed, all need to do is:
- Import the comparer class
- load in your csv file using pandas
- reference the necessary columns as Comparer parameters
- And specify how many coefficients you need
>> python comparey.py "/Users/Patrick.nieto/lays/lays_comparer_input.csvPrepare > Setup > Run > Analyze
from __future__ import division
import pandas as pd
import numpy as np
import os
import openpyxl
from openpyxl.styles import Font
from sklearn.feature_extraction import DictVectorizer
from sklearn.cross_validation import train_test_split
from sklearn.linear_model import LogisticRegression
from sklearn.preprocessing import normalize
from sklearn import metrics
from itertools import combinations
from scipy.sparse import csr_matrix
from collections import Counter
import pickle
import sys
from .logger import logger


class Comparer(object):
    def __init__(self, df, metric, value, label, coefficients=20):
        self.df = df
        self.metric = metric
        self.value = value
        self.label = label
        self.coefficients = coefficients
        self.results = None
        self.pair_wise = None
        self.__handle_data()
        self.__fit()
        self.__summary_lookups()

    def __summary_lookups(self):

        logs = logger.logging_setup('Summary_lookups')

        logs.info('creating dictionary of segment totals...')
        self.segment_totals = self.df.groupby(self.label)["person_id"].nunique().to_dict()
        logs.info('creating dictionary of domain_totals...')
        self.url_counts = (self.df
                               .groupby([self.metric, self.label])['person_id']
                               .nunique()
                               .unstack(self.label)
                               .fillna(0)
                               .to_dict('index'))
        if 'subcategory' in self.df.columns:
            logs.info('creating dictionary of domain categories...')
            self.categories = {k: v[['subcategory', 'category']].iloc[0] for k, v in self.df.groupby(self.metric)}

    def __handle_data(self):
        self.__drop_nulls()
        self.__verify_types()

    def __verify_types(self):
        # Force variable name to be a string
        self.df[self.metric] = self.df[self.metric].astype(str)
        # Force segment to be a string
        self.df[self.label] = self.df[self.label].astype(str)

    def __drop_nulls(self):
        if 'category' in self.df.columns:
            self.df['category'].fillna('None', inplace=True)
        if 'subcategory' in self.df.columns:
            self.df['subcategory'].fillna('None', inplace=True)
        self.df.dropna(inplace=True)

    def __fit(self):
        """
        params
        """

        logs = logger.logging_setup('Model_fit')

        df = self.df
        coefficients = self.coefficients
        results = dict()

        subsets = self.subset_data_extract_vectors(df)

        for k, i in subsets:  # iterate over new dictionary to run logistic regression

            # Vectorize list of dictionaries and apply logs.function to matrix
            v = DictVectorizer(sparse=True)
            x = v.fit_transform(i[0])
            x = csr_matrix.log1p(x)
            x = normalize(x, copy=False)

            # Change all y values to 1's and 0's
            var1 = k.split('_')[0]
            y = [1 if _ == var1 else 0 for _ in i[2]]

            # split features, labels, and person id's respectively into train and test
            x_train, x_test, \
            y_train, y_test, \
            p_train, p_test = train_test_split(x, y, i[1], test_size=0.33, random_state=42)

            j = [1]
            count = 0
            size = list()
            circle = False
            switch = None
            while k not in results:

                c = j[count]
                clf = LogisticRegression(penalty='l1', C=c,
                                         fit_intercept=False, class_weight="balanced")
                clf.fit(x_train, y_train)
                n = len([_ for _ in clf.coef_[0, :] if abs(_) > 0])
                size.append(n)
                logs.info('Fit #{}, C={}, now at {} coefs'.format(count, c, n))
                temp = [clf, size[count]]

                if count > 100:
                    results[k] = v, temp[0], temp[1], x_test, y_test
                    break

                if coefficients*.95 <= n <= coefficients*1.05:
                    results[k] = v, temp[0], temp[1], x_test, y_test
                    break

                if len(size) > 1:
                    current = size[-1]
                    previous = size[-2]
                    if ((current >= coefficients >= previous) or
                       (current <= coefficients <= previous)):
                        circle = True
                        switch = j[-2]
                    if circle:
                        new_c = (j[-1] + switch) / 2
                        j.append(new_c)
                    else:
                        if size[count] >= coefficients*1.1:
                            j.append(j[count]/2)
                        elif size[count] <= coefficients*.9:
                            j.append(j[count]*2)
                        else:
                            results[k] = v, temp[0], temp[1], x_test, y_test
                elif size[count] >= coefficients*1.1:
                    j.append(j[count]/2)
                elif size[count] <= coefficients*.9:
                    j.append(j[count]*2)
                else:
                    results[k] = v, temp[0], temp[1], x_test, y_test
                    break
                count += 1

        self.results = results

    def subset_data_extract_vectors(self, df):

        """
        Subset data-frame for every combination of segments.
        Organize features labels and people

        :param df: data frame
        :return: dictionary. key = 1 segment comparison
                            value = features, labels, people
        """

        logs = logger.logging_setup('Subsets')

        # iterate over all possible combinations of segments. Order doesnt matter.
        possible_keys = sorted(df[self.label].unique())

        if len(possible_keys) <= 1:
            logs.critical("There must be more than one segment type to run comparer")
            sys.exit()

        for i in combinations(possible_keys, 2):
            # create lists to hold features, labels and people
            feature_vec = list()
            y = list()
            person_vec = list()

            # subset dataframe for just the current segments in the loop and fill empty lists.
            pair = df[(df[self.label] == i[0]) | (df[self.label] == i[1])]
            grouped = pair.groupby(["person_id"])  # group on people
            for key, value in grouped:
                y.append(list(value[self.label])[0])
                person_vec.append((key, value[self.metric].unique()))

                length = len(value[self.value])
                k = pd.Series(np.ones(length))
                k.index = value[self.metric]

                feature_vec.append(k.to_dict())

            # create dict for every segment comparison with features, people and labels
            logs.info('subsetting for {}_vs_{}...'.format(i[0], i[1]))
            logs.info('length of y\'s: {}'.format(Counter(y)))
            key_name = '{}_vs_{}'.format(i[0], i[1])
            # pair_wise[key_name] = feature_vec, person_vec, y
            yield key_name, [feature_vec, person_vec, y]

    def report(self):

        logs = logger.logging_setup('Report')

        if self.results is None:
            raise Exception("Something went wrong!")
        models = sorted(list(self.results.keys()))
        output = list()
        for i, key in enumerate(models):
            non_zero_params = self.results[key][2]
            top_coefs = self.get_top_coefs(key)

            tp = ['"{}": {}'.format(x[0], round(x[1], 2)) for x in top_coefs]
            top = ", ".join(tp)
            auc = self.get_auc(key)
            row = "{:^10}: {:>10} non-zero coefs; AUC: {}, top 3 features are [{}]".format(
                key, non_zero_params, auc, top
            )
            output.append(row)
        return output

    def get_top_coefs(self, key, n = 3):
        """
        Funtion to return the top n coefficients, sorted by absolute value.
        :param key: Model to investigate, identified by e.g. '1_vs_2'
        :param n: The number of coefficients to return.
        :return:

        """
        logs = logger.logging_setup('Top_coefs')

        seg1 = key.split('_')[0]
        seg2 = key.split('_')[-1]
        # extract feature names
        feature_names = self.results[key][0].get_feature_names()

        # totals = [self.segment_totals[x] for x in feature_names]
        # number_visits = [self.url_counts[x] for x in feature_names]
        seg1_totals = self.segment_totals[seg1]
        seg2_totals = self.segment_totals[seg2]
        seg1_person_count = [seg1_totals]*len(feature_names)
        seg2_person_count = [seg2_totals]*len(feature_names)

        domain1_totals = [self.url_counts[x][seg1] for x in feature_names]
        domain2_totals = [self.url_counts[x][seg2] for x in feature_names]

        person_freq1 = [y/x for x, y in zip(seg1_person_count, domain1_totals)]
        person_freq2 = [y/x for x, y in zip(seg2_person_count, domain2_totals)]

        if 'categories' in self.__dict__:
            sub_cats = [self.categories[x]['subcategory'] for x in feature_names]
            reg_cats = [self.categories[x]['category'] for x in feature_names]
        else:
            sub_cats = ['' for _ in feature_names]
            reg_cats = ['' for _ in feature_names]

        coefs = self.results[key][1].coef_

        # zip together lists for data frame columns
        logs.info("Zipping together lists for dataframe...")
        results = zip(feature_names, coefs[0, :], domain1_totals, seg1_person_count, person_freq1,
                      domain2_totals, seg2_person_count, person_freq2, sub_cats, reg_cats)
        logs.info("Trying to sort")
        top_coefs_0 = sorted(results, key=lambda x: x[1], reverse=True)
        top_coefs_0 = [x for x in top_coefs_0 if abs(x[1]) > 0]

        return top_coefs_0[:n]

    def get_confusion_matrix(self, key):

        logs = logger.logging_setup('Confusion_matrix')
        # predict y's and calculate confusion matrix
        x_test = self.results[key][3]
        y_test = self.results[key][4]
        y_preds = self.results[key][1].predict(x_test)

        cm = metrics.confusion_matrix(y_test, y_preds)
        # plt.figure()
        # plot_confusion_matrix(cm, 'Confusion matrix')

        cm_normalized = cm.astype('float') / cm.sum(axis=1)[:, np.newaxis]
        # plt.figure()
        # plot_confusion_matrix(cm_normalized, title='Normalized confusion matrix')

        return cm, cm_normalized

    def get_auc(self, key):

        """
        calculate auc against testing
        :param key:
        :return:
        """
        logs = logger.logging_setup('AUC')

        x_test = self.results[key][3]
        y_test = self.results[key][4]
        pos_label = self.results[key][1].classes_.max()
        preds = self.results[key][1].predict_proba(x_test)[:, 1]
        fpr, tpr, _ = metrics.roc_curve(y_test, preds, pos_label=pos_label)
        auc = metrics.auc(fpr, tpr)
        return auc

    def export_model(self, key, directory):
        """
        Function to save out:

          1) The DictVectorizer to a pickled object for re-use.
          2) The model (clf) as a picked object for re-use.
          3) An Excel file, containing two tabs:
              - Summary: More scores
                    - AUC
                    - Accuracy
                    - Confusion Table
              - Coefficients: A table of non-zero coefficients.
        :return:

        """

        logs = logger.logging_setup('Model_export')

        temp = list()

        if not os.path.exists(directory):
            os.makedirs(directory)

        if self.results is None:
            raise Exception("Something went wrong!")

        logs.info("pickling vectorized dictionary...")
        filename = '{}-DictVectorizor.pk'.format(key)
        with open(os.path.join(directory, filename), 'wb') as handle:
            pickle.dump(self.results[key][0], handle)

        logs.info("pickling the model (clf)...")
        filename = '{}-model.clf'.format(key)
        with open(os.path.join(directory, filename), 'wb') as handle:
            pickle.dump(self.results[key][1], handle)

        logs.info("creating Excel file with summary scores...")
        pdwriter = pd.ExcelWriter('{}/results.xlsx'.format(directory), engine="openpyxl")

        for key in self.results.keys():
            temp.append([key, self.get_top_coefs(key, 1)[0][0], self.get_top_coefs(key, 1)[0][1]])
        data = pd.DataFrame(temp, columns=['seg', 'feature', 'value'])

        with pdwriter as the_file:
            data.to_excel(the_file, sheet_name="model_summary", index=False)

        wb = openpyxl.load_workbook('results.xlsx')
        bold_style = Font(bold=True)
        italic_style = Font(italic=True)
        summary = wb["model_summary"]

        summary["A1"].font = bold_style
        summary["B1"].font = bold_style
        summary["C1"].font = bold_style
        for i in range(2, 12):
            summary["A{}".format(i)].font = italic_style

    def export_report(self, directory, filename = "comparison_results_general"):
        """
        A function to produce an Excel file containing one tab for each comparison, including
          1) A table of the non-zero coefficients.
          2) A summary table to the side containing the confusion matrix
          3) The AUC score
        :return
        :
        """

        logs = logger.logging_setup('Report_export')

        if not os.path.exists(directory):
            os.makedirs(directory)

        logs.info("creating Excel file with summary scores...")
        file_path = '{}/{}.xlsx'.format(directory, filename)
        pdwriter = pd.ExcelWriter(file_path, engine="openpyxl")

        for key in self.results.keys():

            var1 = key.split('_')[0]
            var2 = key.split('_')[-1]
            data = pd.DataFrame(self.get_top_coefs(key, -1), columns=['feature', 'coefficient',
                                                                      '{} person count'.format(var1),
                                                                      '{} visit total'.format(var1),
                                                                      '{} person frequency'.format(var1),
                                                                      '{} person count'.format(var2),
                                                                      '{} visit total'.format(var2),
                                                                      '{} person frequency'.format(var2),
                                                                      'subcategory', 'category'])

            cm = self.get_confusion_matrix(key)[1]  # 1 is for normalized matrix
            auc = self.get_auc(key)

            table = pd.DataFrame(cm, columns=[var2, var1], index=[var2, var1])
            table2 = pd.DataFrame([auc], ['auc'], columns=None)

            sheet_name = "{}".format(key)
            with pdwriter as the_file:
                data.to_excel(the_file, sheet_name=sheet_name, index=False, startrow=0)
                # data2.to_excel(the_file, sheet_name=sheet_name, index=False, startcol=4, startrow=2)
                table.to_excel(the_file, sheet_name=sheet_name, startcol=12, startrow=7)
                table2.to_excel(the_file, sheet_name=sheet_name, startcol=12, startrow=11)


def execute_simple(filename):

    logs = logger.logging_setup('Execute_simple')

    data = pd.read_csv(filename)
    required_fields = {'domain_name', 'person_id', 'url_count', 'segment', 'category', 'subcategory'}
    missing = required_fields.difference(set(data.columns))
    if len(missing) > 0:
        missing_list = ", ".join(missing)
        logs.critical("Missing required fields. We require: {}".format(missing_list))
        sys.exit(0)
    c = Comparer(data, 'domain_name', 'url_count', 'segment', 300)
    c.export_report("output")


if __name__ == "__main__":

    logs = logger.logging_setup('root')

    if len(sys.argv) > 1:
        filename = sys.argv[1]
        execute_simple(filename)
    else:
        logs.critical("Please pass a filename to the script to run with default column names.")
        sys.exit(0)
Future Considerations
- Optimizing based on other parameters besides number of coefficients (Regularization Penalty value)
- Incorporating a python wrapper for the initial data pull
deck
By Patrick Nieto