聯課爬蟲教學
爬蟲?

no.
What it is?
-
搜尋引擎自動瀏覽、存取網頁的方式
-
自動化擷取網頁資料
常用模組
- Requests + Beautiful Soup / PyQuery
- Scrapy / Pyspider
- Selenium
Selenium
一個瀏覽器自動化的工具包
優點:
-
方便操作
-
可以進行登入、滑鼠滾動等操作
-
模擬瀏覽器訪問網站,不易被阻攔
缺點:
-
不是正式的爬蟲套件
-
比起正式爬蟲速度較慢
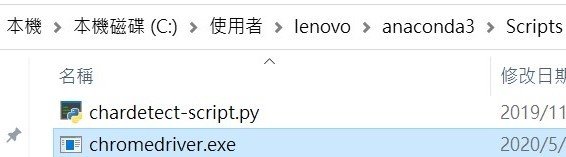
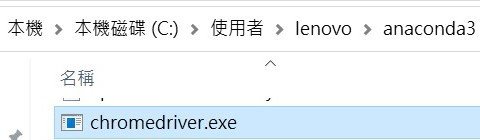
Setting Up
<Using anaconda>
安裝 Selenium
pip install SeleniumChromeDriver
安裝 Chromedriver
將Chrome driver放到以下位置
... > User > anaconda3 >
... > User > anaconda3 > Scripts
Basics
<Using jupyter notebook>
import Selenium 模組
from selenium import webdriver
WebDriver 可以驅動瀏覽器的應用程式
driver = webdriver.Chrome()
url = '想爬的網站網址'
driver.get(url)

#program

driver.quit()
建立爬蟲本體
Wait
給瀏覽器加載的時間
1. 強制等待
import timedriver = webdriver.Chrome()
url = '想爬的網站網址'
driver.get(url)
sleep(10)
#program
driver.quit()-
較死板
-
浪費多餘的時間
意思
到指定的秒數之前都不要執行下一行程式
2. 隱性等待
driver = webdriver.Chrome()
driver.implicity_wait(30)
url = '想爬的網站網址'
driver.get(url)

#program

driver.quit()
意思
到指定的秒數之前,
如果網頁加載完畢即馬上執行下一行程式
否則如果超過時間,
即強制執行下一行程式
-
較彈性
-
可省下時間
3. 顯性等待
from selenium.webdriver.support.wait import WebDriverWait
from selenium.webdriver.support import expected_conditions as ec
from selenium.webdriver.common.by import By
driver = webdriver.Chrome()
driver.implicity_wait(30)
url = '想爬的網站網址'
driver.get(url)
locator = (By.Link_TEXT, '7122')
WebDriverWait(driver, 10).until(ec.presence_of_element_located(locator))
#program
driver.quit()意思
利用 until 與 until_not
靈活地檢查某項東西是否符合自定義的條件
如果條件符合,即繼續執行下一行程式
如果超過指定時間,
即強制執行下一行程式
語法
WebDriverWait(driver, 指定時間, 檢查頻率, 忽略異常).until(自定義條件, 超時返回的訊息)
WebDriverWait(driver, 指定時間, 檢查頻率, 忽略異常).until_not(自定義條件, 超時返回的訊息)
指定條件
selenium.webdriver.support.expected_conditions
以下兩個條件類驗證title,驗證傳入的參數title是否等於或包含於driver.title
title_is
title_contains

以下兩個條件驗證元素是否出現,傳入的參數都是元組類型的locator,如(By.ID, 'kw')
顧名思義,一個只要一個符合條件的元素加載出來就通過;另一個必須所有符合條件的元素都加載出來才行
presence_of_element_located
presence_of_all_elements_located

以下三個條件驗證元素是否可見,前兩個傳入參數是元組類型的locator,第三個傳入WebElement
第一個和第三個其實質是一樣的
visibility_of_element_located
invisibility_of_element_located
visibility_of

以下兩個條件判斷某段文本是否出現在某元素中,一個判斷元素的text,一個判斷元素的value
text_to_be_present_in_element
text_to_be_present_in_element_value

以下條件判斷frame是否可切入,可傳入locator元組或者直接傳入定位方式:id、name、index或WebElement
frame_to_be_available_and_switch_to_it

以下條件判斷是否有alert出現
alert_is_present

以下條件判斷元素是否可點擊,傳入locator
element_to_be_clickable

以下四個條件判斷元素是否被選中,第一個條件傳入WebElement對象,第二個傳入locator元組
第三個傳入WebElement對像以及狀態,相等返回True,否則返回False
第四個傳入locator以及狀態,相等返回True,否則返回False
element_to_be_selected
element_located_to_be_selected
element_selection_state_to_be
element_located_selection_state_to_be

最後一個條件判斷一個元素是否仍在DOM中,傳入WebElement對象,可以判斷頁面是否刷新了
staleness_of
要怎麼讓爬蟲動起來?
>> 讓他開始找東西
要怎麼讓他開始找東西?
>> Selector
HTML
<網頁原始碼視讀>
按下F12、
でこんなになる。
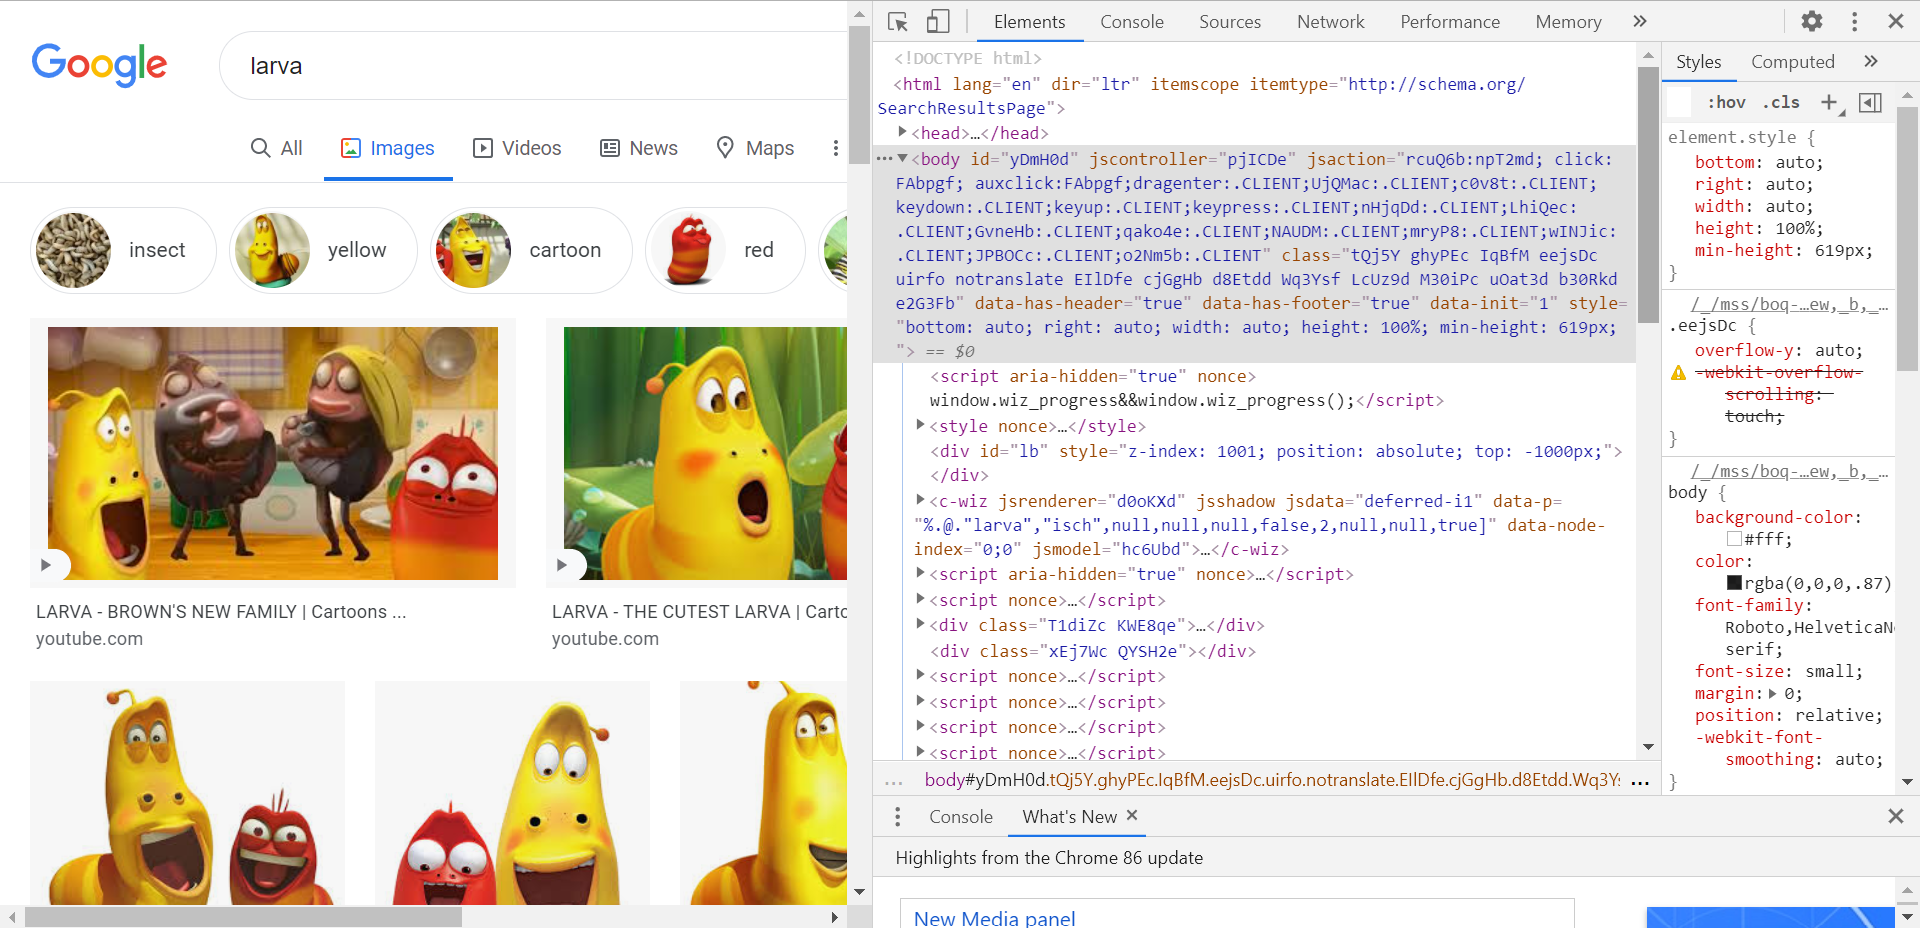
\(\uparrow\) 網頁原始碼
Selector
Xpath
<XML Path Language>
- 可在XML文檔中查找資料的語言
driver.find_element_by_xpath("object_xpath")Selector 語法
絕對 Xpath
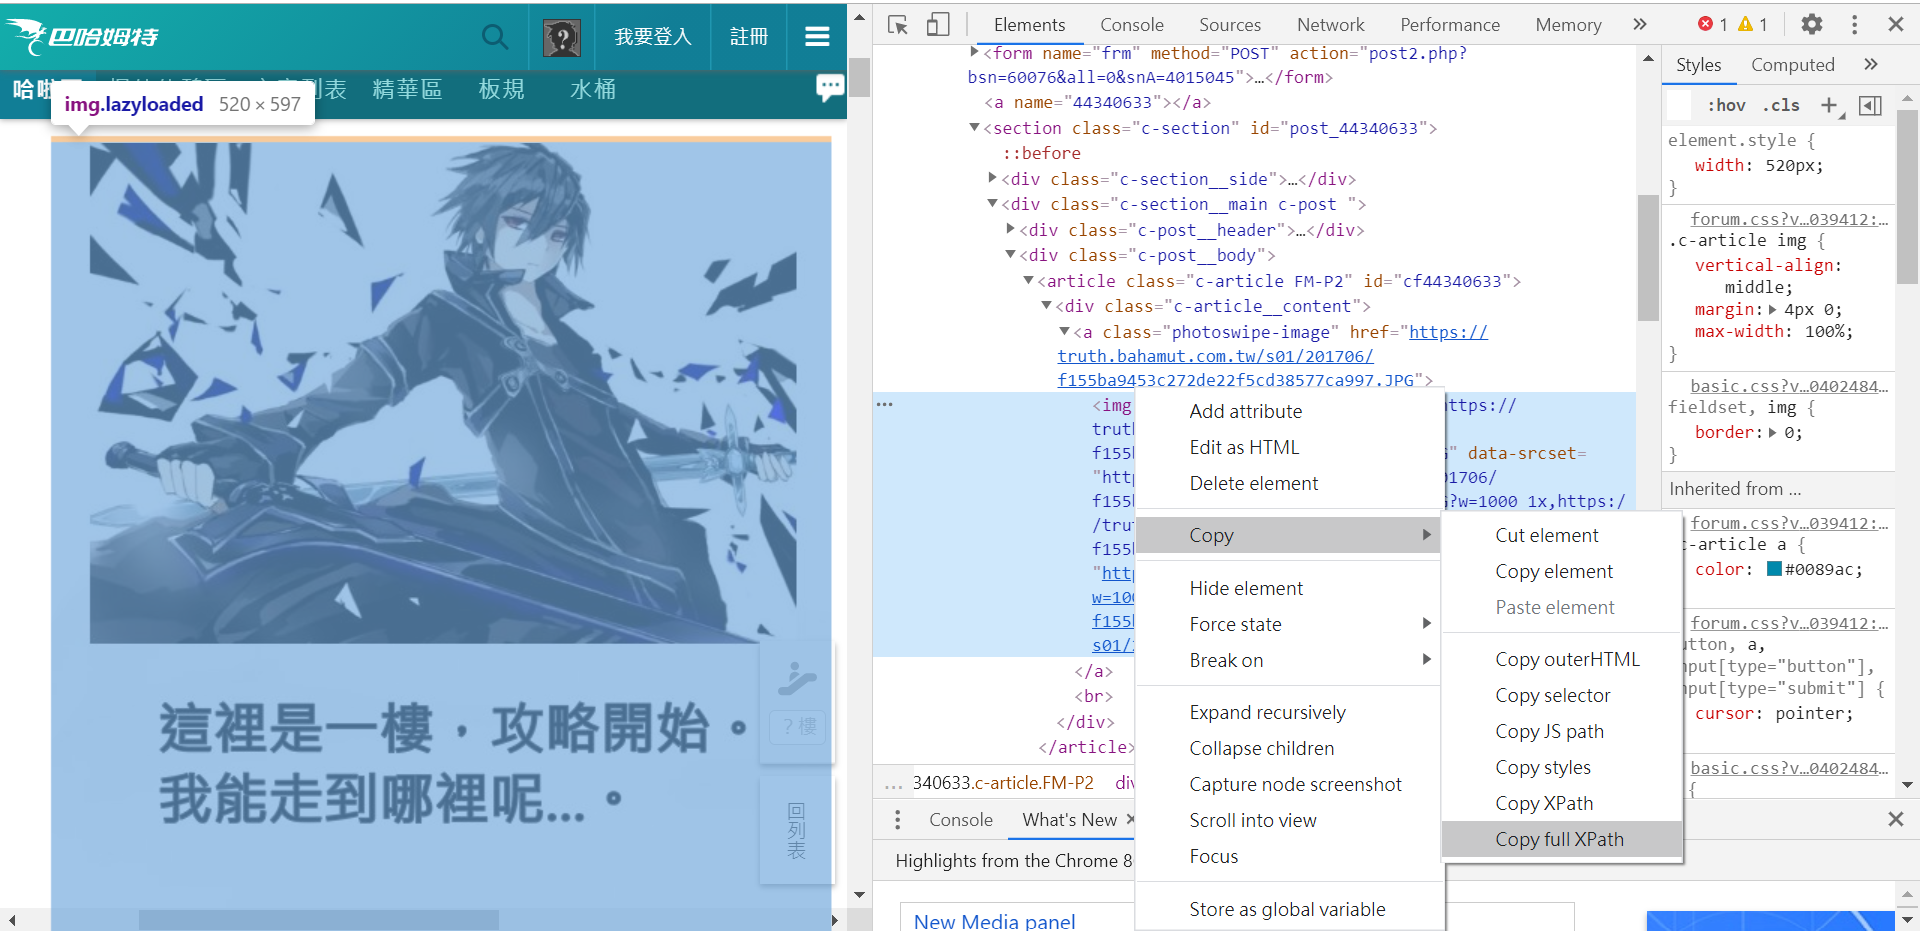
/html/body/div[5]/div/div[2]/section[2]/div[2]/div[2]/article/div/a/img
-
一個物件的位置全名
-
只適用於找固定物件
相對 Xpath
//*[@id="cf44340633"]/div/a/img
語法一覽:
- nodename 選取此節點的所有子節點
- / 從當前節點選取直接子節點
- // 從當前節點選取子孫節點
- . 選取當前節點
- .. 選取當前節點的父節點
- @ 選取屬性
[ ]: 對於物件的要求條件
測試 Xpath
- 打開chrome開發者工具(F12)
測試 Xpath
2. 選擇"console"
測試 Xpath
3. 輸入
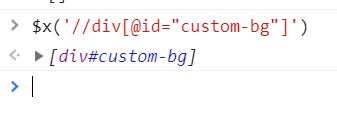
$x("your xpath here");註: 這是瀏覽器console的內建語法,而非javascript
如果有選到就會顯示在下方(廢話
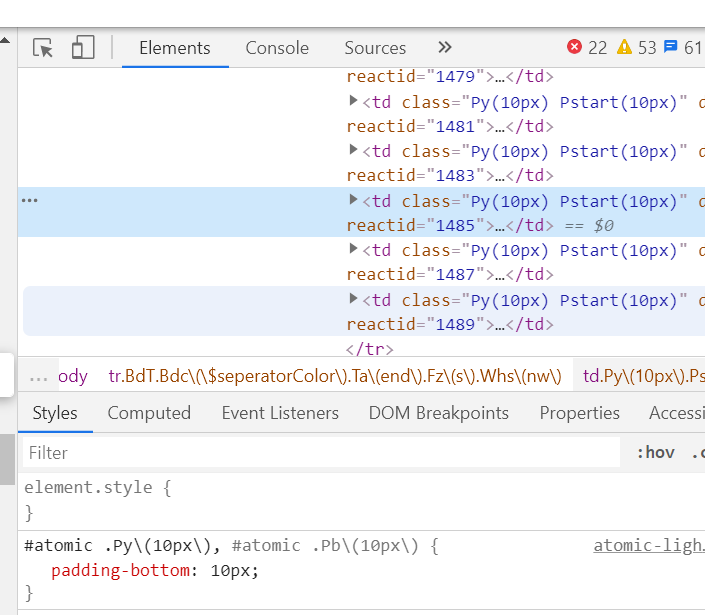
Css selector
- 比 Xpath 快0.1 ~ 0.3毫秒
- 官方所推薦的用法
- find_element_by_id(idName)
- find_element_by_class_name(className)
- find_element_by_tag_name(tag_name)
- find_element_by_css_selector(css)
實作前小練習

我全都要 !
1. 建立爬蟲本體
from selenium import webdriver
import os
import urllib
from urllib.request import urlopen

url = 'https://home.gamer.com.tw/creationDetail.php?sn=4660391'
driver = webdriver.Chrome()
driver.implicitly_wait(30)
driver.get(url)

#program
2. 找出圖片的xpath
pic_path = '//div[@class="MSG-list8C"]/div/div//img'
pic_links = driver.find_elements_by_xpath(pic_path)
3. 使用os建立資料夾
import osimg_folder = 'D:\\Sharky_imgs\\'
if not os.path.isdir(img_folder):
os.mkdir(img_folder)4. 使用 get_attribute() 找出圖片物件的 data-src
for i in range(len(pic_links)):
pic_src = pic_links[i].get_attribute('data-src')5. 使用 urllib 下載圖片
import urllibtry:
urllib.request.urlretrieve(pic_src, img_folder + str(i+1) + '.jpg')
except:
pass6. 關掉瀏覽器
driver.quit()完成 !
from selenium import webdriver
import os
import urllib
url = 'https://home.gamer.com.tw/creationDetail.php?sn=4660391'
driver = webdriver.Chrome()
driver.implicitly_wait(30)
driver.get(url)
pic_path = '//div[@class="MSG-list8C"]/div/div//img'
pic_links = driver.find_elements_by_xpath(pic_path)
img_folder = 'D:\\Sharky_imgs\\'
if not os.path.isdir(img_folder):
  os.mkdir(img_folder)
for i in range(len(pic_links)):
    pic_src = pic_links[i].get_attribute('data-src')
print(pic_src)
try:
  urllib.request.urlretrieve(pic_src, img_folder + str(i+1) + '.jpg')
except:
  pass
driver.quit()實作 time!
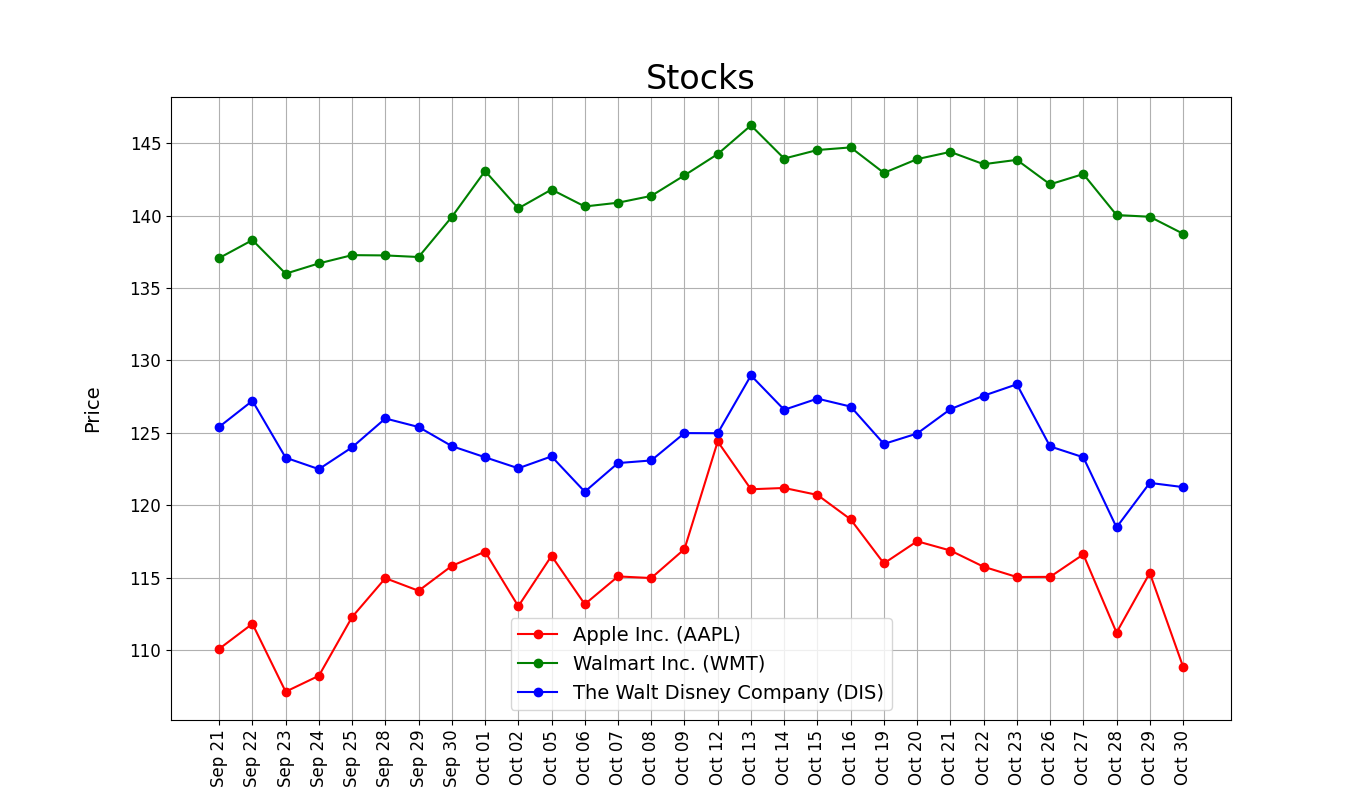
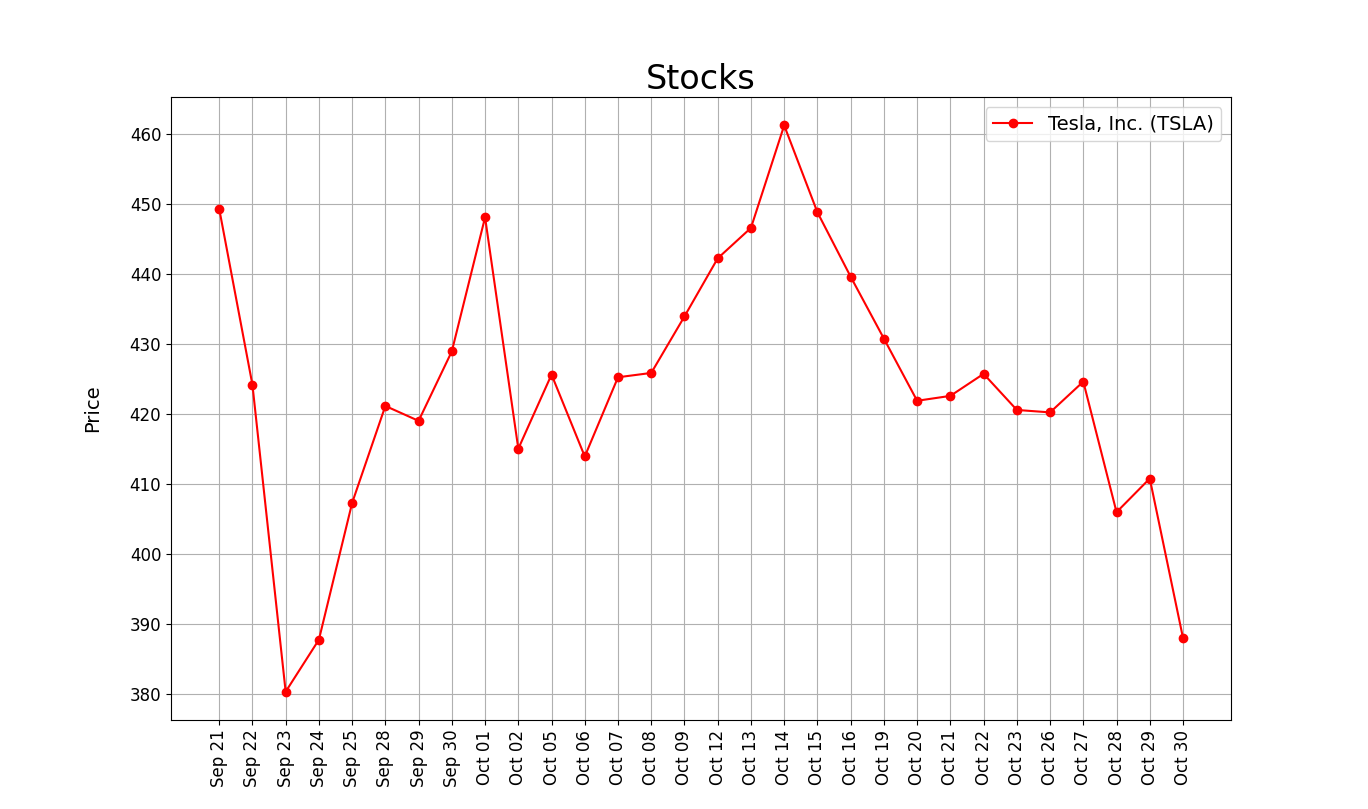
練習I. Stocks
Stocks!
用網頁中數據繪製折線圖
0. 觀察網頁
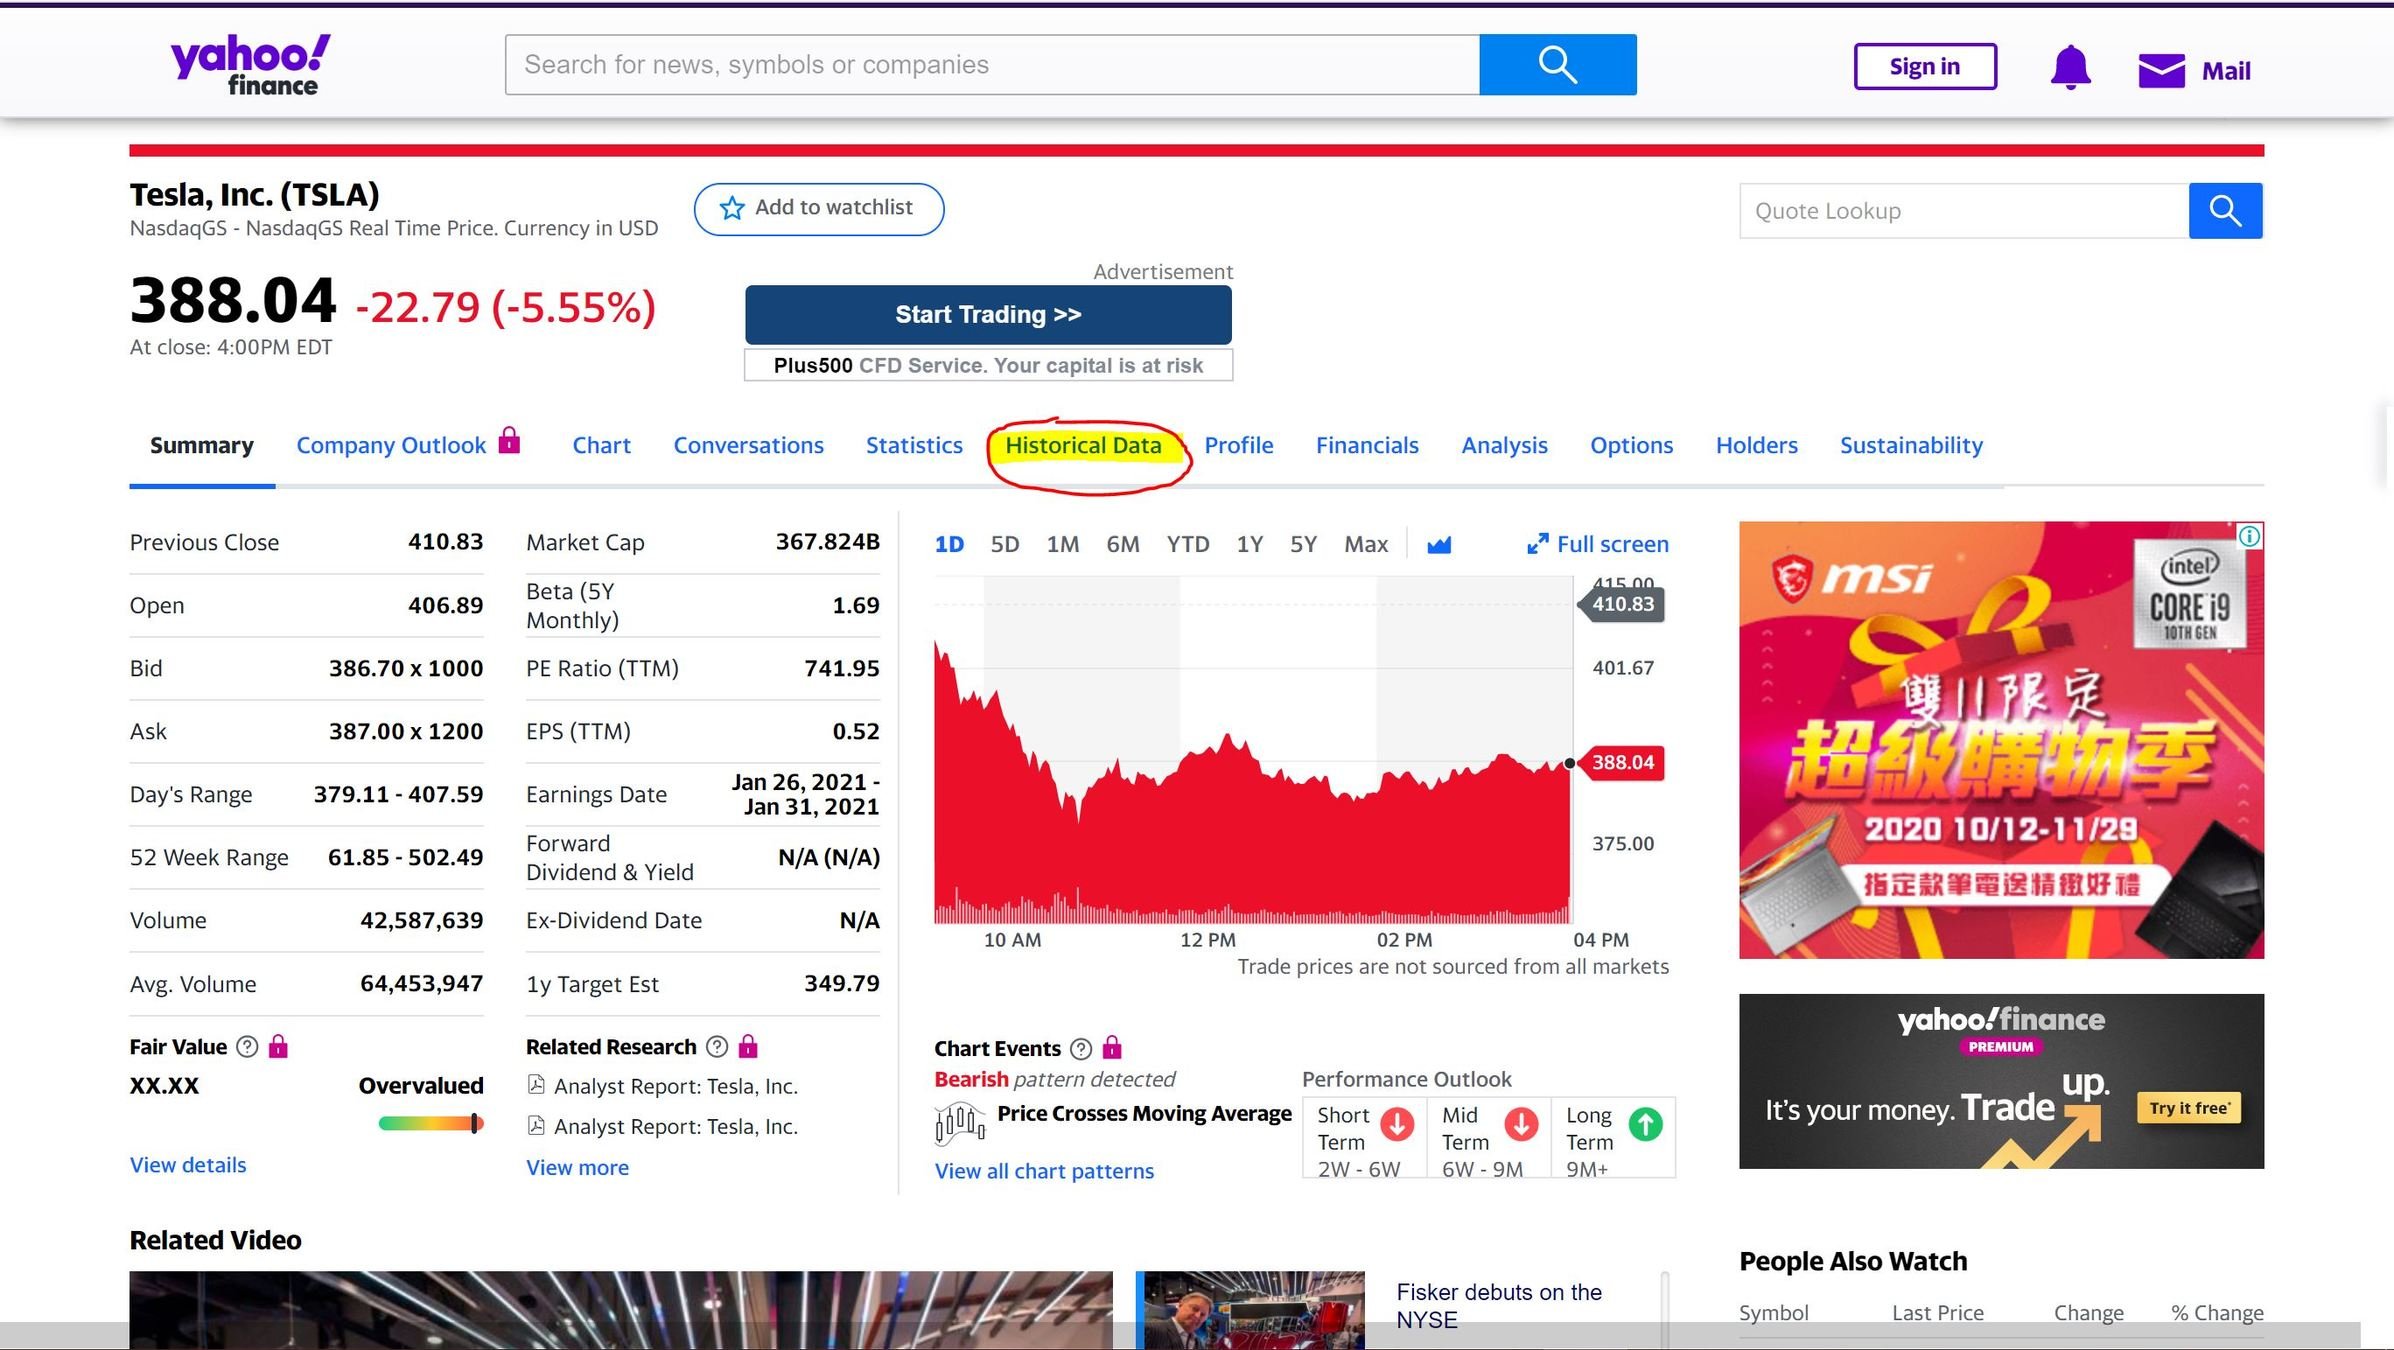
->數據都在 Historical Data 頁面
0. 觀察網頁
->數據都在 Historical Data 頁面
0. 觀察網頁
->數據都在 Historical Data 頁面
0. 觀察網頁
->數據都在 Historical Data 頁面
1. 建立爬蟲本體
from selenium import webdriver
driver = webdriver.Chrome()
url = "https://finance.yahoo.com/quote/TSLA/history?p=TSLA"
driver.implicitly_wait(30)
driver.get(url)
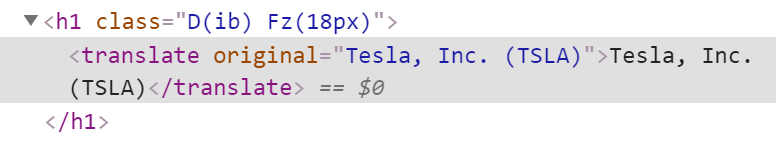
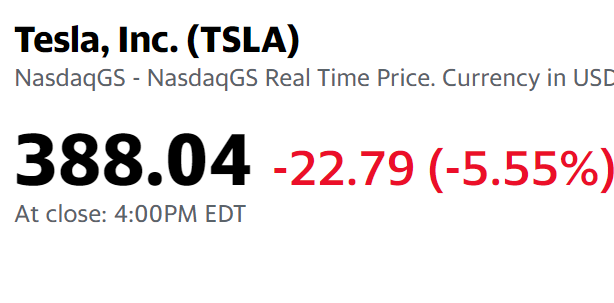
driver.close() #結束前關閉瀏覽器2. 選取標題
title = driver.find_element_by_tag_name("h1")
print(title.text) #title 是Selenium 物件 .text取得文字
標題在<h1>標籤中,
可利用 CSS Selector 的 find_element_by_tag_name
3. 選取股價
price = driver.find_element_by_xpath("//section/div[2]/table/tbody/tr[1]/td[5]")
print(price.text)
使用 Close*欄數據繪製圖表
找到這一欄的位置 複製 X-Path:
“/html/body/div[1]/div/div/div[1]/div/div[3]/div[1]/div/div[2]/section/div[2]/table/tbody/tr[1]/td[5]”
簡化成: //section/div[2]/table/tbody/tr[1]/td[5]”
4. 選取多筆股價
prices = []
for i in range(1,31):
    # get price
    price = driver.find_element_by_xpath(f"//section/div[2]/table/tbody/tr[{i}]/td[5]/span")
    daily_price = price.text
    daily_price = float(daily_price)
    prices.insert(0, daily_price)
使用迴圈取得30日內的所有股價
改變tr,取得每一列的資料
並把資料放到list中
5. 選取日期
dates = []
for i in range(1,31):
    # get date
    date_elem = driver.find_element_by_xpath(f"//section/div[2]/table/tbody/tr[{i}]/td[1]/span")
    date = date_elem.text
    dates.insert(0, date)
跟股價的方式一樣
但把xpath最後的td(欄位)改成第1欄
第一部分完成!
options = webdriver.ChromeOptions()
options.add_argument("--headless")
driver = webdriver.Chrome(options=options)

url = "https://finance.yahoo.com/quote/TSLA/history?p=TSLA"
driver.implicitly_wait(30)
driver.get(url)
★ 可以在 Web Driver 加入 --headless 參數
畫圖
0. 套件安裝
pip install matplotlibimport matplotlib.pyplot as plt
1. 畫線
plt.plot(dates,prices,color="red",marker="o",label=title.text)

plt.show()
plot 前兩個參數是橫軸數據&縱軸數據
型態是list
2. 設定標題、座標軸標示
x軸標示建議垂直顯示,避免重疊
plt.title("Stocks",fontsize=24)
plt.xticks(fontsize=12, rotation='vertical')
plt.yticks(fontsize=12)
plt.xlabel('Day',fontsize=14,labelpad=20)
plt.ylabel('Price',fontsize=14,labelpad=20)
3.添加格線、圖例
plt.legend(loc="best",fontsize=14) #add legend
plt.grid(True) #add grids
plt.show()
完成圖表
練習一
★字串需額外處理
    daily_price = price.text
    try:
        daily_price=float(daily_price)
    except:
        daily_price = daily_price[:-7] + daily_price[-6:-1]
練習二
修改程式,讓它能輸入三個公司的代碼後
把三個公司的股價畫在同一張圖
★網址格式化
★用list存lists
companies = [input("Company 1:"),input("Company 2:"),input("Company 1:")] #set search targets#
#companies = ["AMZN","GOOG","AAPL"]
titles = []
all_prices = []
all_dates = []
for elem in companies:
    # get url
    url = f"https://finance.yahoo.com/quote/{elem}/history?p={elem}"

    #Your code...
GOOG AMZN DIS
完整版
from selenium import webdriver
import matplotlib.pyplot as plt
#settings
options = webdriver.ChromeOptions()
options.add_argument("--headless")
driver = webdriver.Chrome(options=options)

companies = [input("Company 1:"),input("Company 2:"),input("Company 3:")] #set search targets
titles = []
all_prices = []
all_dates = []
for elem in companies:
    # get url
    url = f"https://finance.yahoo.com/quote/{elem}/history?p={elem}"
    driver.implicitly_wait(30)
    driver.get(url)

    #get stock title
    title_tag = driver.find_element_by_xpath('//*[@id="quote-header-info"]/div[2]/div[1]/div[1]/h1')
    titles.append(title_tag.text)

    dates = []
    prices = []
    for i in range(30):
        #get date
        date_tag = driver.find_element_by_xpath(f"//section/div[2]/table/tbody/tr[{i+1}]/td[1]/span")
        date = date_tag.text
        date = date[:-6]  # (remove the year)
        dates.insert(0,date)

        # get price
        price = driver.find_element_by_xpath(f"//section/div[2]/table/tbody/tr[{i+1}]/td[5]/span")
        daily_price = price.text
        try:
            daily_price=float(daily_price)
        except:
            daily_price = daily_price[:-7] + daily_price[-6:-1]
            daily_price=float(daily_price)
        prices.insert(0,daily_price)

    all_dates.append(dates)
    all_prices.append(prices)
driver.close()

# draws three lines
plt.plot(all_dates[0],all_prices[0],color="red",marker="o",label=titles[0])
plt.plot(all_dates[1],all_prices[1],color="green",marker="o",label=titles[1])
plt.plot(all_dates[2],all_prices[2],color="blue",marker="o",label=titles[2])


plt.title("Stocks",fontsize=24) #set title
plt.xticks(fontsize=12, rotation='vertical')#set x axis
plt.yticks(fontsize=12 )#set y axis
plt.xlabel('Day',fontsize=14,labelpad=20)
plt.ylabel('Price',fontsize=14,labelpad=20)
plt.legend(loc="best",fontsize=14) #add legend
plt.grid(True,axis="y") #add grids
plt.show()
練習三
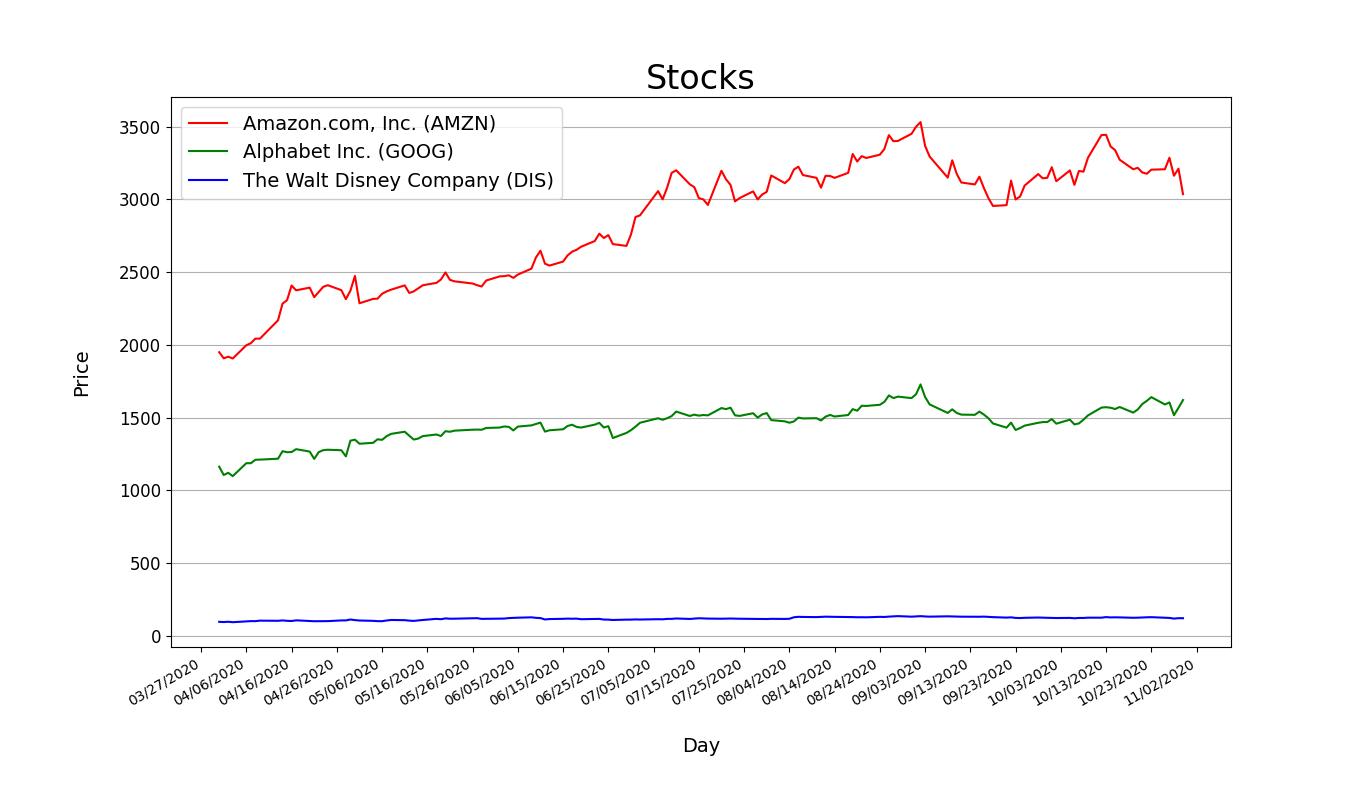
擷取150天內數據
Yahoo Stocks - Tesla
★滑鼠滾輪控制
★可移除--headless參數,方便觀察
driver.execute_script("window.scrollTo(0, Y)")
    driver.execute_script("window.scrollTo(0, 10000)")
    time.sleep(1)
    for i in range(150):
      #Your Code...
X軸太擠了
import matplotlib.dates as mdates
from datetime import datetime
def mon_to_num(month):
MON2NUM={
"Jan":"01",
"Feb":"02",
"Mar":"03",
"Apr":"04",
"May":"05",
"Jun":"06",
"Jul":"07",
"Aug":"08",
"Sep":"09",
"Oct":"10",
"Nov":"11",
"Dec":"12"
}
return MON2NUM.get(month,"")
def format_date(str):
new = mon_to_num(str[:-9])+"/"+str[-8:-6]+"/"+str[-4:]
return newxs = [datetime.strptime(d,'%m/%d/%Y').date() for d in dates]
plt.gca().xaxis.set_major_formatter(mdates.DateFormatter('%m/%d/%Y'))
plt.gca().xaxis.set_major_locator(mdates.DayLocator(interval=10))
plt.gcf().autofmt_xdate()把日期轉換成datetime格式
並利用matplotlib的套件控制出現頻率
Full Version
from selenium import webdriver
import matplotlib.pyplot as plt
import matplotlib.dates as mdates
from datetime import datetime
import time

def mon_to_num(str):
    if str=="Jan":   return "01"
    elif str=="Feb": return "02"
    elif str=="Mar": return "03"
    elif str=="Apr": return "04"
    elif str=="May": return "05"
    elif str=="Jun": return "06"
    elif str=="Jul": return "07"
    elif str=="Aug": return "08"
    elif str=="Sep": return "09"
    elif str=="Oct": return "10"
    elif str=="Nov": return "11"
    elif str=="Dec": return "12"
def format_date(str):
    new = mon_to_num(str[:-9])+"/"+str[-8:-6]+"/"+str[-4:]
    return new
#settings
options = webdriver.ChromeOptions()
options.add_argument("--headless")
driver = webdriver.Chrome(options=options)

#companies = [input("Company 1:"),input("Company 2:"),input("Company 1:")] #set search targets#
companies = ["AMZN","GOOG","DIS"]
titles = []
all_prices = []
dates = []
for elem in companies:
    # get url
    url = f"https://finance.yahoo.com/quote/{elem}/history?p={elem}"
    driver.implicitly_wait(30)
    driver.get(url)

    #get stock title
    title_tag = driver.find_element_by_tag_name("h1")
    titles.append(title_tag.text)

    prices = []
    driver.execute_script("window.scrollTo(0, 10000)")
    time.sleep(1)
    dates.clear()
    for i in range(150):
        #time.sleep((random.randint(0,100))/1000)
        #get date
        date_tag = driver.find_element_by_xpath(f"//section/div[2]/table/tbody/tr[{i+1}]/td[1]/span")
        date = date_tag.text
        date = format_date(date)
        dates.insert(0,date)

        # get price
        price = driver.find_element_by_xpath(f"//section/div[2]/table/tbody/tr[{i+1}]/td[5]/span")
        daily_price = price.text
        try:
            daily_price=float(daily_price)
        except:
            daily_price = daily_price[:-7] + daily_price[-6:-1]
            daily_price=float(daily_price)
        prices.insert(0,daily_price)
    all_prices.append(prices)
driver.close()

xs = [datetime.strptime(d,'%m/%d/%Y').date() for d in dates]
plt.gca().xaxis.set_major_formatter(mdates.DateFormatter('%m/%d/%Y'))
plt.gca().xaxis.set_major_locator(mdates.DayLocator(interval=15))
plt.gcf().autofmt_xdate()

plt.plot(xs,all_prices[0],color="red",label=titles[0])
plt.plot(xs,all_prices[1],color="green",label=titles[1])
plt.plot(xs,all_prices[2],color="blue",label=titles[2])

plt.title("Stocks",fontsize=24) #set title
plt.xticks(fontsize=12,rotation="vertical")#set x axis
plt.yticks(fontsize=12 )#set y axis
plt.xlabel('Day',fontsize=14,labelpad=20)
plt.ylabel('Price',fontsize=14,labelpad=20)
plt.legend(loc="best",fontsize=14) #add legend
plt.grid(b=True,axis="y") #add grids
plt.show()
Better Version(把程式包成函數)
from selenium import webdriver
from selenium.webdriver.support import expected_conditions as EC
from selenium.webdriver.support.wait import WebDriverWait
from selenium.webdriver.common.by import By
import matplotlib.pyplot as plt
import matplotlib.dates as mdates
from datetime import datetime
import time
import re

COLORS=['red','green','blue']
def getColor(i):
    return COLORS[i%len(COLORS)]
MON2NUM={
    "Jan":"01",
    "Feb":"02",
    "Mar":"03",
    "Apr":"04",
    "May":"05",
    "Jun":"06",
    "Jul":"07",
    "Aug":"08",
    "Sep":"09",
    "Oct":"10",
    "Nov":"11",
    "Dec":"12"
}
def mon_to_num(month):
    return MON2NUM.get(month,"")
def format_date(date_text):
    return '/'.join([mon_to_num((x:=re.split(', | ',date_text))[0])]+x[1:])


def generate(*companies):
    # settings
    options = webdriver.ChromeOptions()
    # options.add_argument("--headless")
    driver = webdriver.Chrome(options=options)
    driver.implicitly_wait(30)
    titles = {}
    all_prices = {}
    prices = {}
    for company in companies:
        # get url
        url = f"https://finance.yahoo.com/quote/{company}/history?p={company}"
        driver.get(url)

        # get stock title
        title_tag = driver.find_element_by_tag_name("h1")
        titles[company] = title_tag.text

        driver.execute_script("window.scrollTo(0, 10000)")
        prices.clear()
        for i in range(150):
            # time.sleep((random.randint(0,100))/1000)

            xpath=f"//section/div[2]/table/tbody/tr[{i + 1}]"
            try:
              WebDriverWait(driver,2,0.01).until(EC.presence_of_element_located((By.XPATH,xpath)))
            except:
              pass

            # get date
            date_tag = driver.find_element_by_xpath(xpath+"/td[1]/span")
            date = format_date(date_tag.text)

            # get price
            price = driver.find_element_by_xpath(xpath+"/td[5]/span")
            daily_price = price.text
            daily_price = float(daily_price.replace(',',''))

            prices[date] = daily_price

        all_prices[company]=prices.copy()

    driver.close()

    getDates = lambda dates: [datetime.strptime(d, '%m/%d/%Y').date() for d in dates]
    plt.gca().xaxis.set_major_formatter(mdates.DateFormatter('%m/%d/%Y'))
    plt.gca().xaxis.set_major_locator(mdates.DayLocator(interval=10))
    plt.gcf().autofmt_xdate()
    for i,company in enumerate(companies):
        plt.plot(getDates(all_prices[company].keys()), all_prices[company].values(), color=getColor(i), label=titles[company])
    plt.title("Stocks", fontsize=24)  # set title
    plt.xticks(fontsize=12,rotation="vertical")#set x axis
    plt.yticks(fontsize=12)  # set y axis
    plt.xlabel('Day', fontsize=14, labelpad=20)
    plt.ylabel('Price', fontsize=14, labelpad=20)
    plt.legend(loc="best", fontsize=14)  # add legend
    plt.grid(b=True, axis="y")  # add grids

    plt.show()
generate("AMZN", "GOOG", "DIS")
練習II. Stonks

a new way to view webcrawling
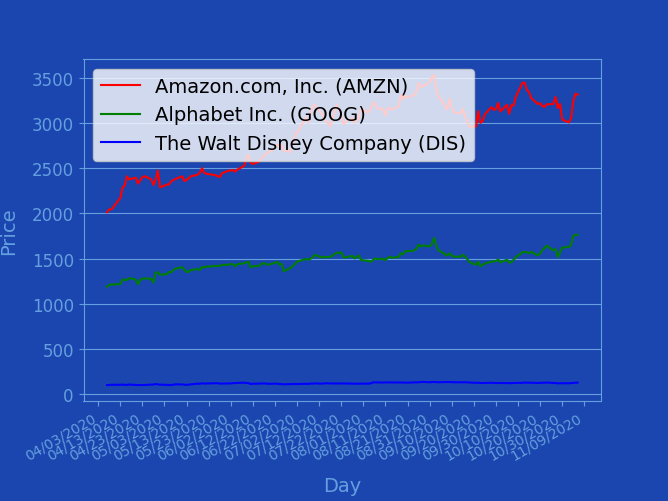
輸出圖表成圖片
plt.savefig("stocks.png")plt.show() (顯示圖表)會把畫好的圖表洗掉,故不要執行這行
或是在這行之前先執行plt.savefig()
似乎需要修改......
調整顏色,把圖表畫得像meme
getDates = lambda dates: [datetime.strptime(d, '%m/%d/%Y').date() for d in dates]
plt.figure(figsize=(6.68,5.02),facecolor='#1B46AF')
axis = plt.gca()
axis.set_facecolor('#1B46AF')
xaxis = plt.gca().xaxis
xaxis.set_major_formatter(mdates.DateFormatter('%m/%d/%Y'))
xaxis.set_major_locator(mdates.DayLocator(interval=10))
for spine in axis.spines.values():
    spine.set_color('#649FDF')
plt.gcf().autofmt_xdate()
for i,company in enumerate(companies):
    plt.plot(getDates(all_prices[company].keys()), all_prices[company].values(), color=getColor(i), label=titles[company])
# plt.title("Stocks", fontsize=24, color="#649FDF")  # set title
plt.yticks(fontsize=12)  # set y axis
xlabel = plt.xlabel('Day', fontsize=14, labelpad=10)
ylabel = plt.ylabel('Price', fontsize=14, labelpad=10)
xlabel.set_color('#649FDF')
ylabel.set_color('#649FDF')
plt.legend(loc="upper right", fontsize=14) # add legend
plt.grid(b=True, axis="y")  # add grids
plt.tick_params(color="#649FDF",labelcolor="#649FDF",grid_color='#649FDF')
記得刪掉標題!
記得調整圖片大小!
記得調整圖示位置!
新的輸出圖片><
再建立新的python檔案,此處稱之為"meme_factory.py"
並把剛剛生成圖表的檔案稱為"get_stock_graph.py"
#meme_factory.py

import get_stock_graph
匯入剛剛的檔案><
就可以在這個檔案執行剛剛爬蟲
並生成圖片的程式!
可以執行看看剛剛包成函數的程式!
get_stock_graph.generate("AMZN", "GOOG", "DIS")修但幾勒
如何處理圖片?
當然要用
Pillow
aka PIL
aka Python Imaging Library
匯入Pillow
匯入剛剛的圖表(.png)
from PIL import ImageimageA = Image.open('stocks.png')
imageA = imageA.convert('RGBA')
widthA , heightA = imageA.size匯入meme man
imageB = Image.open('mememan.png')
imageB = imageB.convert('RGBA')
widthB , heightB = imageB.size但meme man的寬度要是整體(背景)的一半
寬高比例又不能變OAO
newWidthB = int(widthA/2)
newHeightB = int(heightB/widthB*newWidthB)
imageB_resize = imageB.resize((newWidthB, newHeightB))建立新的圖片
resultPicture = Image.new('RGBA', imageA.size, (0, 0, 0, 0))
resultPicture.paste(imageA,(0,0))把背景(折線圖)貼上去
right_bottom = (0, heightA - newHeightB)
resultPicture.paste(imageB_resize, right_bottom, imageB_resize)把調整尺寸之後的meme man貼上去
from PIL import ImageDraw, ImageFont來寫字吧
先匯入模組
font = ImageFont.truetype('arial.ttf', 90, encoding='utf-8')載入字體(字型,大小,編碼)
canvas = ImageDraw.Draw(resultPicture)建立畫布(v畫筆)!
text_position = (widthA/2 +20, heightA/2 +20)
text_color = (255,255,255,255) #color in RGBA
stroke_color = (0,0,0,255) #color in RGBA文字位置、顏色(RGBA)
canvas.text(text_position,
"stonks",
fill=text_color,
font=font,
stroke_width=2,
stroke_fill=stroke_color)把字寫上去!!!
resultPicture.save("stonks.png")輸出圖片!
完整code(get_stock_graph.py)
from selenium import webdriver
from selenium.webdriver.support import expected_conditions as EC
from selenium.webdriver.support.wait import WebDriverWait
from selenium.webdriver.common.by import By
import matplotlib.pyplot as plt
import matplotlib.dates as mdates
from datetime import datetime
import os
import re
COLORS=['red','green','blue','yellow','purple']
def getColor(i):
return COLORS[i%len(COLORS)]
MON2NUM={
"Jan":"01",
"Feb":"02",
"Mar":"03",
"Apr":"04",
"May":"05",
"Jun":"06",
"Jul":"07",
"Aug":"08",
"Sep":"09",
"Oct":"10",
"Nov":"11",
"Dec":"12"
}
def mon_to_num(month):
return MON2NUM.get(month,"")
def format_date(date_text):
return '/'.join([mon_to_num((x:=re.split(', | ',date_text))[0])]+x[1:])
def generate(*companies):
# settings
options = webdriver.ChromeOptions()
# options.add_argument("--headless")
driver = webdriver.Chrome(os.path.join(os.getcwd(), 'koronedriver.exe'), options=options)
driver.implicitly_wait(30)
titles = {}
all_prices = {}
prices = {}
for company in companies:
# get url
url = f"https://finance.yahoo.com/quote/{company}/history?p={company}"
driver.get(url)
# get stock title
title_tag = driver.find_element_by_tag_name("h1")
titles[company] = title_tag.text
driver.execute_script("window.scrollTo(0, 10000)")
prices.clear()
for i in range(150):
# time.sleep((random.randint(0,100))/1000)
xpath=f"//section/div[2]/table/tbody/tr[{i + 1}]"
try:
WebDriverWait(driver,2,0.01).until(EC.presence_of_element_located((By.XPATH,xpath)))
except:
pass
# get date
date_tag = driver.find_element_by_xpath(xpath+"/td[1]/span")
date = format_date(date_tag.text)
# get price
price = driver.find_element_by_xpath(xpath+"/td[5]/span")
daily_price = price.text
daily_price = float(daily_price.replace(',',''))
prices[date] = daily_price
all_prices[company]=prices.copy()
driver.close()
getDates = lambda dates: [datetime.strptime(d, '%m/%d/%Y').date() for d in dates]
plt.figure(figsize=(6.68,5.02),facecolor='#1B46AF')
axis = plt.gca()
axis.set_facecolor('#1B46AF')
xaxis = plt.gca().xaxis
xaxis.set_major_formatter(mdates.DateFormatter('%m/%d/%Y'))
xaxis.set_major_locator(mdates.DayLocator(interval=10))
for spine in axis.spines.values():
spine.set_color('#649FDF')
plt.gcf().autofmt_xdate()
for i,company in enumerate(companies):
plt.plot(getDates(all_prices[company].keys()), all_prices[company].values(), color=getColor(i), label=titles[company])
# plt.title("Stocks", fontsize=24, color="#649FDF") # set title
plt.yticks(fontsize=12) # set y axis
xlabel = plt.xlabel('Day', fontsize=14, labelpad=10)
ylabel = plt.ylabel('Price', fontsize=14, labelpad=10)
xlabel.set_color('#649FDF')
ylabel.set_color('#649FDF')
plt.legend(loc="upper right", fontsize=14) # add legend
plt.grid(b=True, axis="y") # add grids
plt.tick_params(color="#649FDF",labelcolor="#649FDF",grid_color='#649FDF')
plt.savefig("stocks.png")
# plt.show()完整code(meme_factory.py)
from PIL import Image, ImageDraw, ImageFont
import get_stock_graph
get_stock_graph.generate("AMZN", "GOOG", "DIS")
imageA = Image.open('stocks.png')
imageA = imageA.convert('RGBA')
widthA , heightA = imageA.size
imageB = Image.open('mememan.png')
imageB = imageB.convert('RGBA')
widthB , heightB = imageB.size
newWidthB = int(widthA/2)
newHeightB = int(heightB/widthB*newWidthB)

imageB_resize = imageB.resize((newWidthB, newHeightB))
resultPicture = Image.new('RGBA', imageA.size, (0, 0, 0, 0))
resultPicture.paste(imageA,(0,0))
right_bottom = (0, heightA - newHeightB)
resultPicture.paste(imageB_resize, right_bottom, imageB_resize)
#載入字體(字型,大小,編碼)
font = ImageFont.truetype('arial.ttf', 90, encoding='utf-8')
#建立畫布
canvas = ImageDraw.Draw(resultPicture)
text_position = (widthA/2 +20, heightA/2 +20)
text_color = (255,255,255,255) #color in RGBA
stroke_color = (0,0,0,255) #color in RGBA
canvas.text(text_position,
            "stonks",
            fill=text_color,
            font=font,
            stroke_width=2,
            stroke_fill=stroke_color)
resultPicture.save("stonks.png")(很爛的)輸出結果

待改進
- 橘色箭頭
- 文字光暈
- 3d旋轉背景(旋轉矩陣?)

練習III. 油圖

重點
img_links = driver.find_elements_by_xpath('//div[@class="center"]//img')
換個方法抓圖片
import time
import os
import urllib
from selenium import webdriver
from selenium.webdriver.common.keys import Keys
import requests

driver = webdriver.Chrome()
driver.implicitly_wait(30)
driver.get('https://wall.alphacoders.com/tags.php?tid=229')

img_folder = 'D:\\alpha_coders'

if not os.path.isdir(img_folder):
    os.mkdir(img_folder)

curr = int(1)
for i in range(1):
    img_links = driver.find_elements_by_xpath('//div[@class="center"]//img')

    for j in range(len(img_links)):
        if(j%2 == 0):
            img_url = img_links[j].get_attribute('src')
            r = requests.get(img_url)
            with open(img_folder  + '\\' + str(curr) + '.jpg', "wb") as handler:
                handler.write(r.content)
            curr += 1

driver.quit()
下一頁?
from selenium.webdriver.common.keys import Keysnextpage = driver.find_element_by_tag_name('body')
nextpage.send_keys(Keys.ARROW_RIGHT)import time
import os
import urllib
from selenium import webdriver
from selenium.webdriver.common.keys import Keys
import requests
#import urllib
#from urllib.request import urlopen
driver = webdriver.Chrome()
driver.implicitly_wait(30)
driver.get('https://wall.alphacoders.com/tags.php?tid=229')
img_folder = 'D:\\alpha_coders'
if not os.path.isdir(img_folder):
os.mkdir(img_folder)
curr = int(1)
for i in range(1):
img_links = driver.find_elements_by_xpath('//div[@class="center"]//img')
for j in range(len(img_links)):
if(j%2 == 0):
img_url = img_links[j].get_attribute('src')
r = requests.get(img_url)
with open(img_folder + '\\' + str(curr) + '.jpg', "wb") as handler:
handler.write(r.content)
curr += 1
nextpage = driver.find_element_by_tag_name('body')
nextpage.send_keys(Keys.ARROW_RIGHT)
driver.quit()最後の最後
-
隨網頁應變
-
不懂?查吧!
-
不要觸法> <
ありがとうございます!
聯課爬蟲教學
By phantom0174


