


Patrick Power
Economics PhD @ Boston University
Pandas DataFrame
Creating a DataFrame
Import the library
import pandas as pdCreate Dictionary
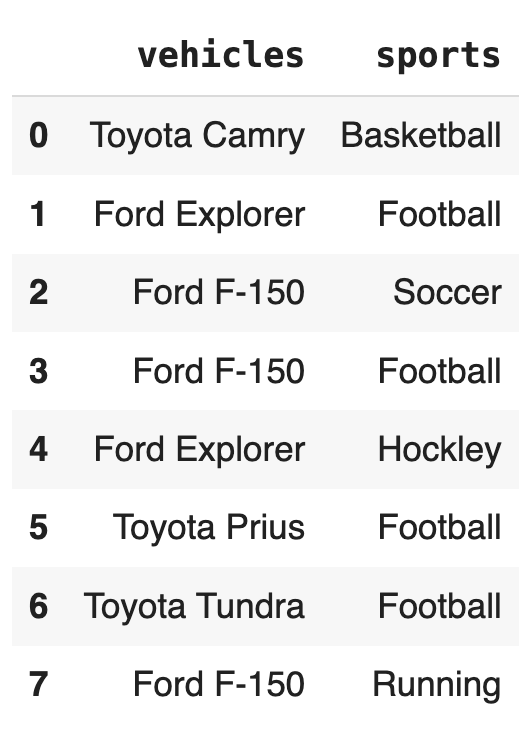
my_dict = {'vehicles': ['Toyota Camry', 'Ford Explorer', 'Ford F-150', 'Ford F-150', 'Ford Explorer', 'Toyota Prius', 'Toyota Tundra', 'Ford F-150'],
            'countries': ['USA', 'Canada', 'Ireland', 'Argentina', 'Ireland', 'Ireland', 'England', 'Ireland'],
            'sports': ['Basketball', 'Football', 'Soccer', 'Football', 'Hockley', 'Football', 'Football', 'Running']}
Create DataFrame
df = pd.DataFrame(my_dict)Visualizing a DataFrame
Show first `n` Rows
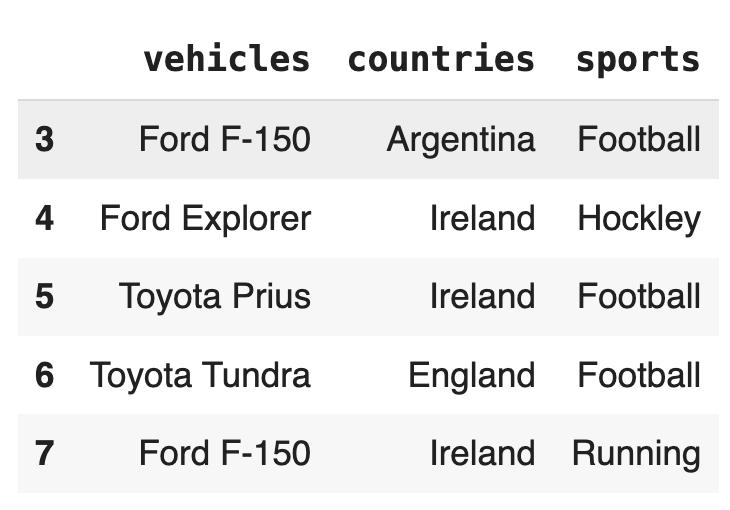
df.head(5)Show last `n` Rows
df.tail(5)Visualizing a DataFrame
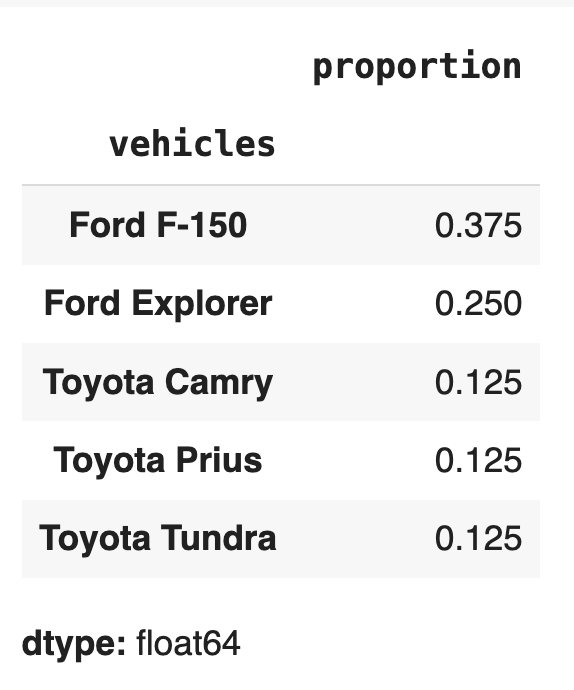
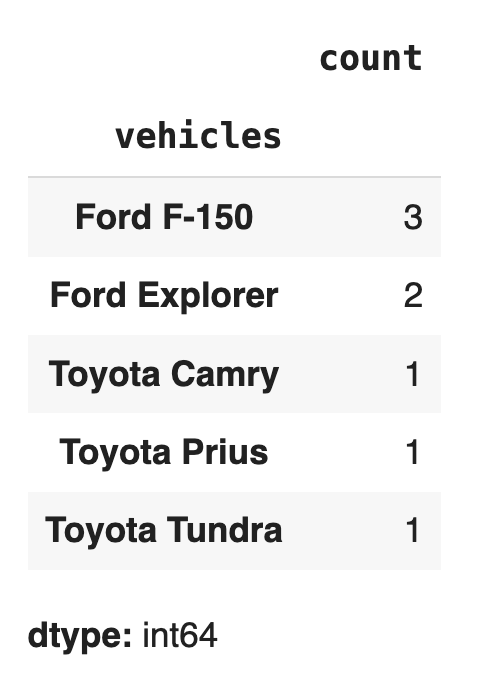
Frequency Table (Normalized)
df['countries'].value_counts(normalize=True)Frequency Table (Counts)
df['countries'].value_counts()Selecting Data From a DataFrame
Selecting a Row
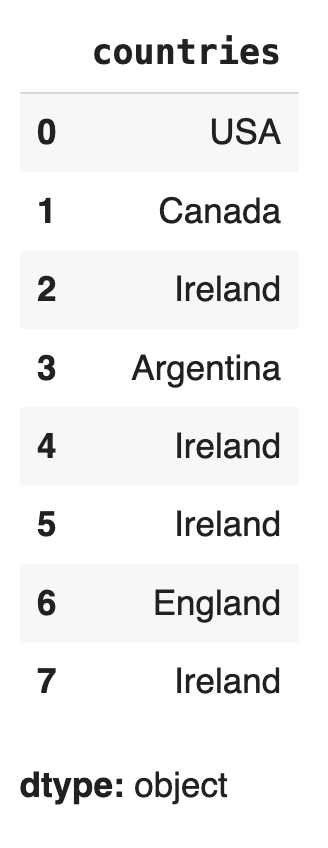
df.loc[0]Selecting a Column
df['countries']Selecting Data From a DataFrame
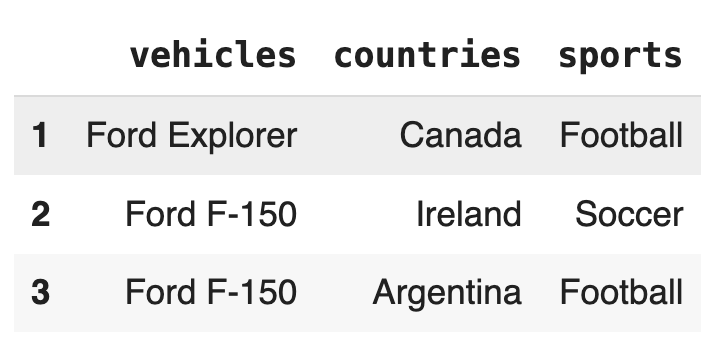
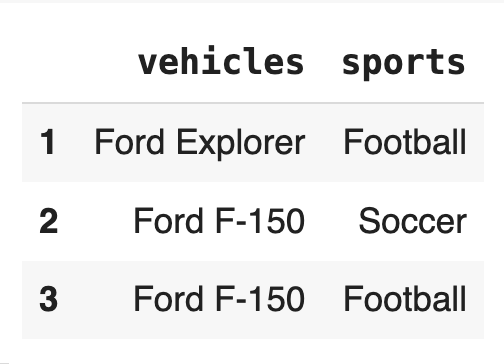
Selecting Multiple Rows
df.loc[1:3]Selecting Multiple Columns
df[['countries', 'sports']]Selecting Multiple Rows & Columns from a DataFrame
Selecting Multiple Rows and Columns
df.loc[1:3, ['vehicles', 'sports']]Check Your Understanding
What happens if we write:
new_df = df.loc[1:3, ['vehicle', 'sports']]
new_df.loc[0]
# Try `new_df.iloc[0]` afterWebsite:
Click to download this data
What Jumps out?
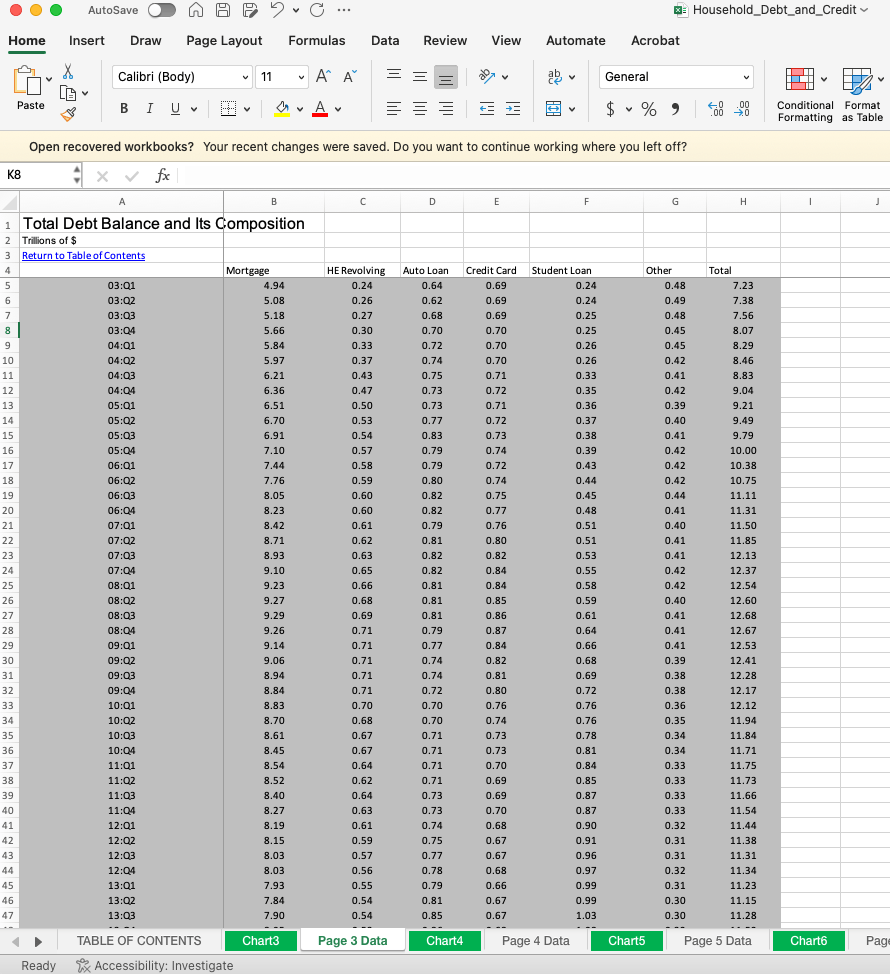
df = pd.read_excel(io='/content/business-analytics/datasets/Household_Debt_and_Credit.xlsx',
                   sheet_name='Page 3 Data',
                   skiprows=3)
Read In Data
The file path (String)
ioThe excel sheet (String)
sheet_nameThe number of rows to skip when reading in the data (Int)
skiprowsdf.head()Visualize the Dataset
df = df.rename(columns={'Unnamed: 0' : 'Period'})Rename a Column
Original Name
New Name
df.columnsAll Columns
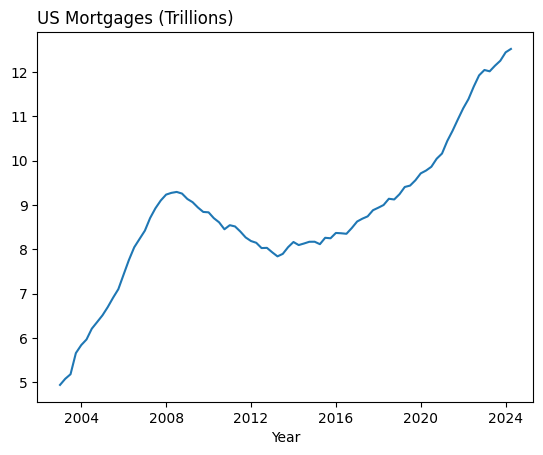
import matplotlib.pyplot as plt
plt.plot(df['Period'], df['Mortgage'])
plt.show()
Time Line Plot
Check Your Understanding
Using a for loop, create the following figure
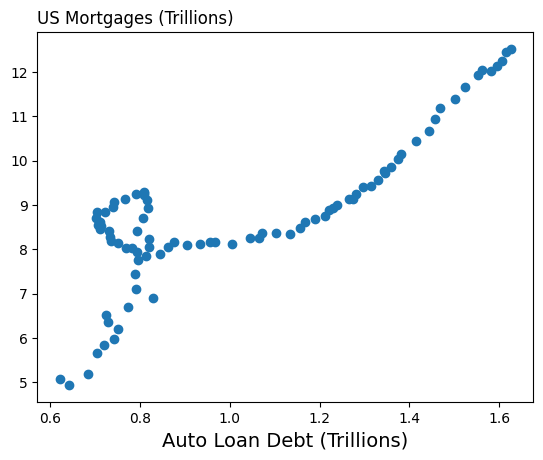
Scatter Plot
plt.scatter(df['Auto Loan'], df['Mortgage'])
plt.title('US Mortgages (Trillions)', loc='left')
plt.xlabel('Auto Loan Debt (Trillions)', size=14)
plt.show()
Correlation Coefficient
It’s a measure of how linearly related two variables are
Interpretation
Negative
Positive
Strong
Strong
Moderate
Moderate
Weak
Weak
Not
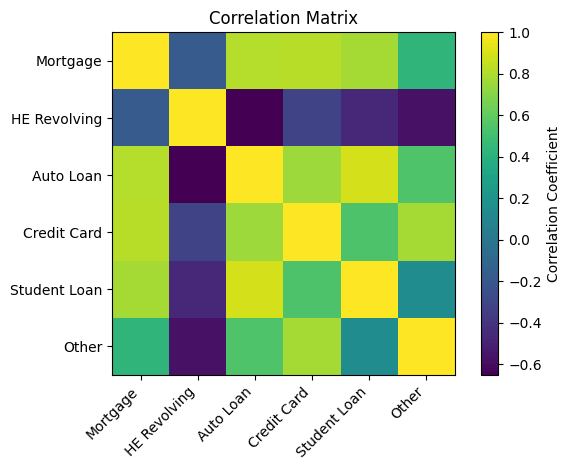
df['Auto Loan'].corr(df['Mortgage'])Check Your Understanding
Using a for loop, create the following figure
Frequency Table (Continuous Variables)
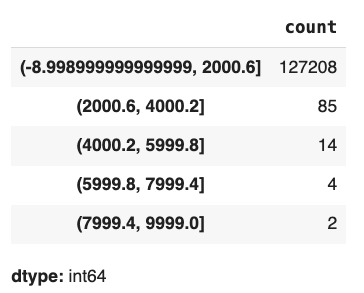
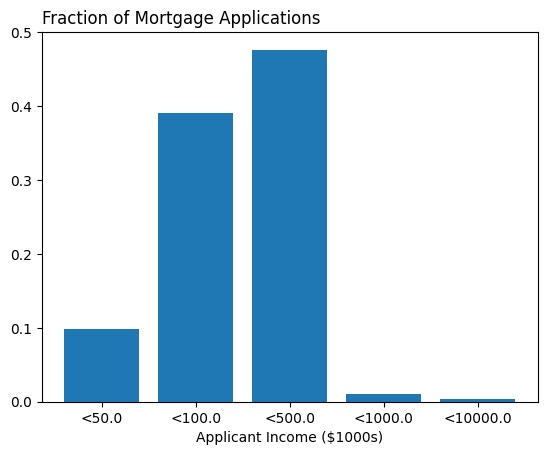
df['applicant_income_000s'].value_counts(bins=5)df['applicant_income_000s'].value_counts(bins=[0, 50, 100, 500, 1000, 10000])Bar Plot
New DataFrame
new_df = df['applicant_income_000s'].value_counts(normalize=True,
                                                  bins=[0, 50, 100, 500, 1000, 10000])
Bar Plot
plt.bar('<' + new_df.index.astype(str) , new_df.values)
plt.title('Fraction of Mortgage Applications', loc='left')
plt.xlabel('Applicant Income ($1000s)')
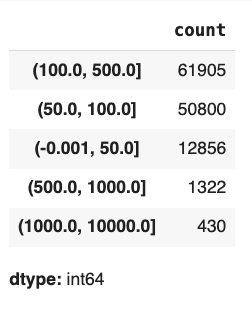
plt.show()new_df = df['applicant_income_000s'].value_counts(normalize=True,
bins=[0, 50, 100, 500, 1000, 10000])new_df.index = new_df.index.map(lambda x: x.right).sort_index()New Index
(Ignore this for the time being)
Filtering
Create a new data set that contains only loan types which are Conventional
Example
Process
(1) Create a Boolean Series
(2) Index the Data Frame with the Boolean Series
Boolean Series
df['loan_type_name'] == 'Conventional'Boolean Series
(df['loan_type_name'] == 'Conventional') & (df['loan_purpose_name'] == 'Home purchase')& # And
| # Or
~ # NotCheck Your Understanding
Create a boolean series that takes the value True if the agency_abbr is not HUD
Indexing a DataFrame
df[df['loan_type_name'] == 'Conventional']df.loc[df['loan_type_name'] == 'Conventional', 'property_type_name']Sorting
df.sort_values(by='loan_amount_000s')df.sort_values(by='loan_amount_000s', ascending=False)Groupby
df.groupby('loan_type_name')['loan_amount_000s'].mean()df.groupby('loan_type_name')['loan_amount_000s'].agg(['mean', 'median'])Groupby
lambda x: x**2df['normalized_loan_amount'] = df.groupby('loan_type_name')['loan_amount_000s'].transform(lambda x: (x - x.mean()) / x.std())def f(x):
return x**2
my_list = [0, 1, 2, 3, 4, 5]
new_list = []
for i in my_list:
new_list.append(f(i))
print(new_list)For Loops Revisited
my_list =
new_list =
def f(x):
return x**2For Loops Revisited
Map
map(f, my_list)`map`: Built-in Python Function
`f`: Function we want to call
`my_list`: List we want to apply the function to
def f(x):
  return x**2

my_list = [0, 1, 2, 3, 4, 5]
new_list = []
for i in my_list:
  new_list.append(f(i))
print(new_list)
For Loop
def f(x):
  return x**2
my_list = [0, 1, 2, 3, 4, 5]
new_list = list(map(f, my_list))
print(new_list)Map
def f(x, y):
return x + y**2
my_list = [0, 1, 2, 3, 4, 5]
new_list = []
ans = 0
for i in my_list:
ans = f(ans, i)
new_list.append(ans)
print(new_list)For Loops Revisited
Map
my_list =
new_list =
def f(x, y):
return x + y**2Kinds of Functions
Built-in
print()+Self-Made
def f(x):
return x**2Others
pd.read_csv()pd.read_excel()Temporary Functions
lambda x : x**2Example:
(lambda x : x**2)(4.)Define and Call the function on the same line
my_list = [0, 1, 2, 3, 4, 5]
new_list = list(map(lambda x: x**2, my_list))
print(new_list)Map & lambda
def f(x):
  return x**2

my_list = [0, 1, 2, 3, 4, 5]
new_list = list(map(f, my_list))
print(new_list)
Map
Map & lambda & Pandas
Transforming Columns to Create New Columns
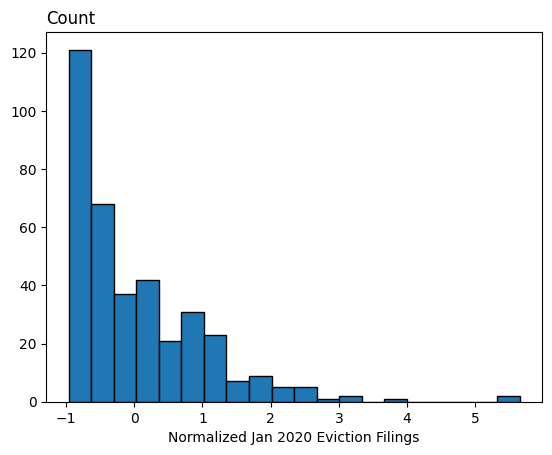
mean = df['Jan 2020'].mean()
std = df['Jan 2020'].std()

df['Normalized Jan 2020'] = df['Jan 2020'].apply(lambda x: (x-mean)/std)
Apply & Filtering & lambda
Let's say I want to keep only the observations with more than 50 eviction filings during Jan & February of 2020
(1)
Create a new column that is equal to the number of Eviction Filings during Jan-February of 2020
(2)
Filter based on this column
df['First_Five'] = df.apply(lambda row: row['Jan 2020'] + row['Feb 2020'], axis=1)
condition = df['First_Five'] > 50
new_df = df[condition]By Patrick Power


