


Patrick Power
Economics PhD @ Boston University
A Class Presentation of
Motivation
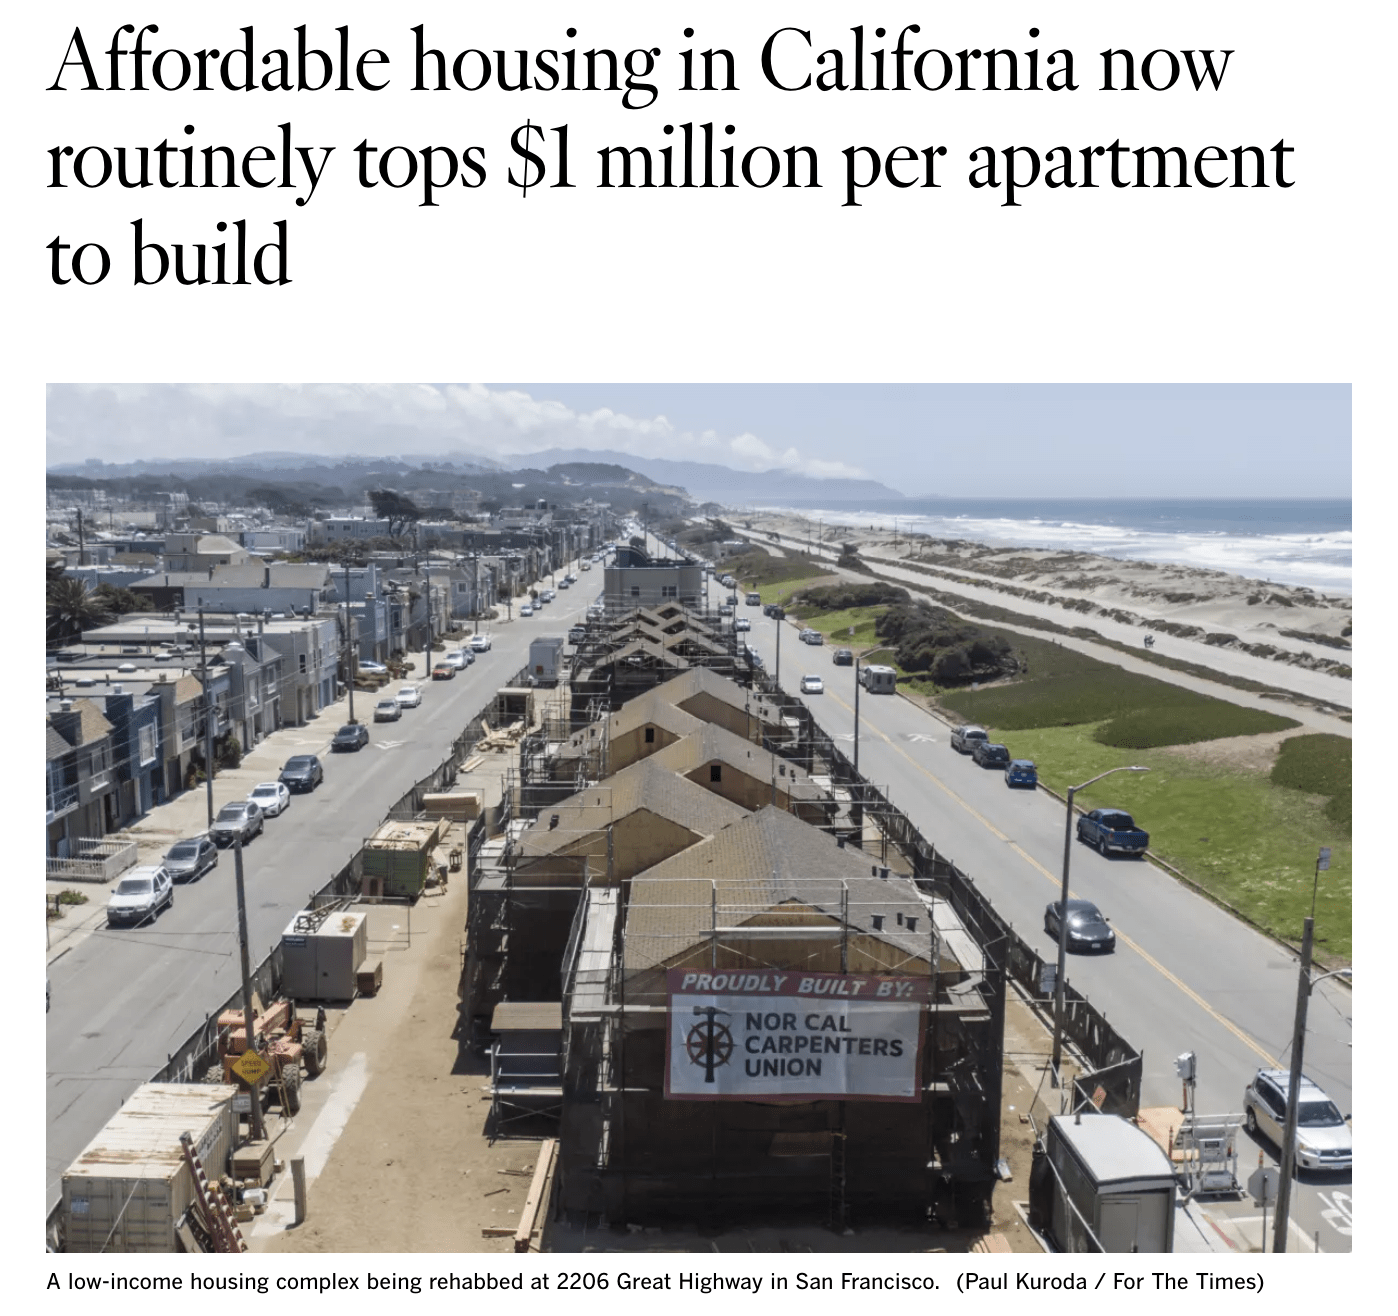
We see headlines about the high cost of producing affordable housing
But there are three costs that we potentially care about
The paper focuses on the latter
- Rosanne Haggerty (via NyTimes)
Plan For the Paper
(2) Consider what this number means for policy makers
(1) Evaluate/explore the following claim
"I find a citywide marginal fiscal cost of $1.6 million per low-income unit."
(3) Consider policy alternatives such as Mandatory Inclusive Housing and Density Bonuses
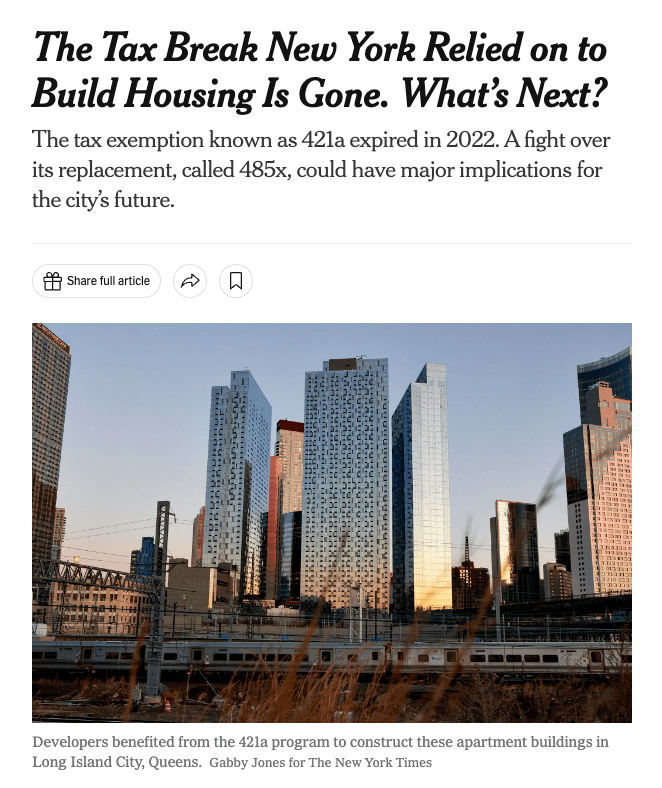
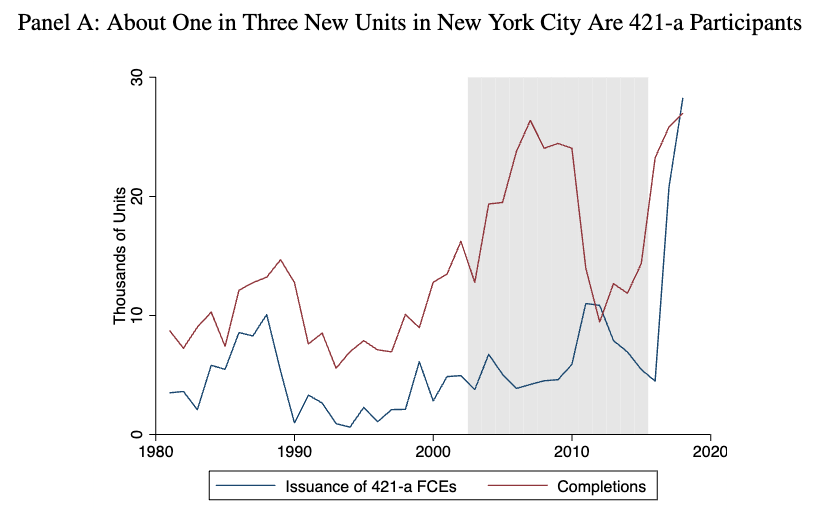
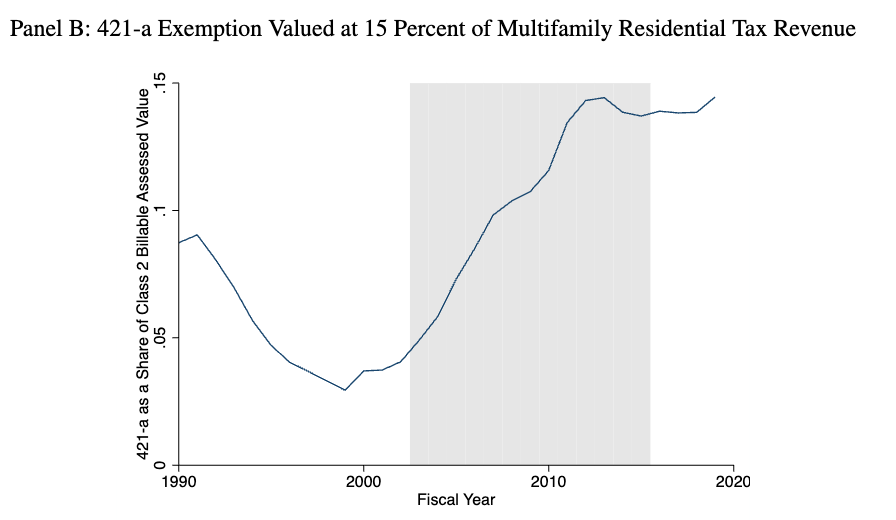
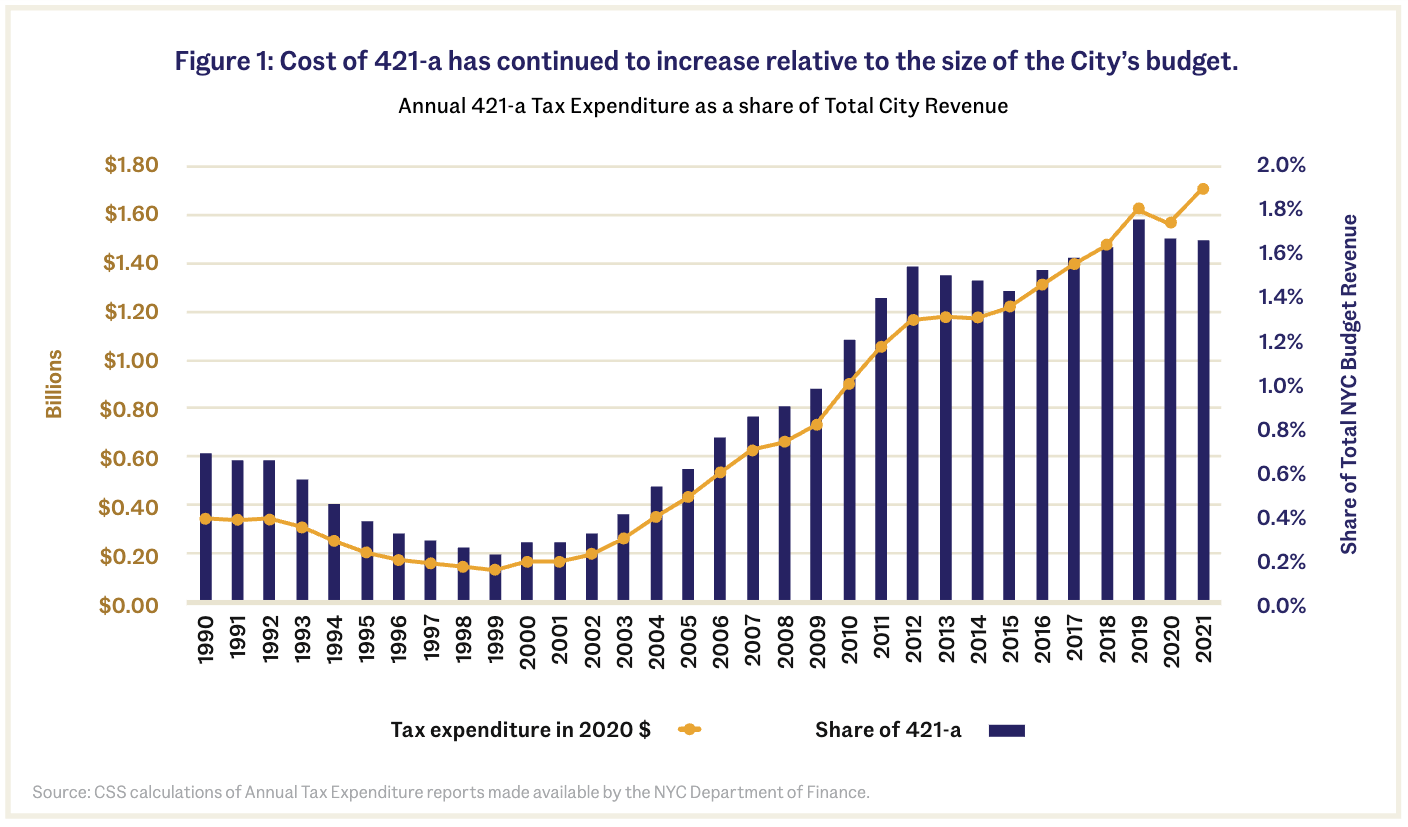
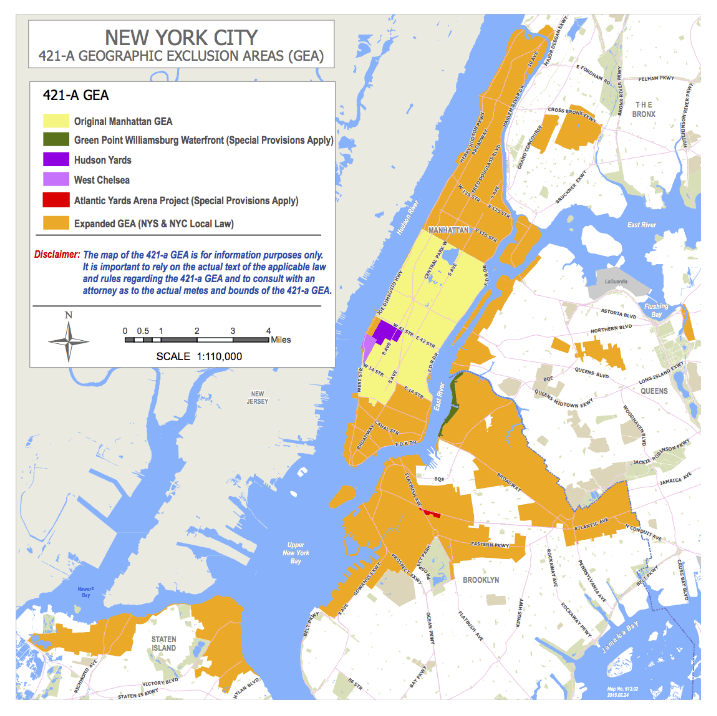
421-a
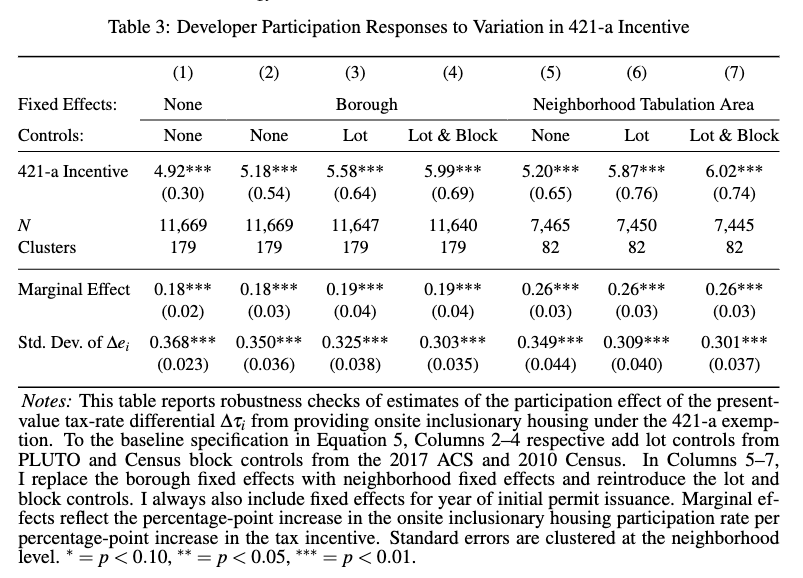
Why doesn't the author simply divide the Annual Tax expenditure by the number of units in the program?
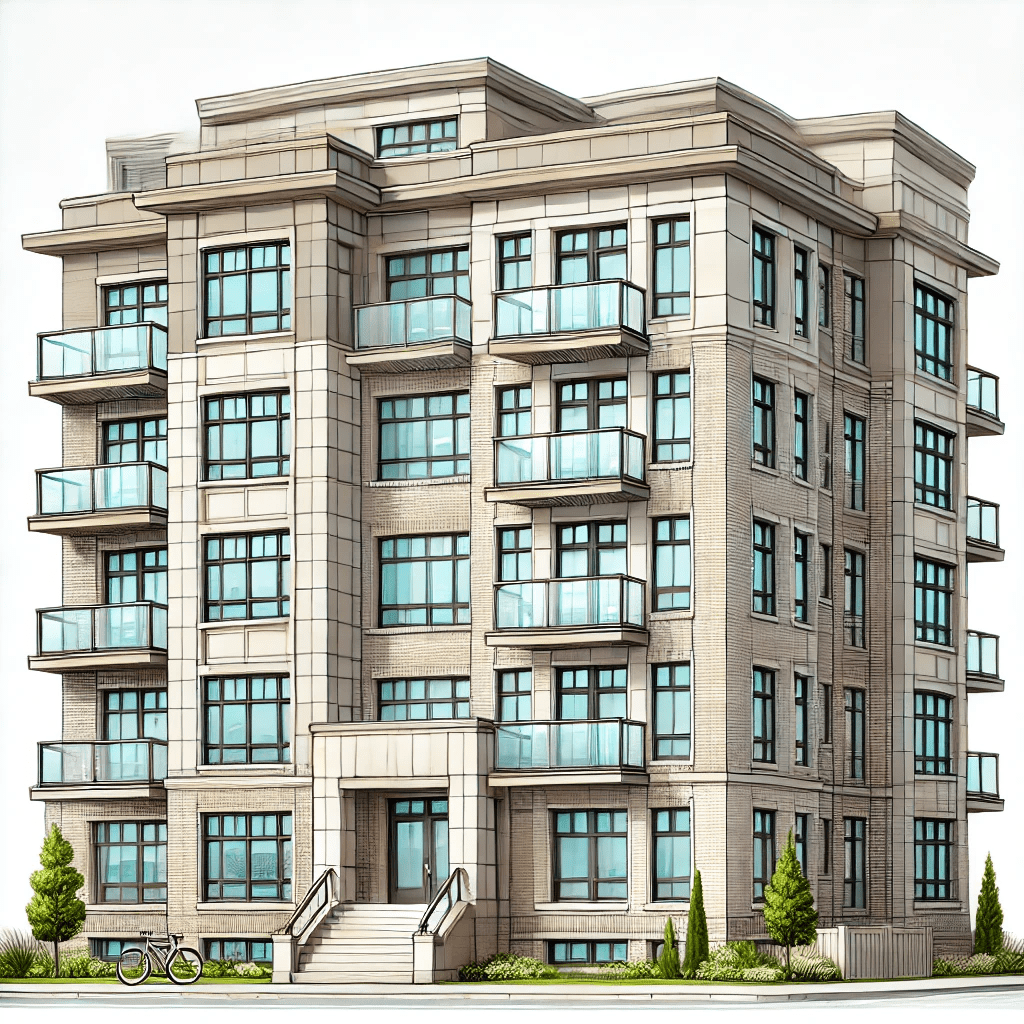
Market Rate
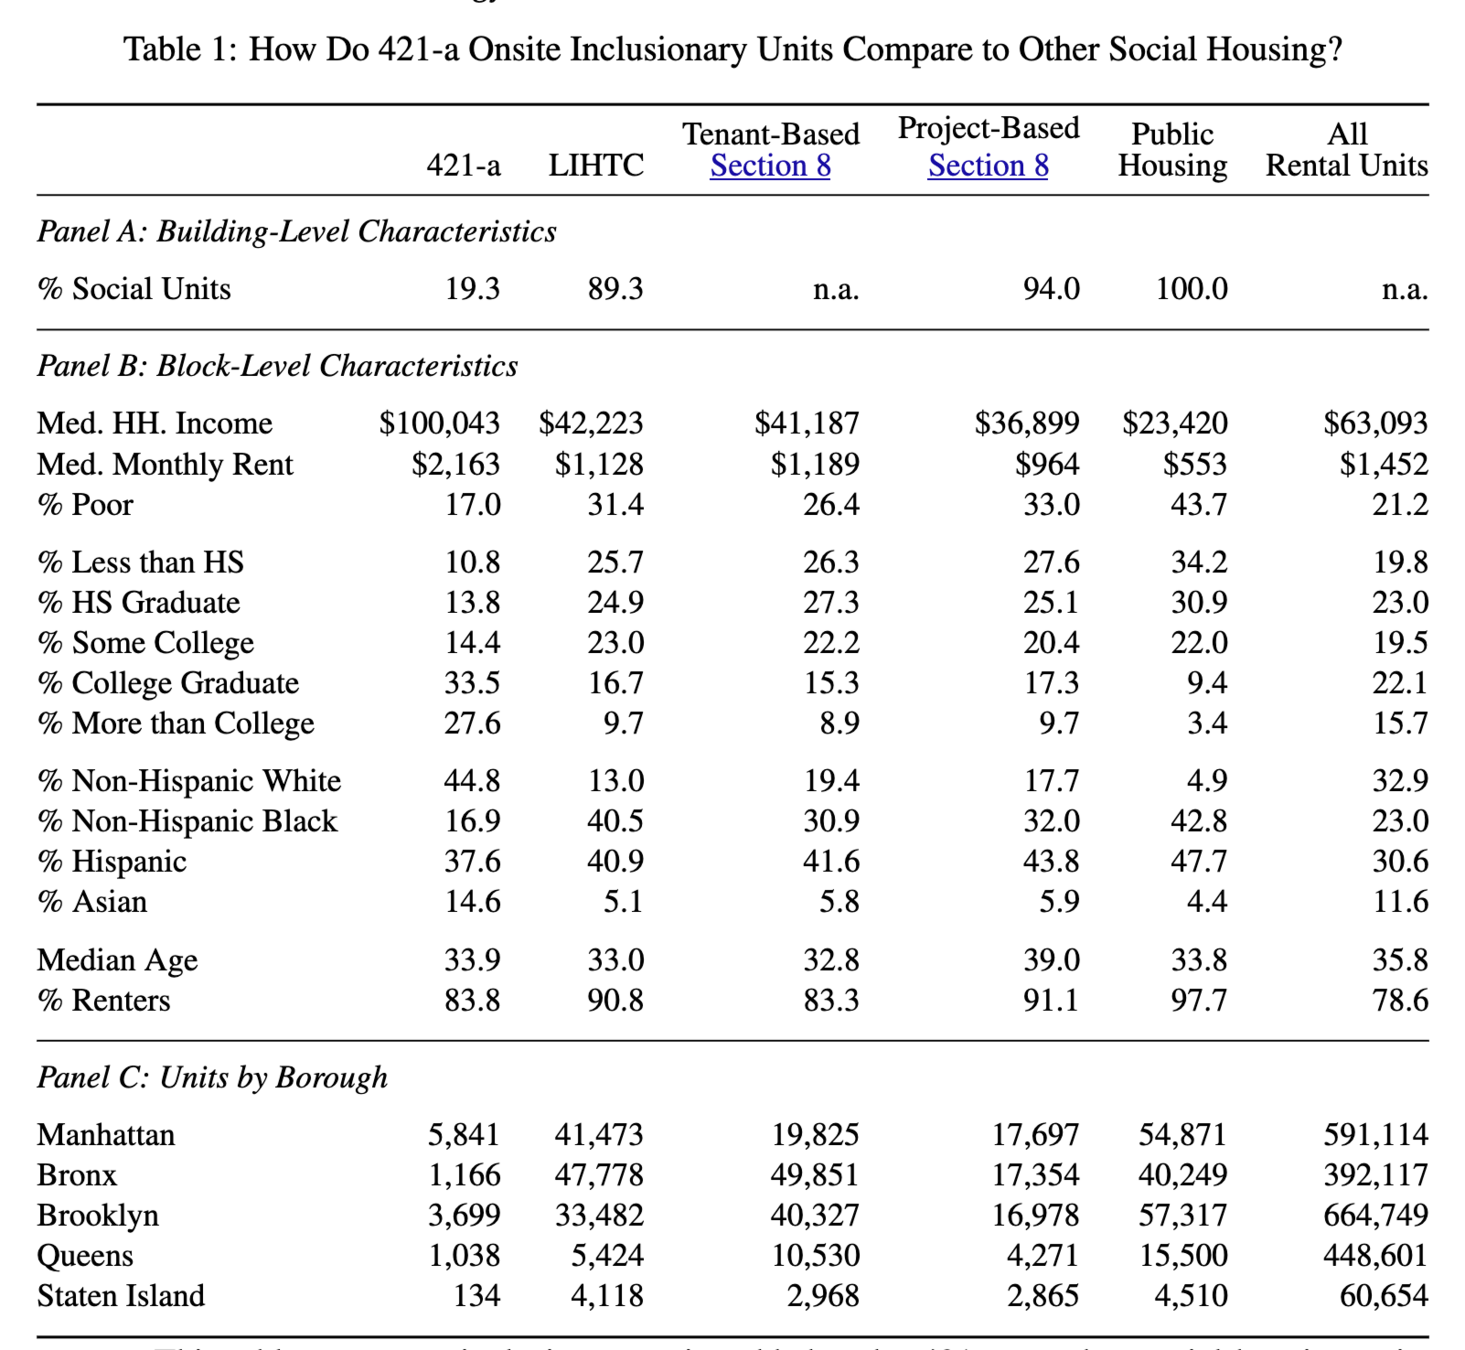
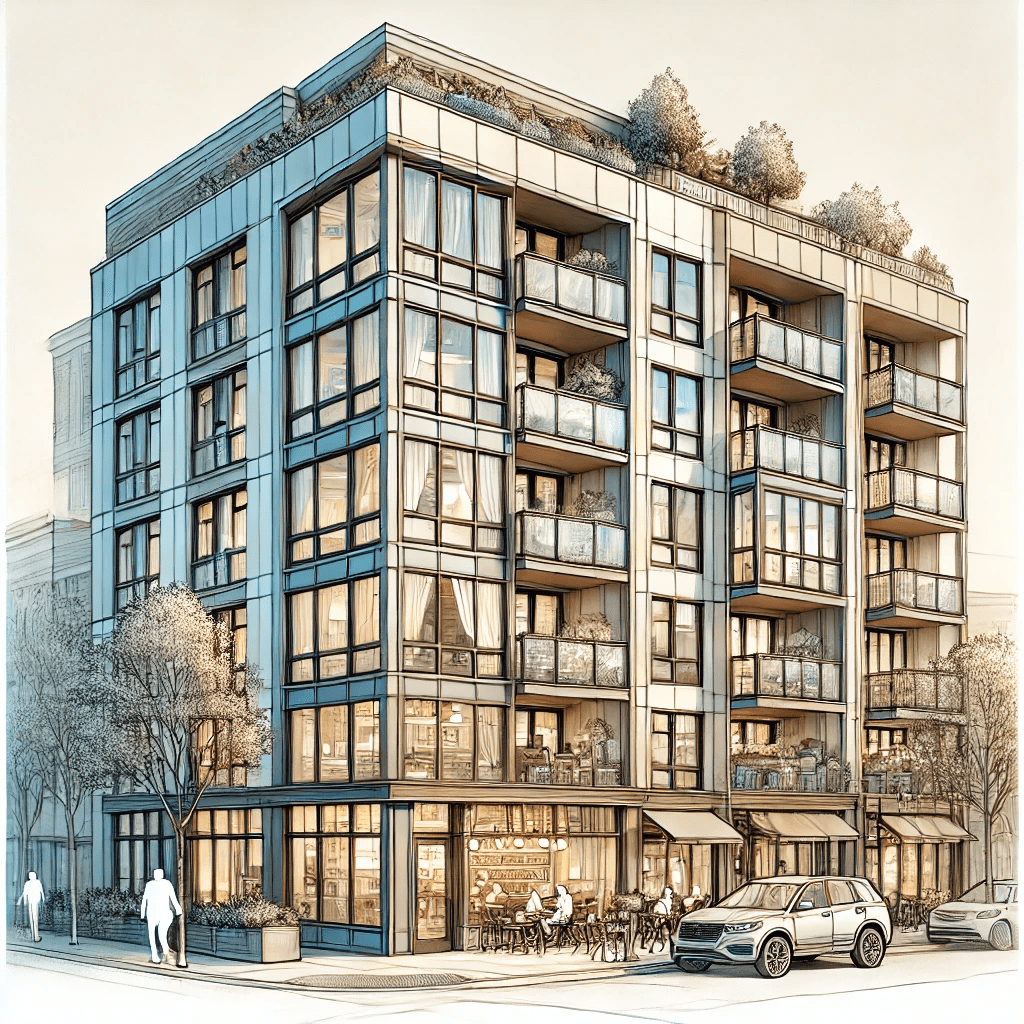
Inclusionary Housing
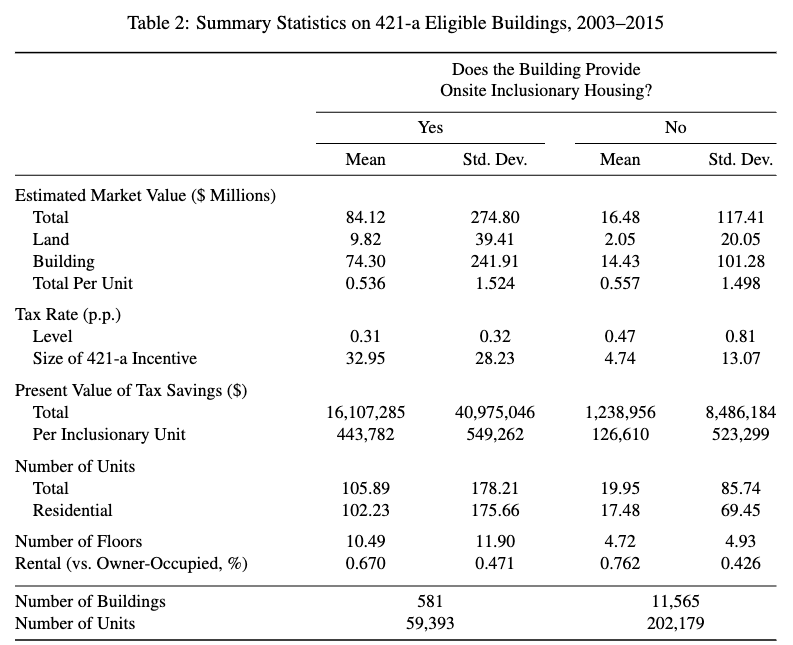
The cost of inclusionary housing is the foregone Rental Income and the difference in tax savings
Observed Data
Market Rate
Inclusionary
Inclusionary
Market Rate
Tax Savings
Rental Income
See Section 5.2
Layout of the Model
Developer's Problem
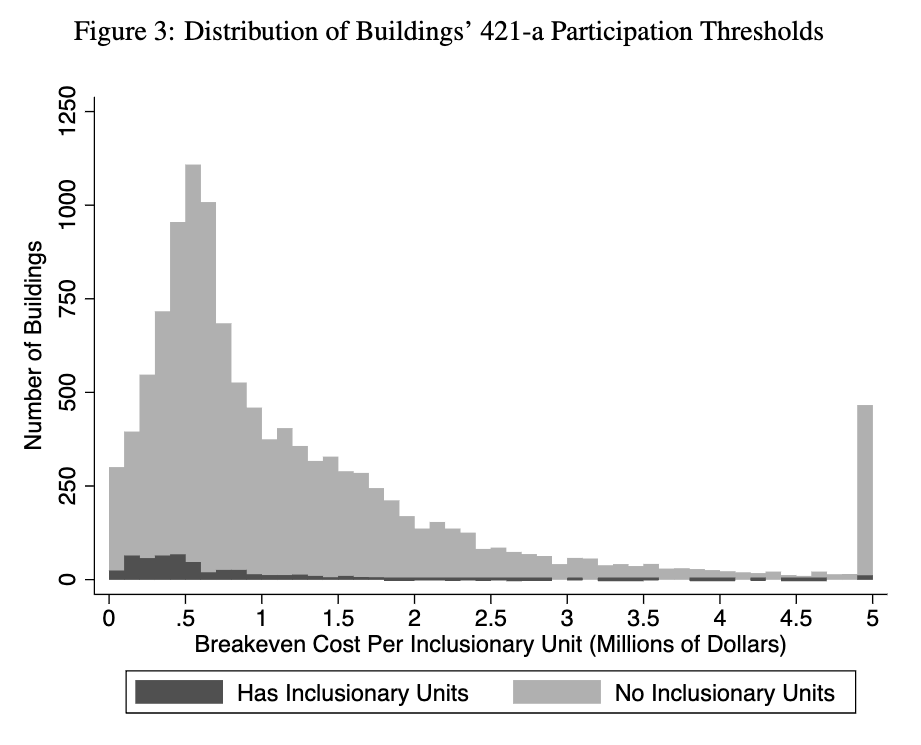
Median: $810,100
Comparing Housing Policy Alternatives
By Patrick Power


