Pierluigi Crescenzi
Professor at GSSI, L'Aquila
| k | Cluster sizes |
|---|---|
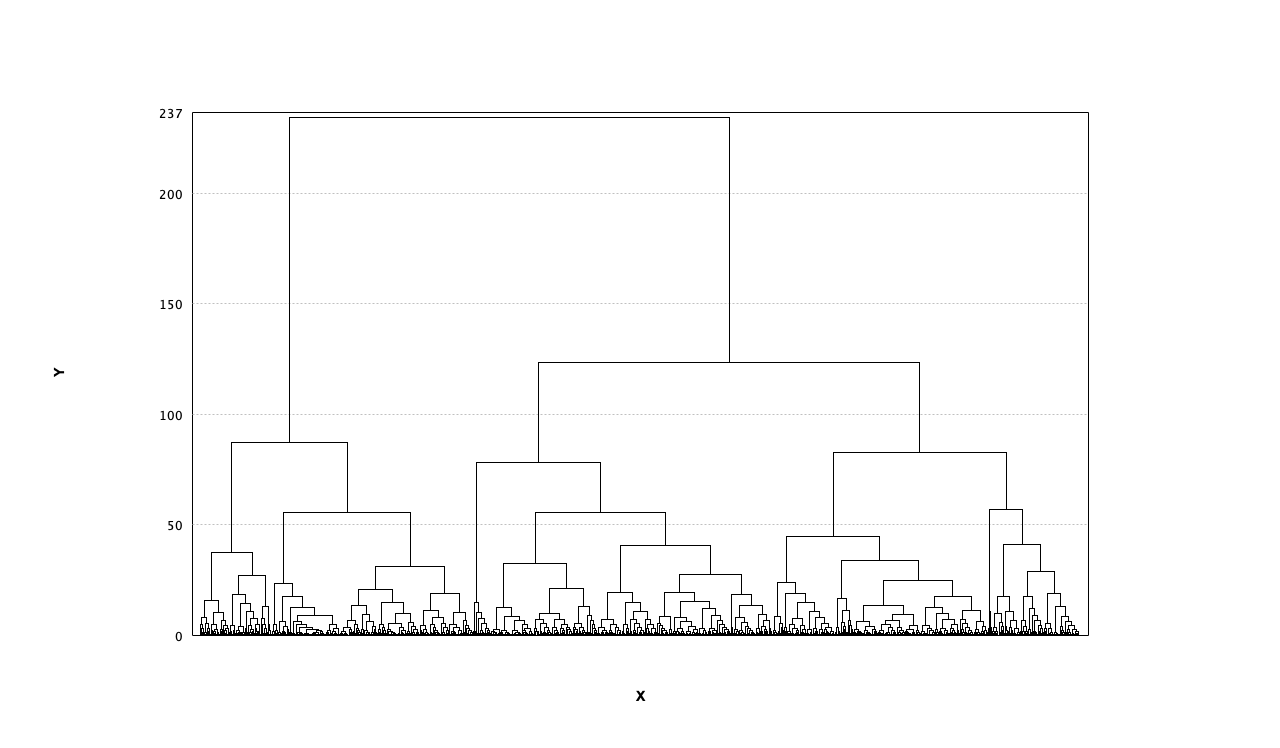
| 2 | 300, 717 |
| 3 | 294, 348, 375 |
| 4 | 107, 254, 286, 370 |
| 5 | 78, 89, 237, 248, 365 |
| 6 | 77, 79, 89, 159, 244, 369 |
| 7 | 34, 79, 80, 81, 163, 287, 293 |
| 8 | 35, 77, 79, 81, 153, 159, 183, 250 |
| 9 | 4, 35, 78, 78, 78, 154, 157, 184, 249 |
| 10 | 4, 34, 70, 78, 78, 131, 146, 146, 157, 173 |
| k | Cluster sizes |
|---|---|
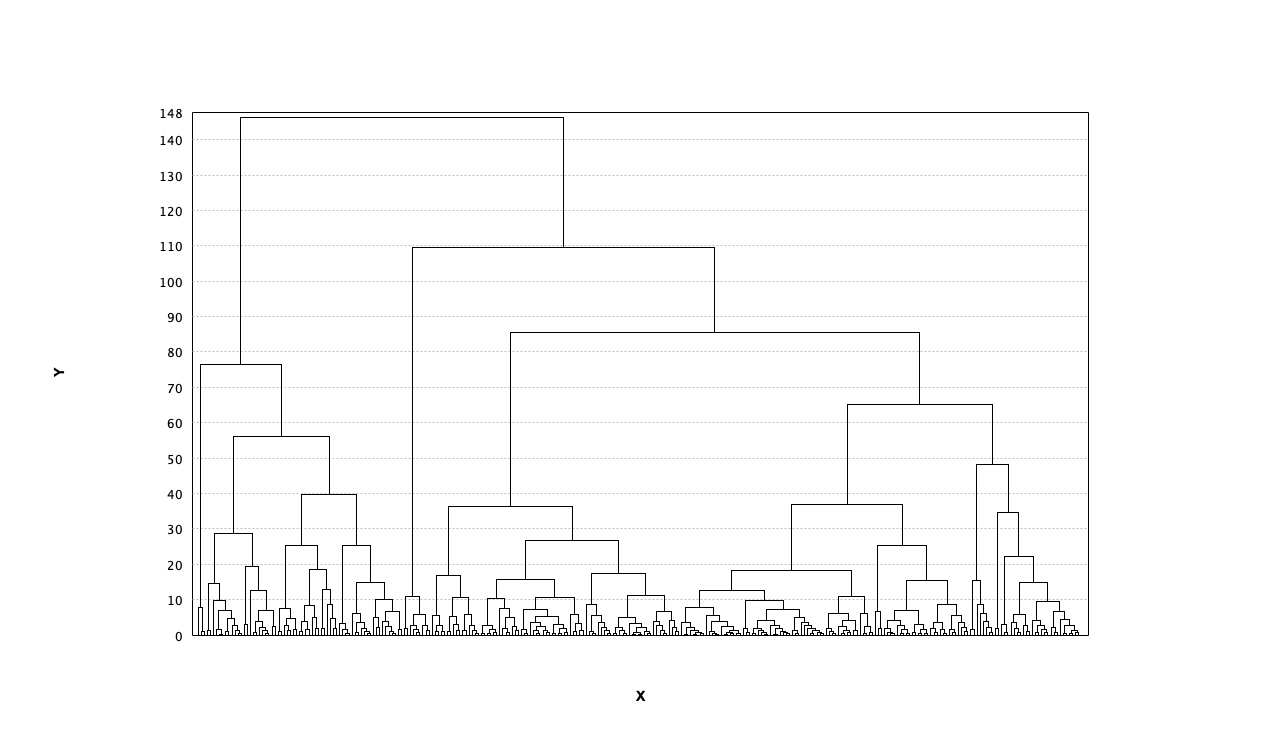
| 2 | 316, 701 |
| 3 | 316, 346, 355 |
| 4 | 82, 234, 346, 355 |
| 5 | 82, 105, 234, 250, 346 |
| 6 | 79, 82, 105, 155, 250, 346 |
| 7 | 20, 79, 82, 105, 155, 250, 326 |
| 8 | 4, 20, 79, 82, 101, 155, 250, 326 |
| 9 | 4, 20, 79, 82, 101, 124, 155, 202, 250 |
| 10 | 4, 20, 69, 79, 82, 101, 124, 133, 155, 250 |
k-means
hierarchical
| Dice index for h in [1,k] | |
|---|---|
| k=2 | 0.99,0.97 |
| k=3 | 0.93,0.96,0.91 |
| k=4 | 0.61,0.96,0.83,0.88 |
| k=5 | 0.81,0.88,0.82,0.89,0.99 |
| k=6 | 0.8,0.95,0.97,0.82,0.88,0.92 |
| k=7 | 0.96,0.86,0.89,0.74,0.95,0.89,0.88 |
| k=8 | 0.95,0.63,0.97,0.73,0.76,0.84,0.55,0.92 |
| k=9 | 0.92,0.76,0.58,0.59,0.73,0.97,1.0,0.96,0.85 |
| k=10 | 0.74,0.97,0.63,0.58,1.0,0.66,0.49,0.8,0.96,0.92 |
| 0.22 | -0.26 | 0.13 | -0.26 | -0.37 | -0.12 | 0.30 | 0.09 | -0.03 |
| 0.54 | 0.68 | 0.28 | 0.20 | -0.35 | 0.21 | 0.44 | -0.09 | |
| 0.88 | 0.54 | 0.84 | -0.69 | 0.03 | 0.15 | 0.03 | ||
| 0.38 | 0.66 | -0.71 | 0.07 | 0.29 | 0.06 | |||
| 0.73 | -0.02 | -0.17 | -0.12 | -0.26 | ||||
| -0.50 | -0.20 | -0.05 | -0.06 | |||||
| -0.24 | -0.28 | -0.07 | ||||||
| 0.05 | -0.08 | |||||||
| 0.01 |
Dy/Yb
Zr/Y
La/Sm
La/Yb
Th/Ta
Th/Zr
Zr/Nb
Nb/Ta
Zr/Hf
Zr/Y
La/Sm
La/Yb
Th/Ta
Th/Zr
Zr/Nb
Nb/Ta
Zr/Hf
K/Th
| k | Cluster sizes |
|---|---|
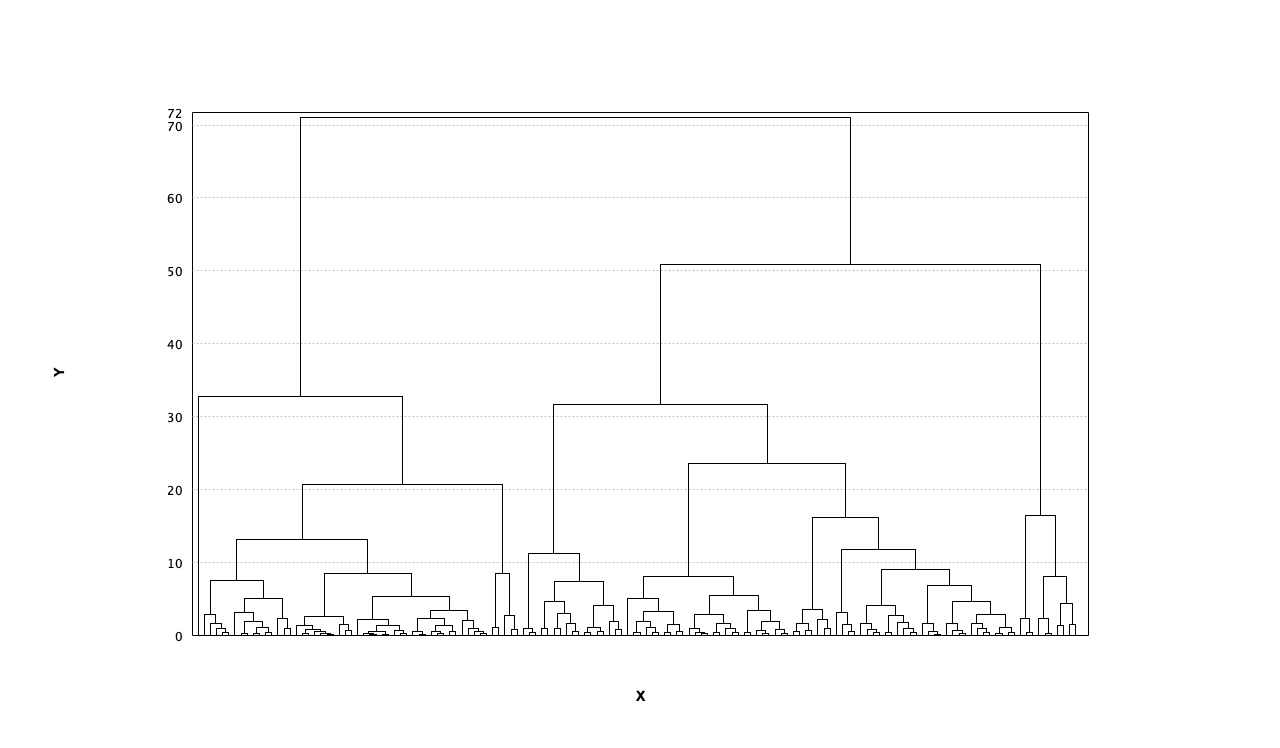
| 2 | 65, 222 |
| 3 | 59, 112, 116 |
| 4 | 3, 57, 110, 117 |
| 5 | 3, 11, 57, 96, 120 |
| 6 | 3, 11, 30, 57, 89, 97 |
| 7 | 3, 11, 24, 30, 34, 89, 96 |
| 8 | 3, 11, 21, 22, 29, 34, 78, 89 |
| 9 | 3, 7, 11, 21, 21, 26, 34, 82, 82 |
| 10 | 2, 3, 7, 11, 21, 21, 34, 44, 66, 78 |
| k | Cluster sizes |
|---|---|
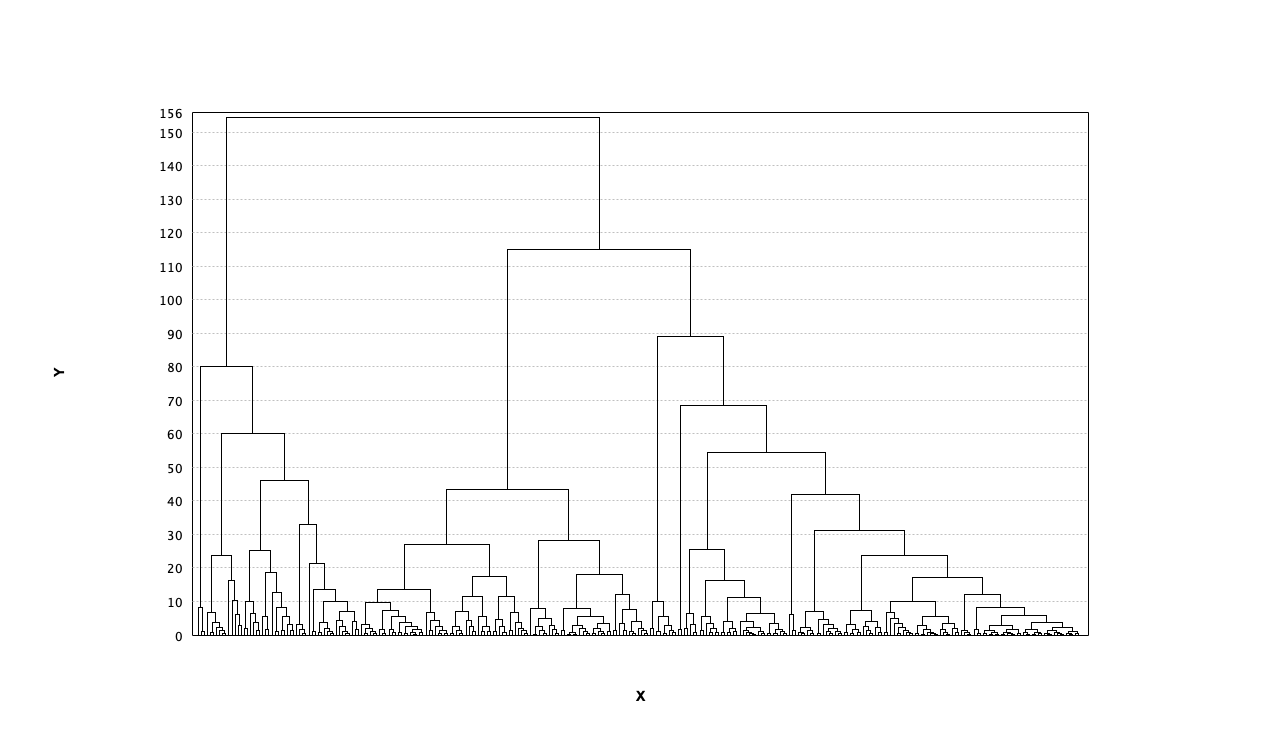
| 2 | 67, 220 |
| 3 | 9, 67, 211 |
| 4 | 3, 9, 64, 211 |
| 5 | 3, 9, 64, 81, 130 |
| 6 | 3, 9, 36, 64, 81, 94 |
| 7 | 3, 9, 23, 36, 41, 81, 94 |
| 8 | 3, 9, 20, 21, 23, 36, 81, 94 |
| 9 | 3, 8, 9, 20, 21, 23, 28, 81, 94 |
| 10 | 2, 3, 8, 9, 20, 21, 23, 26, 81, 94 |
k-means
hierarchical
| Dice index for h in [1,k] | |
|---|---|
| k=2 | 0.89,0.97 |
| k=3 | 0.64,0.92,0.66 |
| k=4 | 1.0,0.93,0.68,0.61 |
| k=5 | 0.83,0.79,1.0,0.9,0.93 |
| k=6 | 0.9,0.93,0.82,1.0,0.86,0.89 |
| k=7 | 0.89,0.86,0.9,1.0,0.88,0.89,0.82 |
| k=8 | 1.0,0.9,0.95,0.7,0.86,0.81,0.83,0.98 |
| k=9 | 0.85,0.93,1.0,0.95,0.82,1.0,0.9,0.74,0.9 |
| k=10 | 1.0,0.93,1.0,0.74,0.76,0.79,0.66,0.95,1.0,0.9 |
| k | Cluster sizes |
|---|---|
| 2 | 15, 129 |
| 3 | 11, 51, 82 |
| 4 | 1, 11, 50, 82 |
| 5 | 1, 3, 17, 51, 72 |
| 6 | 1, 3, 17, 28, 42, 53 |
| 7 | 1, 3, 4, 12, 28, 41, 55 |
| 8 | 1, 3, 5, 5, 19, 29, 39, 43 |
| 9 | 1, 2, 3, 4, 7, 22, 27, 36, 42 |
| 10 | 1, 2, 3, 4, 10, 12, 13, 30, 34, 35 |
| k | Cluster sizes |
|---|---|
| 2 | 53, 91 |
| 3 | 10, 53, 81 |
| 4 | 1, 10, 52, 81 |
| 5 | 1, 3, 7, 52, 81 |
| 6 | 1, 3, 7, 17, 52, 64 |
| 7 | 1, 3, 5, 7, 17, 47, 64 |
| 8 | 1, 3, 5, 7, 17, 27, 37, 47 |
| 9 | 1, 2, 3, 3, 7, 17, 27, 37, 47 |
| 10 | 1, 2, 3, 3, 7, 15, 17, 27, 32, 37 |
k-means
hierarchical
| Dice index for h in [1,k] | |
|---|---|
| k=2 | 0.73,0.21 |
| k=3 | 0.95,0.99,0.98 |
| k=4 | 0.99,0.98,0.95,1.0 |
| k=5 | 1.0,0.97,1.0,0.58,0.94 |
| k=6 | 1.0,1.0,0.89,0.77,0.58,0.76 |
| k=7 | 0.67,0.63,0.76,0.89,1.0,1.0,0.79 |
| k=8 | 1.0,0.91,0.83,0.82,0.79,0.6,1.0,0.89 |
| k=9 | 0.87,0.86,0.94,0.75,1.0,1.0,0.86,1.0,0.86 |
| k=10 | 0.95,0.64,0.83,0.96,0.71,0.82,0.86,1.0,1.0,1.0 |
| k | Cluster sizes |
|---|---|
| 2 | 63, 224 |
| 3 | 54, 111, 122 |
| 4 | 11, 46, 101, 129 |
| 5 | 3, 11, 56, 106, 111 |
| 6 | 3, 11, 25, 30, 107, 111 |
| 7 | 2, 3, 11, 21, 34, 106, 110 |
| 8 | 2, 3, 11, 24, 25, 26, 86, 110 |
| 9 | 2, 3, 12, 24, 25, 26, 31, 78, 86 |
| 10 | 2, 3, 10, 12, 15, 22, 26, 37, 74, 86 |
| k | Cluster sizes |
|---|---|
| 2 | 53, 234 |
| 3 | 53, 94, 140 |
| 4 | 9, 53, 94, 131 |
| 5 | 3, 9, 50, 94, 131 |
| 6 | 3, 9, 39, 50, 55, 131 |
| 7 | 3, 9, 12, 38, 39, 55, 131 |
| 8 | 2, 3, 9, 12, 38, 39, 55, 129 |
| 9 | 2, 3, 9, 12, 17, 21, 39, 55, 129 |
| 10 | 2, 3, 9, 12, 17, 21, 34, 39, 55, 95 |
k-means
hierarchical
| Dice index for h in [1,k] | |
|---|---|
| k=2 | 0.86,0.97 |
| k=3 | 0.8,0.92,0.82 |
| k=4 | 0.87,0.95,0.85,0.9 |
| k=5 | 0.85,0.81,0.9,0.9,1.0 |
| k=6 | 0.4,0.68,0.9,0.9,1.0,0.75 |
| k=7 | 1.0,0.67,0.92,0.68,0.9,0.9,0.03 |
| k=8 | 0.46,0.9,0.9,1.0,0.65,1.0,0.81,0.52 |
| k=9 | 0.46,0.65,0.36,0.75,0.52,1.0,1.0,0.86,0.72 |
| k=10 | 0.82,1.0,1.0,0.95,0.72,0.44,0.86,0.26,0.64,0.82 |
By Pierluigi Crescenzi