

AUDIENCE
HEALTCHECK


Real User Measurements Revisited
Performing in Real World
Hi, I'm Rafal RUManek

doing frontend stuff at Codewise
event organizer for Angular Dragons
@RafalRumanek
I have a poor sense of humour

(please, forgive me!)

1939 KB
is the median size of resources requested by a page
is the median number of resources requested by a page
75 requests
19 connections
is the median number of
TCP connections for a page
is the average load time
for a mobile page
15.3s
53% of mobile visitors leave a page
that takes more than
3 seconds to load

3.6s?
What should be my goal?
Do I have budget for it?

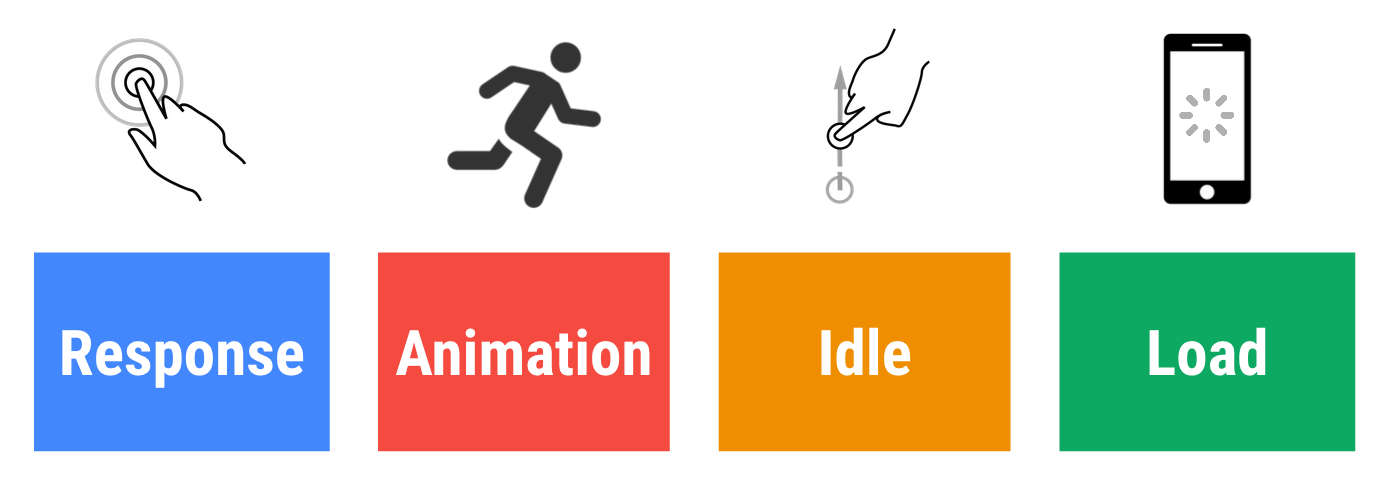
RAIL model - industry standards?
image src & read more at:
https://developers.google.com/web/fundamentals/performance/rail
How do I get there?
1. Local tests
2. Synthetic tests
3. Real user tests
(during development, devtools + audits)
(pre-release)
(prod - Real User Measurement)
From click to load
image src & read more at:
https://www.w3.org/TR/navigation-timing

image src & read more at:
https://www.w3.org/TR/navigation-timing-2/

Navigation timing
Navigation timing
    const [perfData] = performance.getEntriesByType('navigation');

    const pageLoadTime = perfData.loadEventEnd
    				- perfData.startTime;

    const dnsLookupTime = perfData.domainLookupEnd
    				- perfData.domainLookupStart;

    const timeTillFirstByte = perfData.responseStart
    				- perfData.requestStart;
read more at:
https://www.w3.org/TR/navigation-timing-2/

Resource timing
Resource timing
    // retrieving script transfer size

    const scriptsResources = performance.getEntriesByType('resource')
        .filter(entry => entry.initiatorType === 'script');

    const scriptsTransferSize = scriptsResources
        .reduce((sum, {transferSize}) => sum + transferSize, 0);
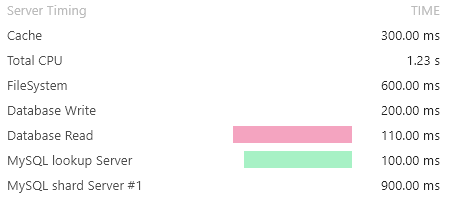
Server Timing headers
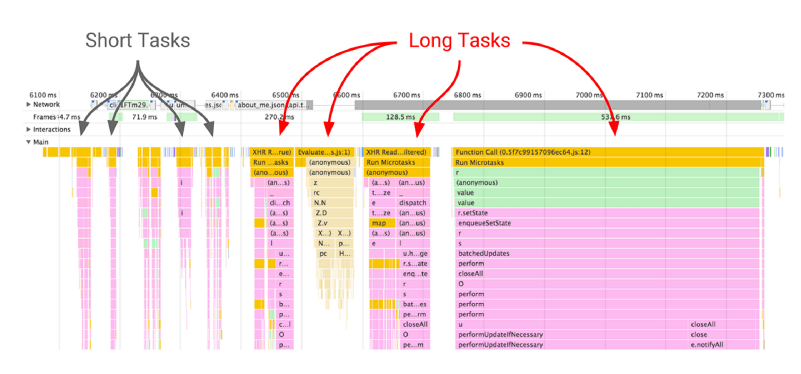
Long Tasks
Perceived performance
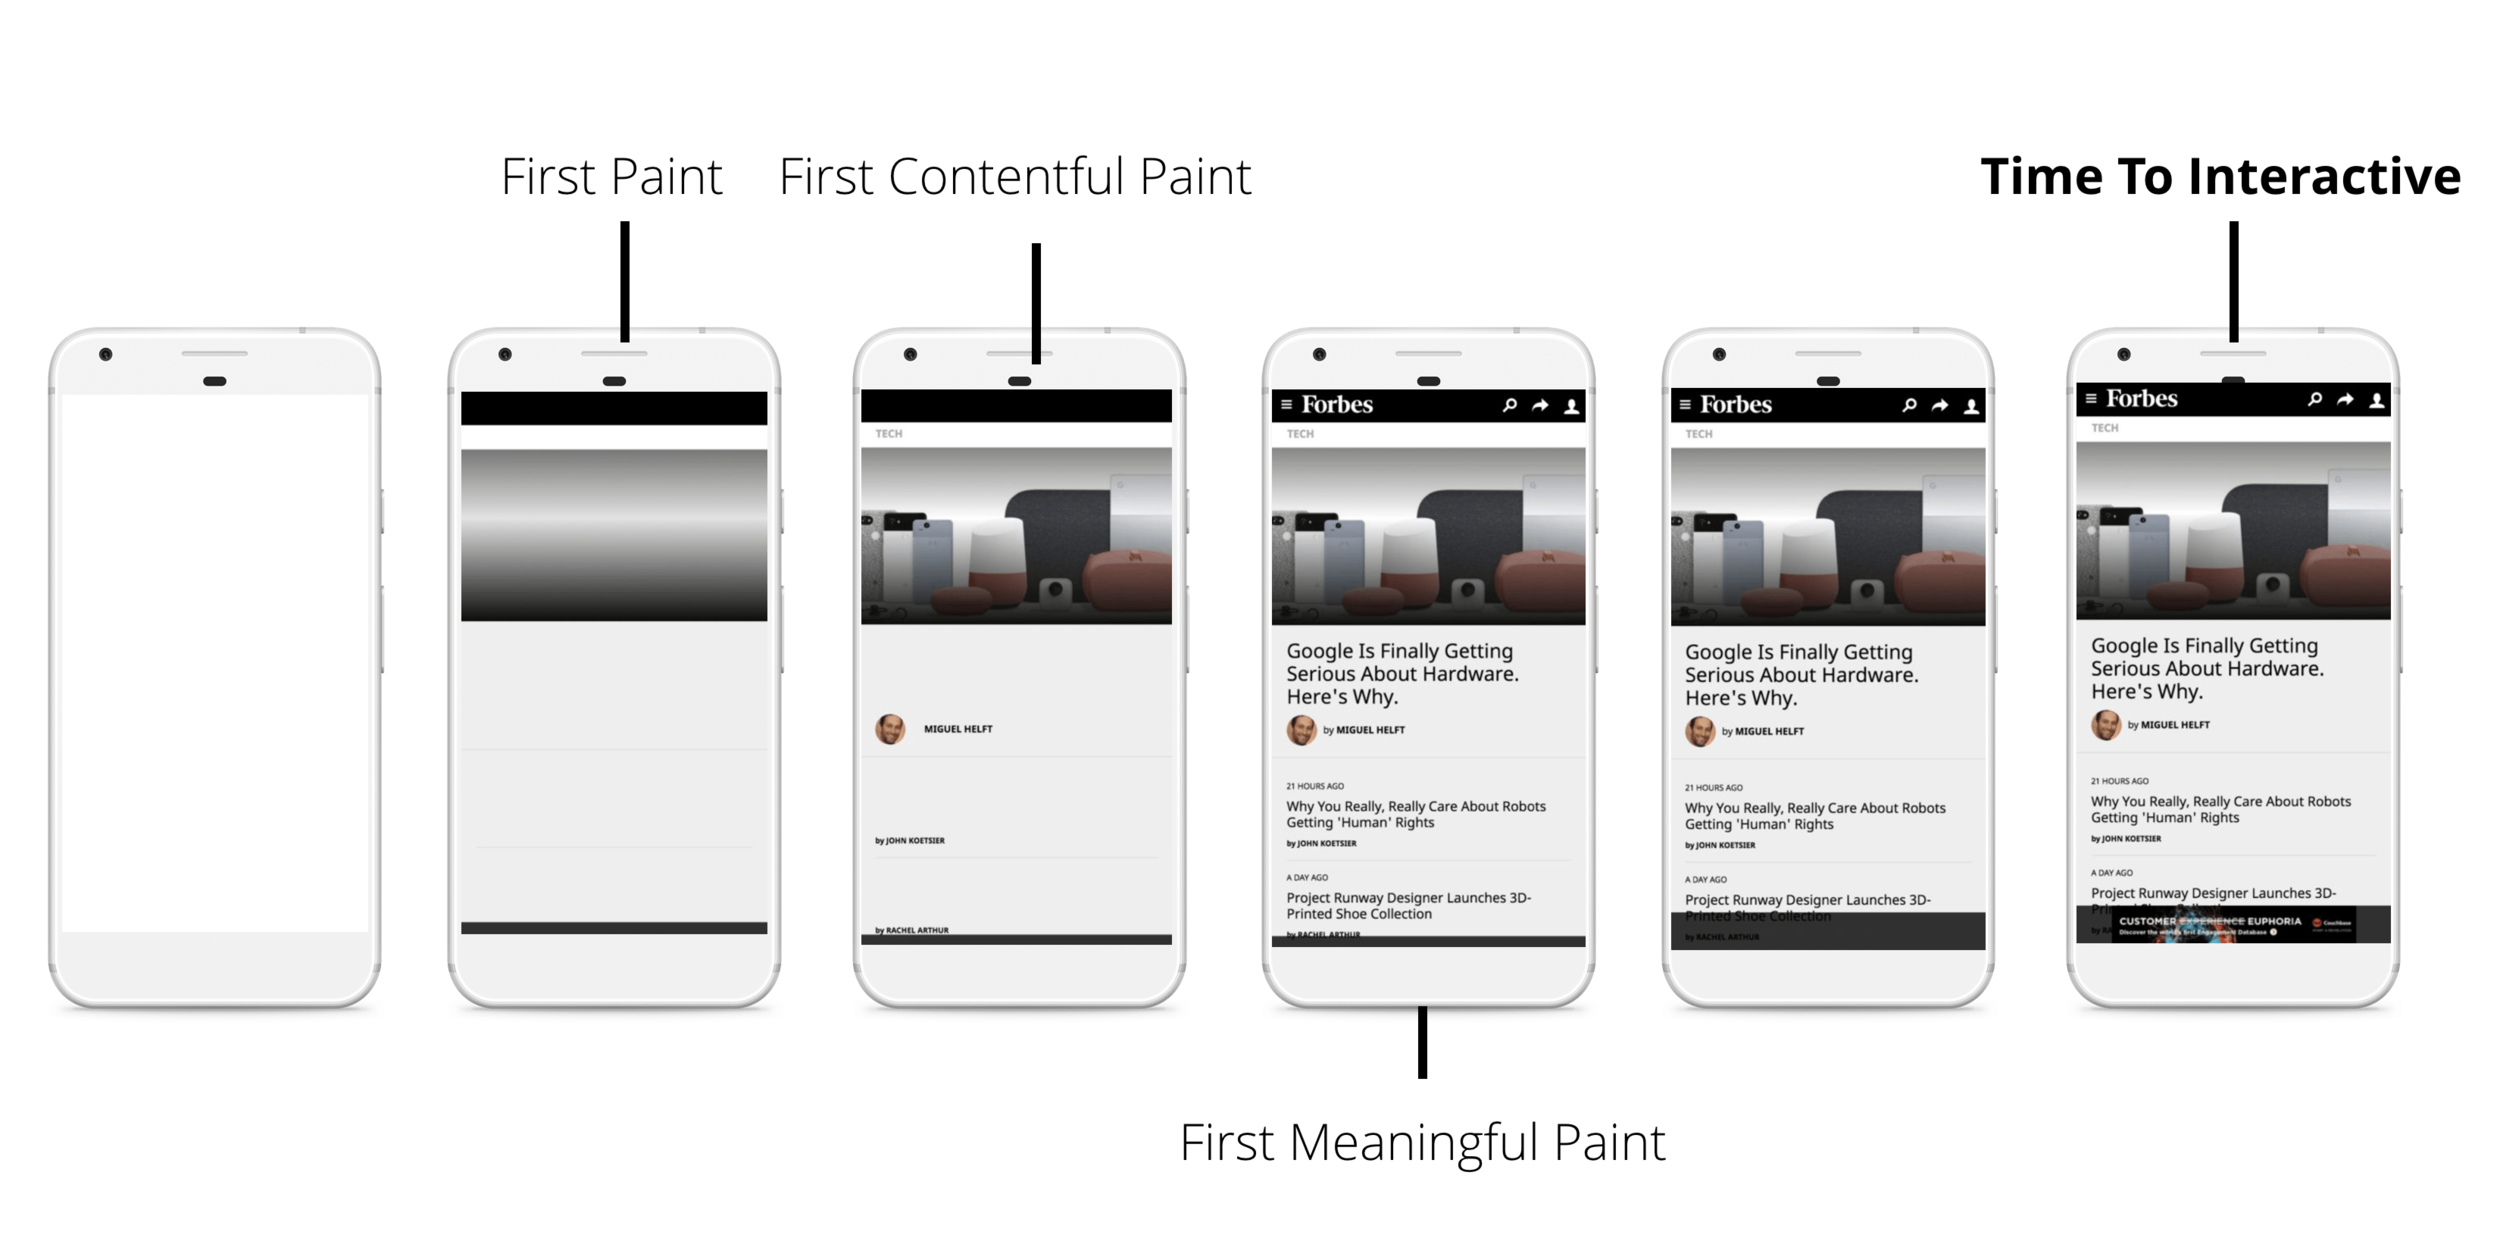
image src & read more at:
https://developers.google.com/web/fundamentals/performance/rail
When is your app really ready?
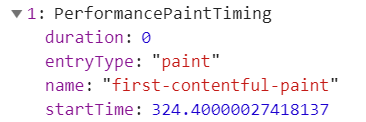
Paint Timing
    // first-paint, first-contentful-paint

    const timingEntries = performance.getEntriesByType('paint');
Time till:
-
visually ready
-
interactive
Time till visually ready
Time till visually ready
-
First paint (if available) - not necessarily meaningful
Time till visually ready
-
First paint (if available) - not
necessarily meaningful
-
domContentLoadedEventEnd - available through performance.timing
Time till visually ready
-
hero image (if exists) - via Resource Timing
-
First paint (if available) - not
necessarily meaningful -
domContentLoadedEventEnd -
available through performance.timing
Time till visually ready
-
framework ready - custom, user defined event
-
First paint (if available) - not
necessarily meaningful -
domContentLoadedEventEnd -
available through performance.timing -
hero image (if exists) - via Resource Timing
Time till interactive
Time till interactive
-
Time till visually ready
Time till interactive
-
Time till visually ready
-
no long tasks (Long Tasks API)
Time till interactive
-
FPS > 20 - requestAnimationFrame
-
no long tasks (Long Tasks API)
-
Time till visually ready
It's not only about the load time!

User timing
performance.now
performance.mark
performance.measure

Performance observer
    const observer = new PerformanceObserver(list => {
       const entries = list.getEntries();
       // log performance data
    });


    observer.observe({entryTypes: ["resource"]});
Long Tasks

From interaction to interactivity in SPA
From interaction to interactivity in SPA
-
timing between interaction and xhr (if exists): performance.mark, routing events if available
From interaction to interactivity in SPA
-
fetch time: resource timing + performance observer + server timing
-
timing between interaction and xhr (if exists): performance.mark, routing events if available
From interaction to interactivity in SPA
-
timing between interaction and xhr (if exists): performance.mark, routing events if available
-
fetch time: resource timing + performance observer + server timing
-
rendering complete: routing complete, after render events - performance marks
From interaction to interactivity in SPA
- full interactivity: no long tasks + FPS > threshold
-
timing between interaction and xhr (if exists): performance.mark, routing events if available
-
fetch time: resource timing + performance observer + server timing
-
rendering complete: routing complete, after render events - performance marks
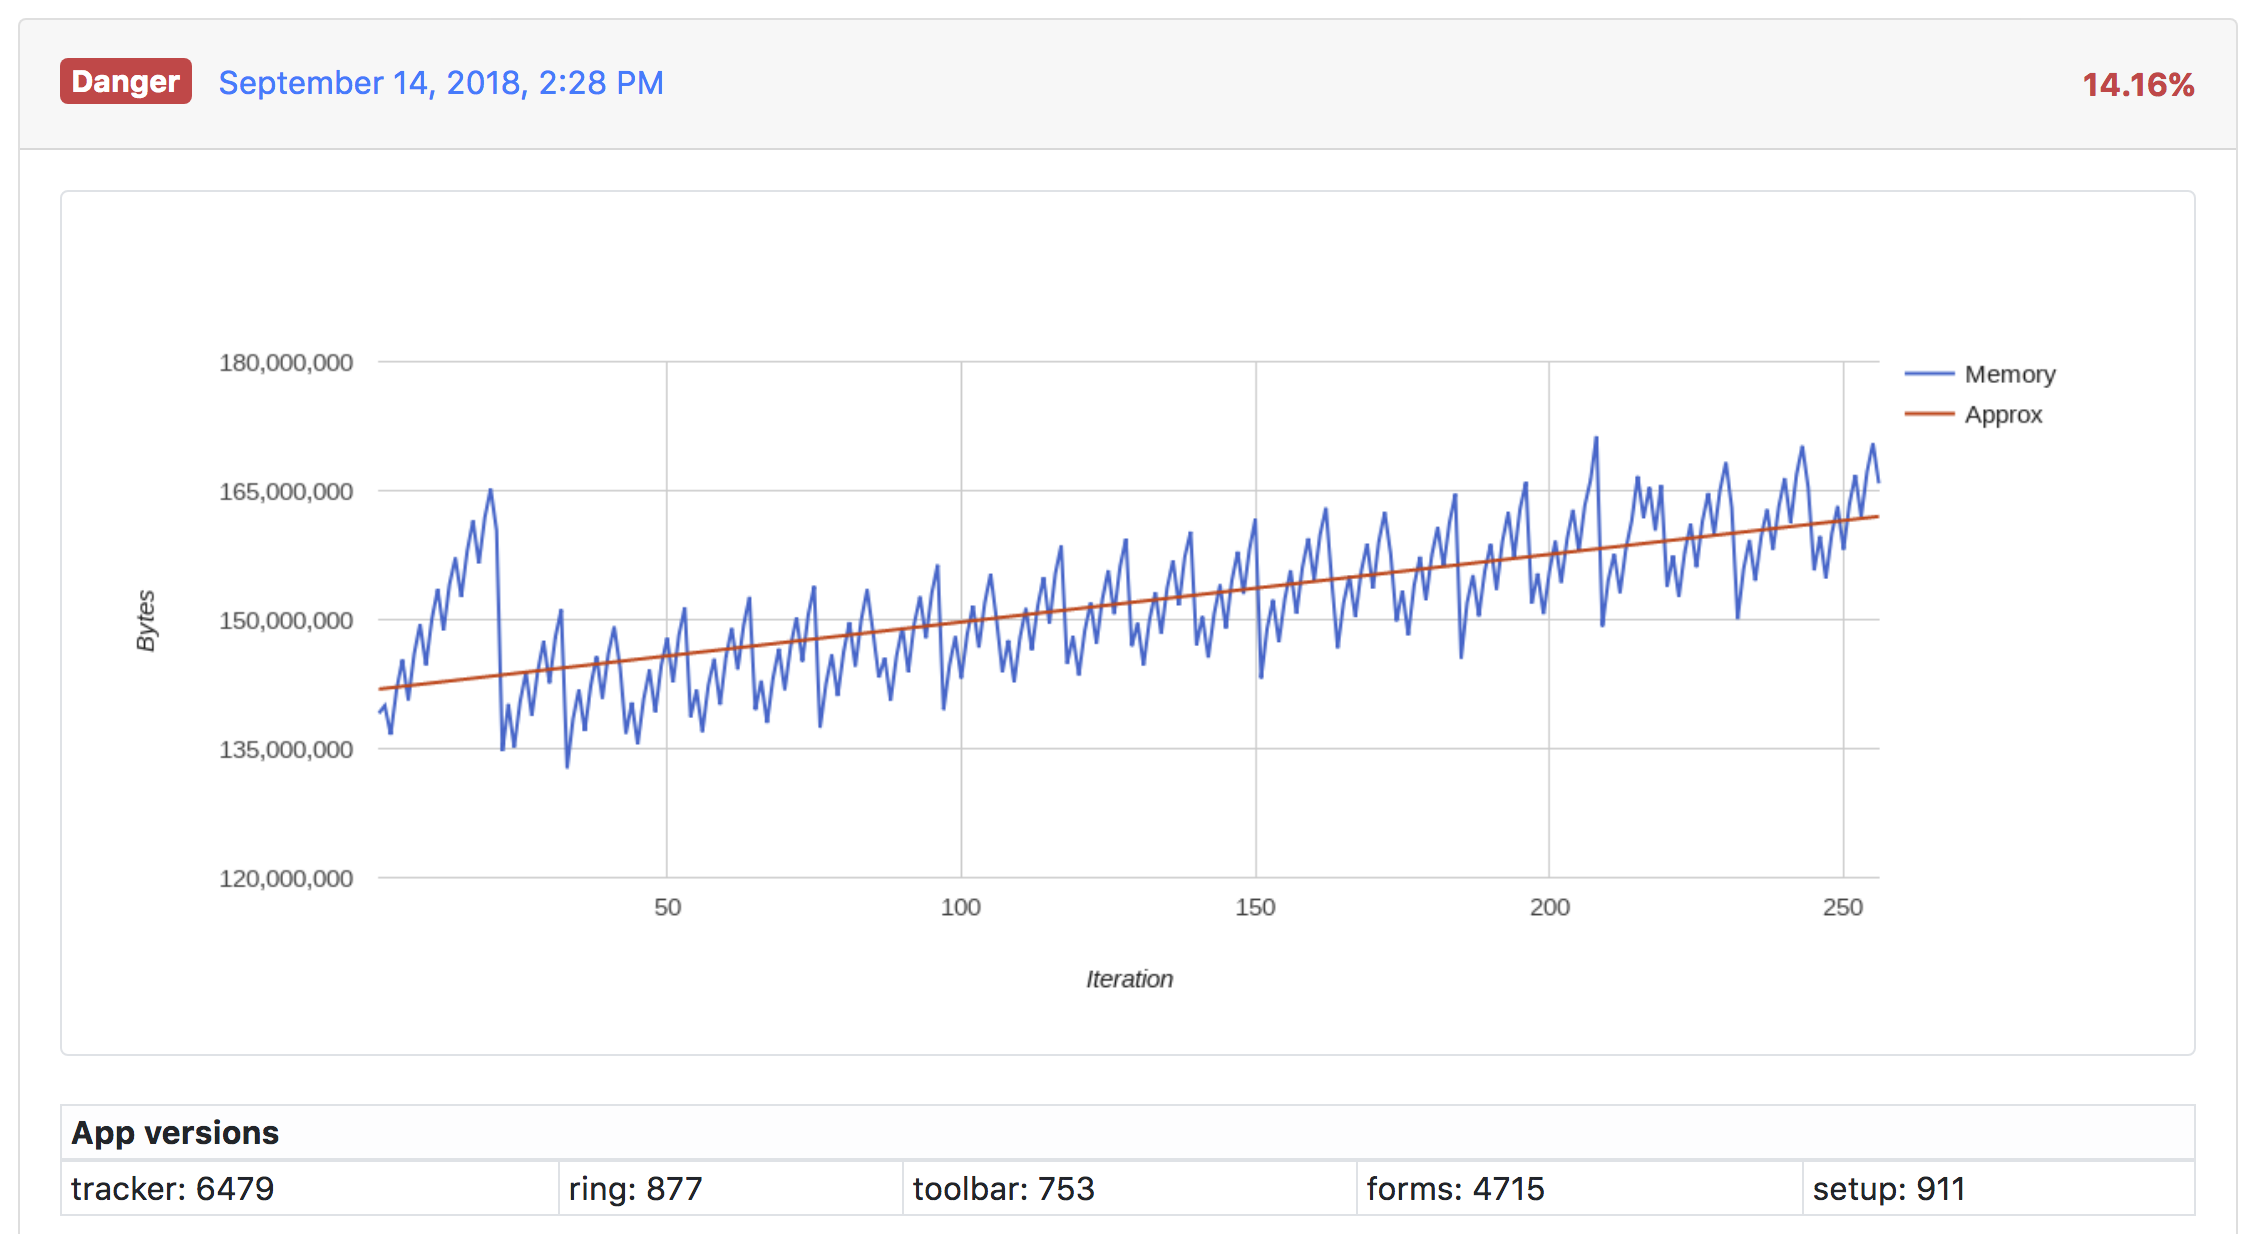
Memory

Tips
-
for sending gathered data, consider using Beacon API
Tips
-
for sending gathered data, consider using Beacon API
-
remember about Timing-Allow-Origin header
Tips
-
for sending gathered data, consider using Beacon API
-
remember about Timing-Allow-Origin header
-
be aware of cache hits: in-memory, disk, CDN edge
Tips
-
for sending gathered data, consider using Beacon API
-
remember about Timing-Allow-Origin header
-
be aware of cache hits: in-memory, disk, CDN edge
-
make sure you separate background tab performance with Page Visibility API
Tips
-
for sending gathered data, consider using Beacon API
-
remember about Timing-Allow-Origin header
-
be aware of cache hits: in-memory, disk, CDN edge
-
make sure you separate background tab performance with Page Visibility API
-
differentiate page load from refresh
Paid solutions
SpeedCurve, Catchpoint, mPulse,
Tornimo.io, Pingdom, Sentry, ....
You can start on your own!
Baby steps, right?
If you don't measure and optimize your app performance, eventually it will downgrade


If you don't measure and optimize your app performance, eventually it will downgrade

If you don't measure and optimize your app performance, eventually it will downgrade
Thank you!


@RafalRumanek
RUM revisited @ meetjs summit 30.09
By Rafał Rumanek (truti)
RUM revisited @ meetjs summit 30.09
- 999


