Predicting Surgical Site Infection (SSI)
Where are we, and how did we get here?
Rebecca Barter
A roadmap
Making the raw data useable
Understanding the data
Obtaining more data
Modeling approaches
Making the raw data useable
We finally got data!!
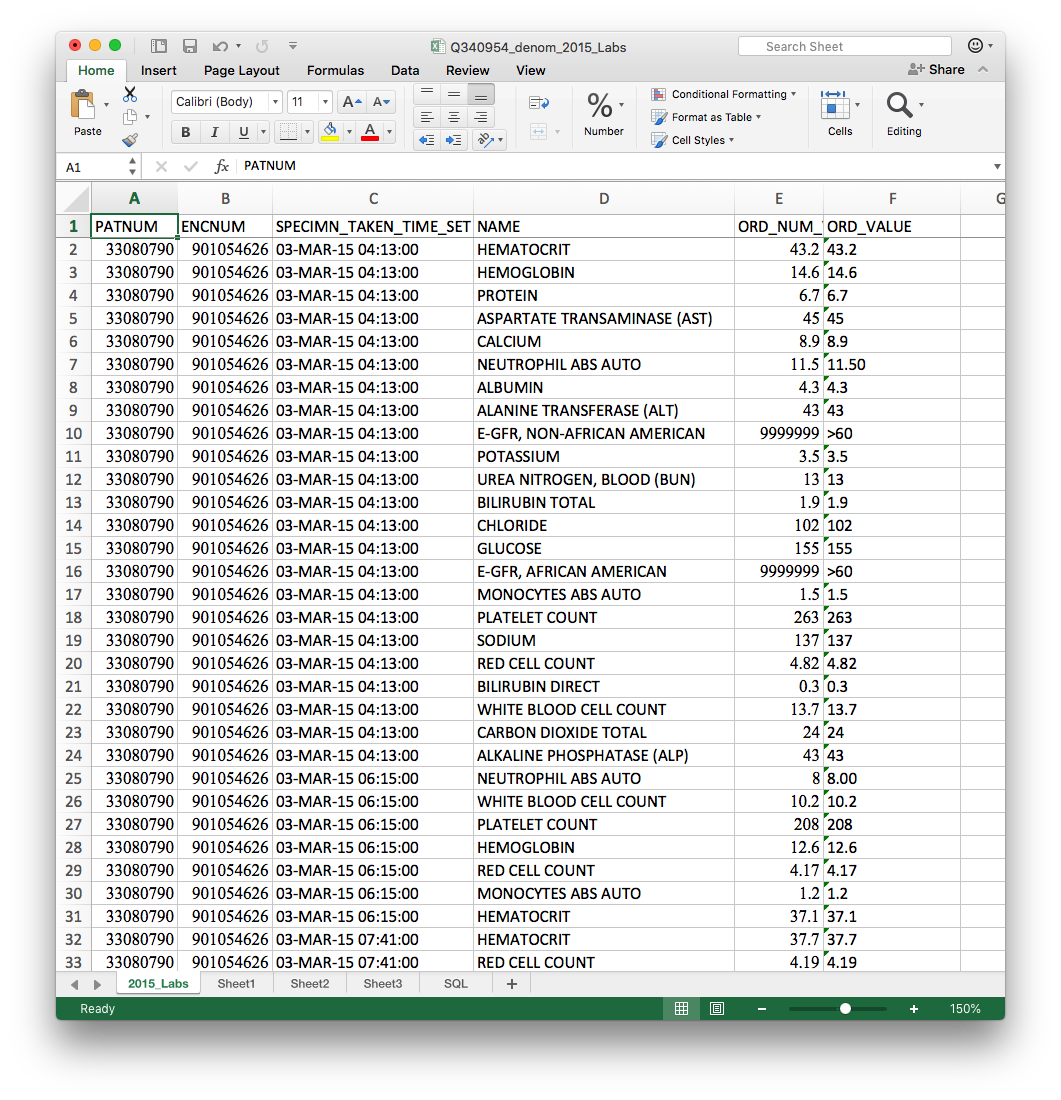
Data was split across
- one file per year
- multiple sheets within each excel file
for multiple types of data
- Labs
- Medications
- Previous diagnoses
- Problem list
- Vitals
- Denominator (patient info surgery info)
Total: 26 excel files, each with multiple sheets
Defining complete datasets
Wrote an R script (01_combine_year_separated_data.R) that automatically combined the data across years
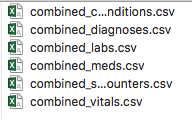
Several things made this tricky...
The different sheets had slightly different column names, so initially everything beyond the first sheet was missing
Filenames differed slightly by year:
-
2014: Prob_List.xlsx
-
2015: Prob_list.xlsx
-
2016: Problem_list.xlsx
-
2017: Problem_List.xlsx
In 2017 there were two vitals datasets: *Vitals.xlsx and *Vitals_2
Making sense of the data
Identifying data oddities
- There were four patients reported with SSI whose surgeries did not appear in the main data
- Missing surgery times in 13% of patients
- discussion and exploration revealed that UCD switched to an EPIC EHR system in July 2014 - no surgery times available prior to July 2014
- Diagnosis codes in the same column were a mixture of ICD9 and ICD10
- Mistakes in definitions in the codebook
- Lab values that are >10000 but should be in [0, 20]
Understanding ID variables
PATNUM: patient
ADMISSION_ENCNUM:
Hospitalization + surgery
ENCNUM: hospitalization


PROCID:
procedure undertaken
So what is the unit of interest?
ADMISSION_ENCNUM
PATNUM
ADMISSION_ENCNUM
ENCNUM
ENCNUM
ENCNUM
PROCID
PROCID
- labs
- meds
- diagnoses
- vitals
- labs
- meds
- diagnoses
- vitals
- labs
- meds
- diagnoses
- vitals
- surgery info
What ID should we use to join data?
PATNUM
Obtaining supplementary information
Collecting more data
Surgeon characteristics (age & experience)
Surgical category
Elixhauser categories of diagnoses
Medical definitions of normal lab ranges by gender
Medication categories
(Hopefully) medication dispensing time
Deciding on the modeling approach
Traditional modeling approaches
| Surgical encounter ID | Procedure | Average serum creatinine 1 week pre-surgery | Minimum white blood cell count 1 week pre-surgery | Maximum temperature 2 days pre-surgery | antibiotics prescribed 1 day pre-surgery | SSI |
|---|---|---|---|---|---|---|
| 1 | Cardiac surgery | 0.4 | 7.9 | 98.2 | TRUE | FALSE |
| 2 | Colon surgery | 3.3 | 12.1 | 99.1 | FALSE | FALSE |
| 3 | Spinal fusion | 2.1 | 6.8 | 102.3 | FALSE | TRUE |
| 4 | Cesarean section | 1.4 | 8.3 | 97.4 | FALSE | FALSE |
| 5 | Abdominal surgery | 2.0 | 8.1 | 98.9 | TRUE | FALSE |
| 6 | Rectal surgery | 2.9 | 10.0 | 100.2 | FALSE | FALSE |
| 7 | Colon surgery | 1.5 | 12.5 | 101.1 | FALSE | TRUE |
Logistic regression, random forest, etc
Need to have well-defined predictor variables
Deep Learning modeling approaches
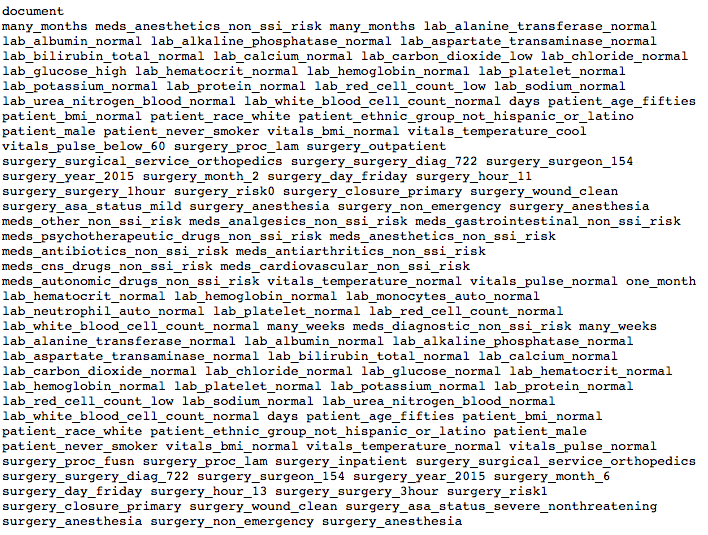
train/ssi/33098396_19385283.txt
Deep Learning modeling approaches
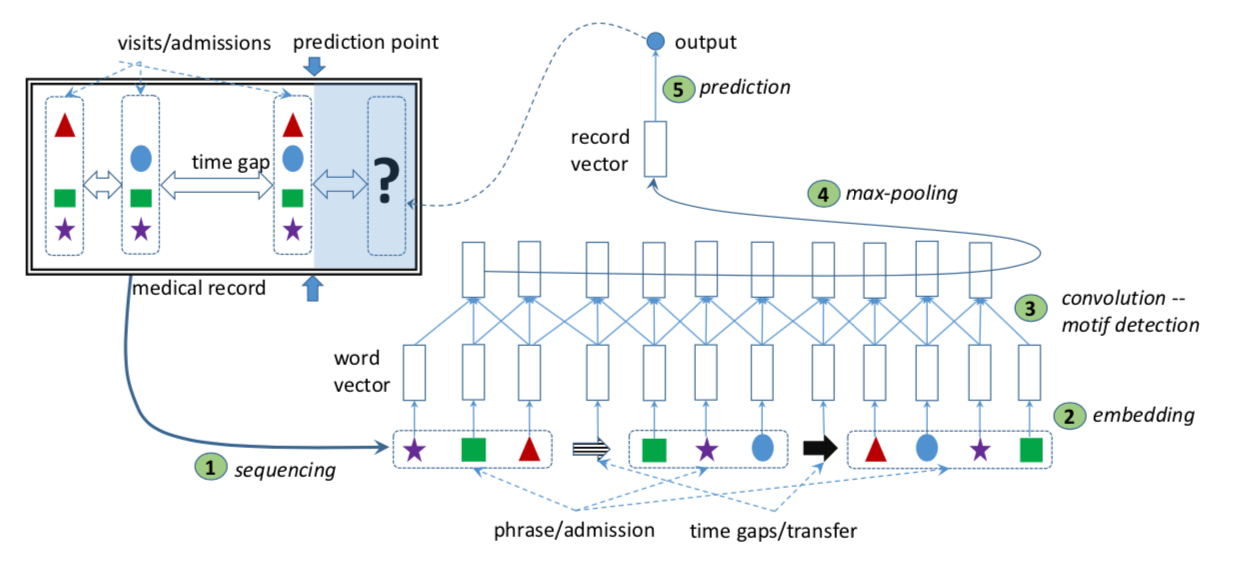
Nguyen et al. (2016), Deepr
"Normal profile" idea

A journey towards predicting infection
By Rebecca Barter


