
Tutorial by
Rebecca Barter
Interactivity
&

@rlbarter

rlbarter
Link to slides:
Website:
rebeccabarter@berkeley.edu
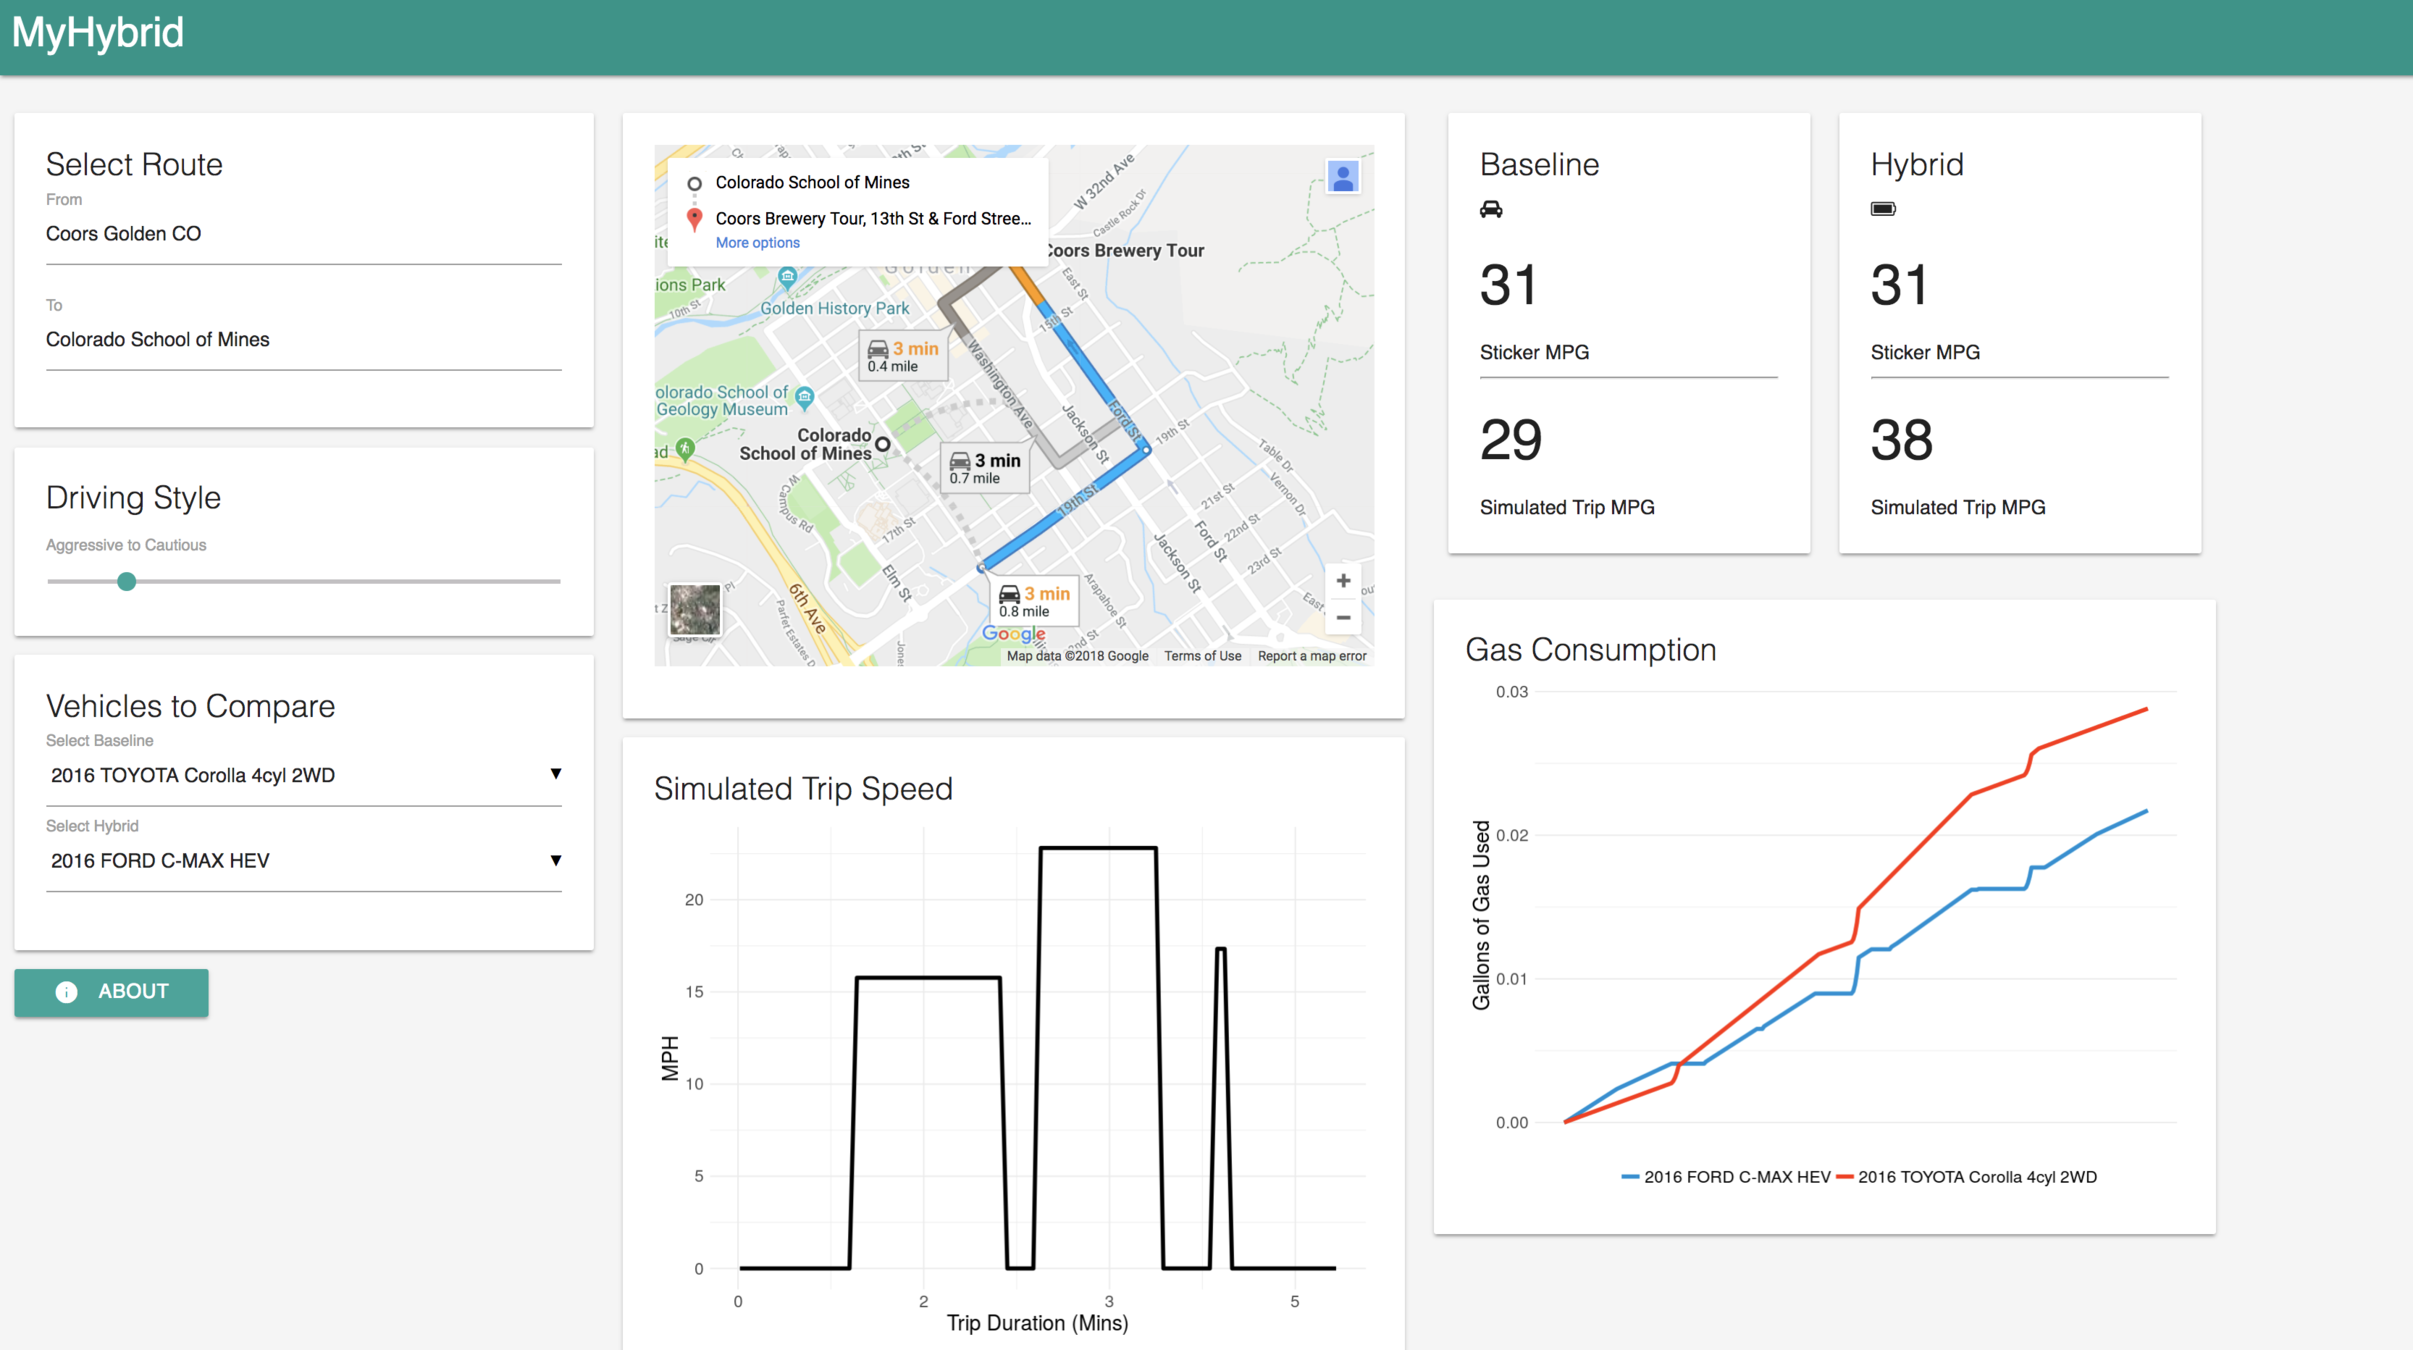
Link to example app:
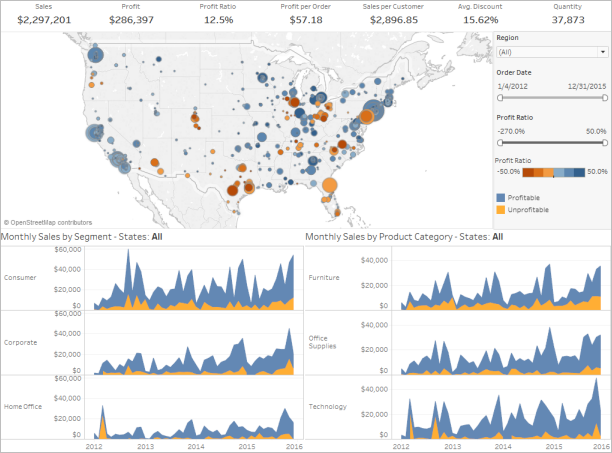
To be interactive or... not to be interactive
Tell a story from the data
Let the audience explore the data


Static visualization better
Interactive visualization better
So you want to be interactive...


Plotly
Flexdashboards
Shiny barebones
User interface (UI)
the web page that shows the app to the user
Server
the computer that powers the app
Every Shiny app has two parts
Starting a new shiny project
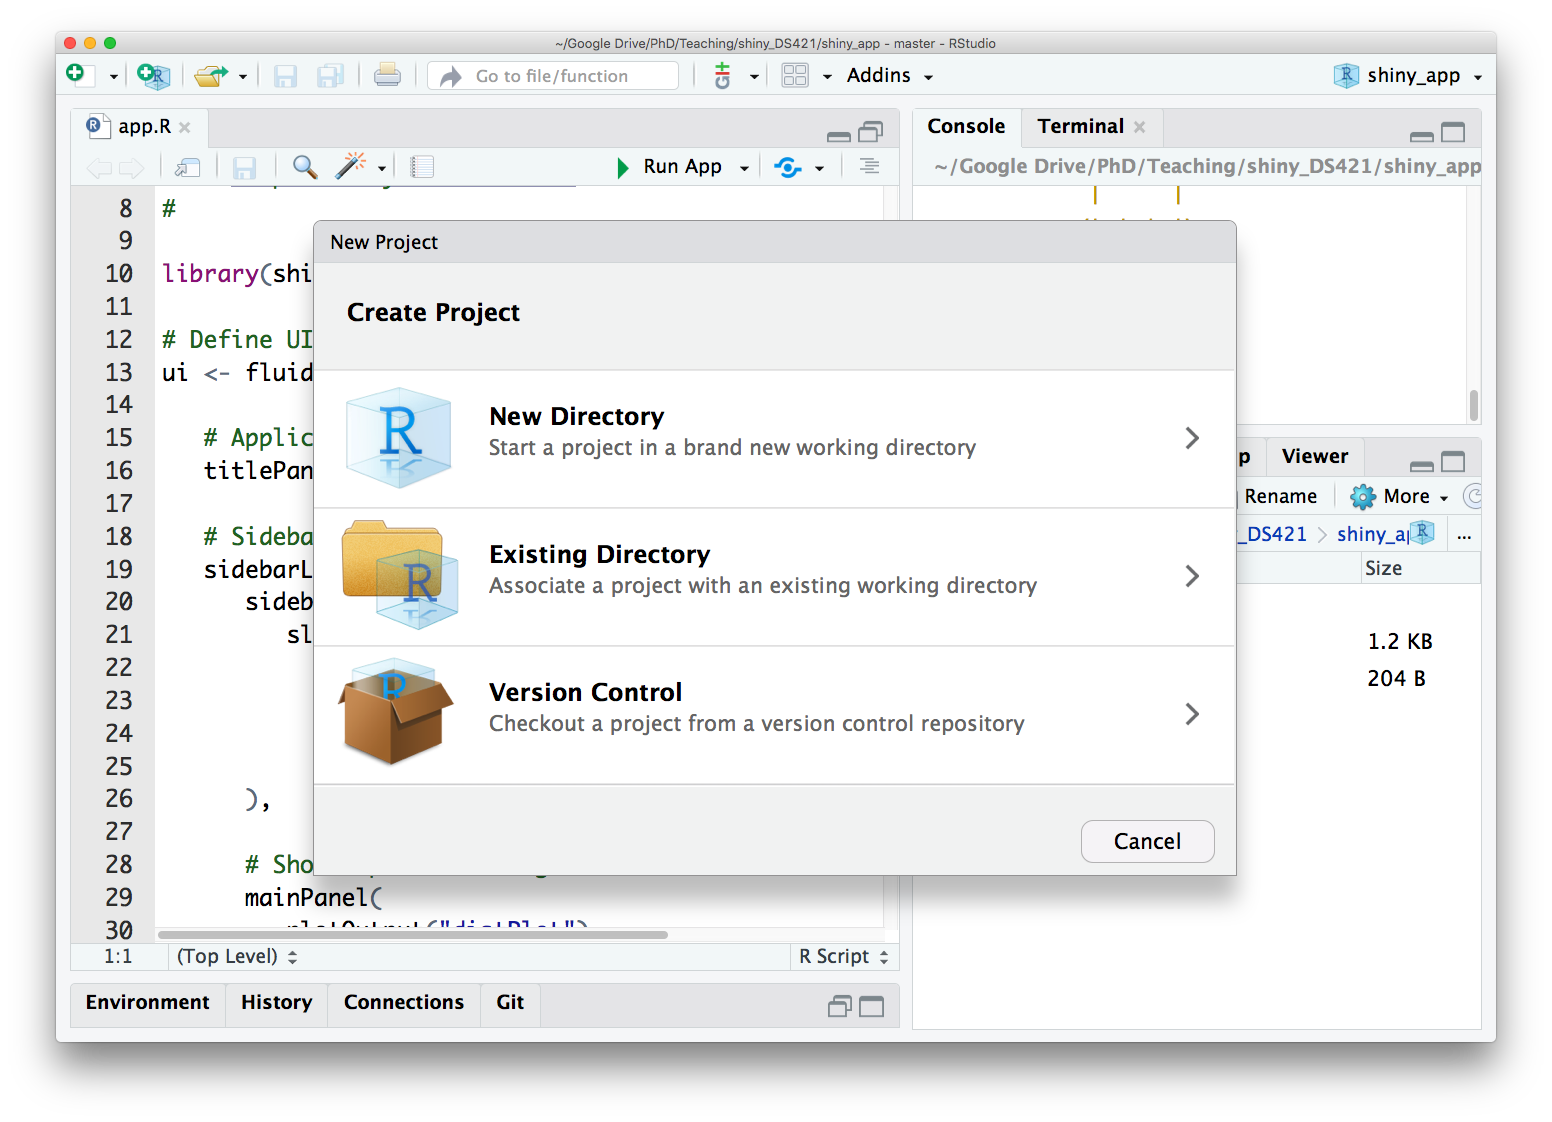
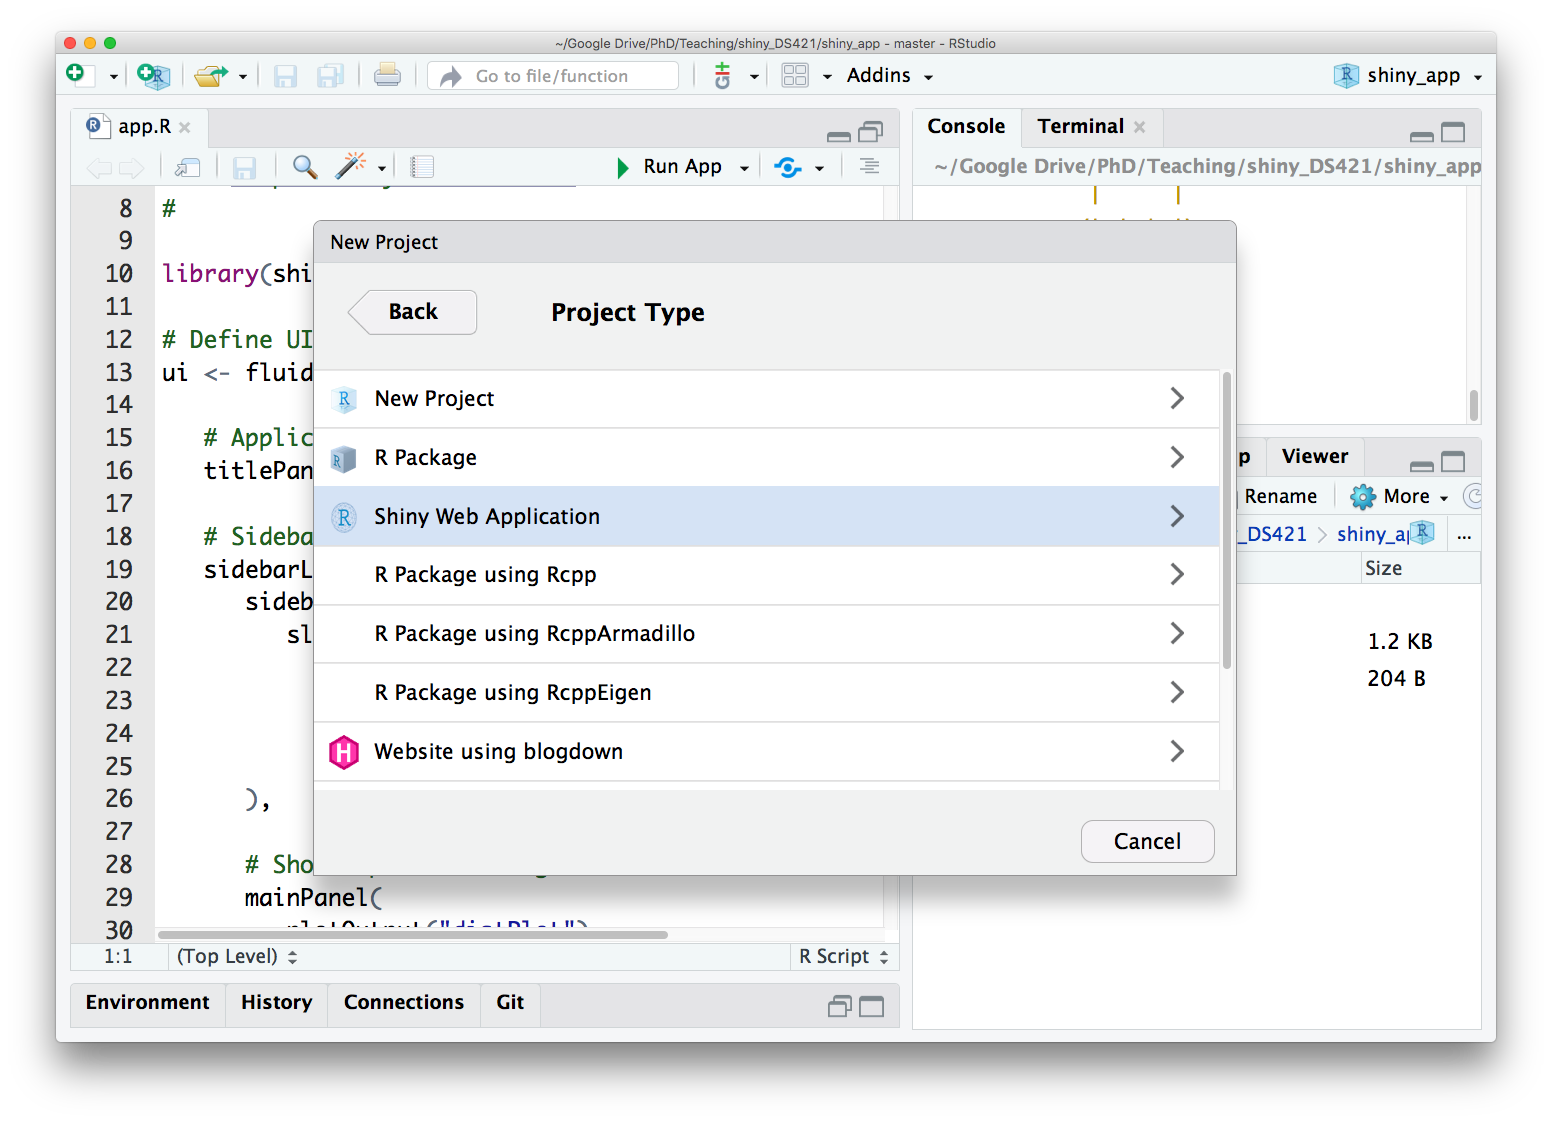
app.R
library(shiny)

# Define UI
ui <- fluidPage(


)

# Code that takes inputs from UI and outputs plots, tables, etc
server <- function(input, output) {


}

# Run the application
shinyApp(ui = ui, server = server)
UI:
Describes the webpage
(what goes where)
Server:
R code for generating plots and tables under the hood
Runs the app
library(shiny)
# Define UI for application that draws a histogram
ui <- fluidPage(
# Application title
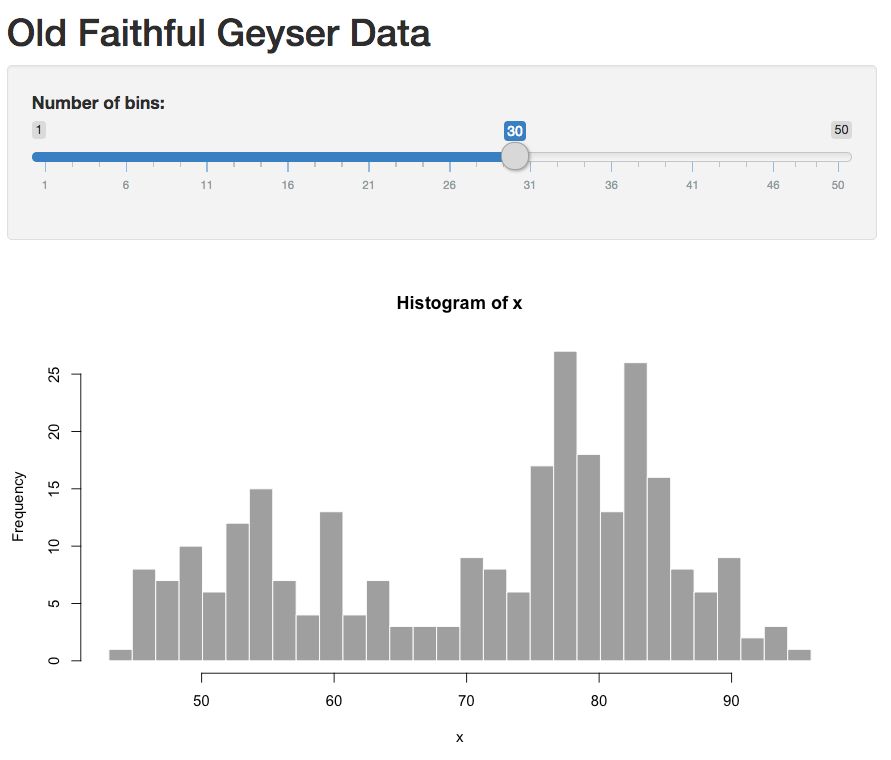
titlePanel("Old Faithful Geyser Data"),
# Sidebar with a slider input for number of bins
sidebarLayout(
sidebarPanel(
sliderInput("bins",
"Number of bins:",
min = 1,
max = 50,
value = 30)
),
# Show a plot of the generated distribution
mainPanel(
plotOutput("distPlot")
)
)
)
# Define server logic required to draw a histogram
server <- function(input, output) {
output$distPlot <- renderPlot({
# generate bins based on input$bins from ui.R
x <- faithful[, 2]
bins <- seq(min(x), max(x), length.out = input$bins + 1)
# draw the histogram with the specified number of bins
hist(x, breaks = bins, col = 'darkgray', border = 'white')
})
}
# Run the application
shinyApp(ui = ui, server = server)
app.R
library(shiny)

# Define UI for application that draws a histogram
ui <- fluidPage(

   # Application title
   titlePanel("Old Faithful Geyser Data"),

   # Sidebar with a slider input for number of bins
   sidebarLayout(
      sidebarPanel(
         sliderInput("bins",
                     "Number of bins:",
                     min = 1,
                     max = 50,
                     value = 30)
      ),

      # Show a plot of the generated distribution
      mainPanel(
         plotOutput("distPlot")
      )
   )
)

# Define server logic required to draw a histogram
server <- function(input, output) {

   output$distPlot <- renderPlot({
      # generate bins based on input$bins from ui.R
      x    <- faithful[, 2]
      bins <- seq(min(x), max(x), length.out = input$bins + 1)

      # draw the histogram with the specified number of bins
      hist(x, breaks = bins, col = 'darkgray', border = 'white')
   })
}

# Run the application
shinyApp(ui = ui, server = server)
Inputs
Outputs
Let's make a shiny app!
We will pretty much follow:
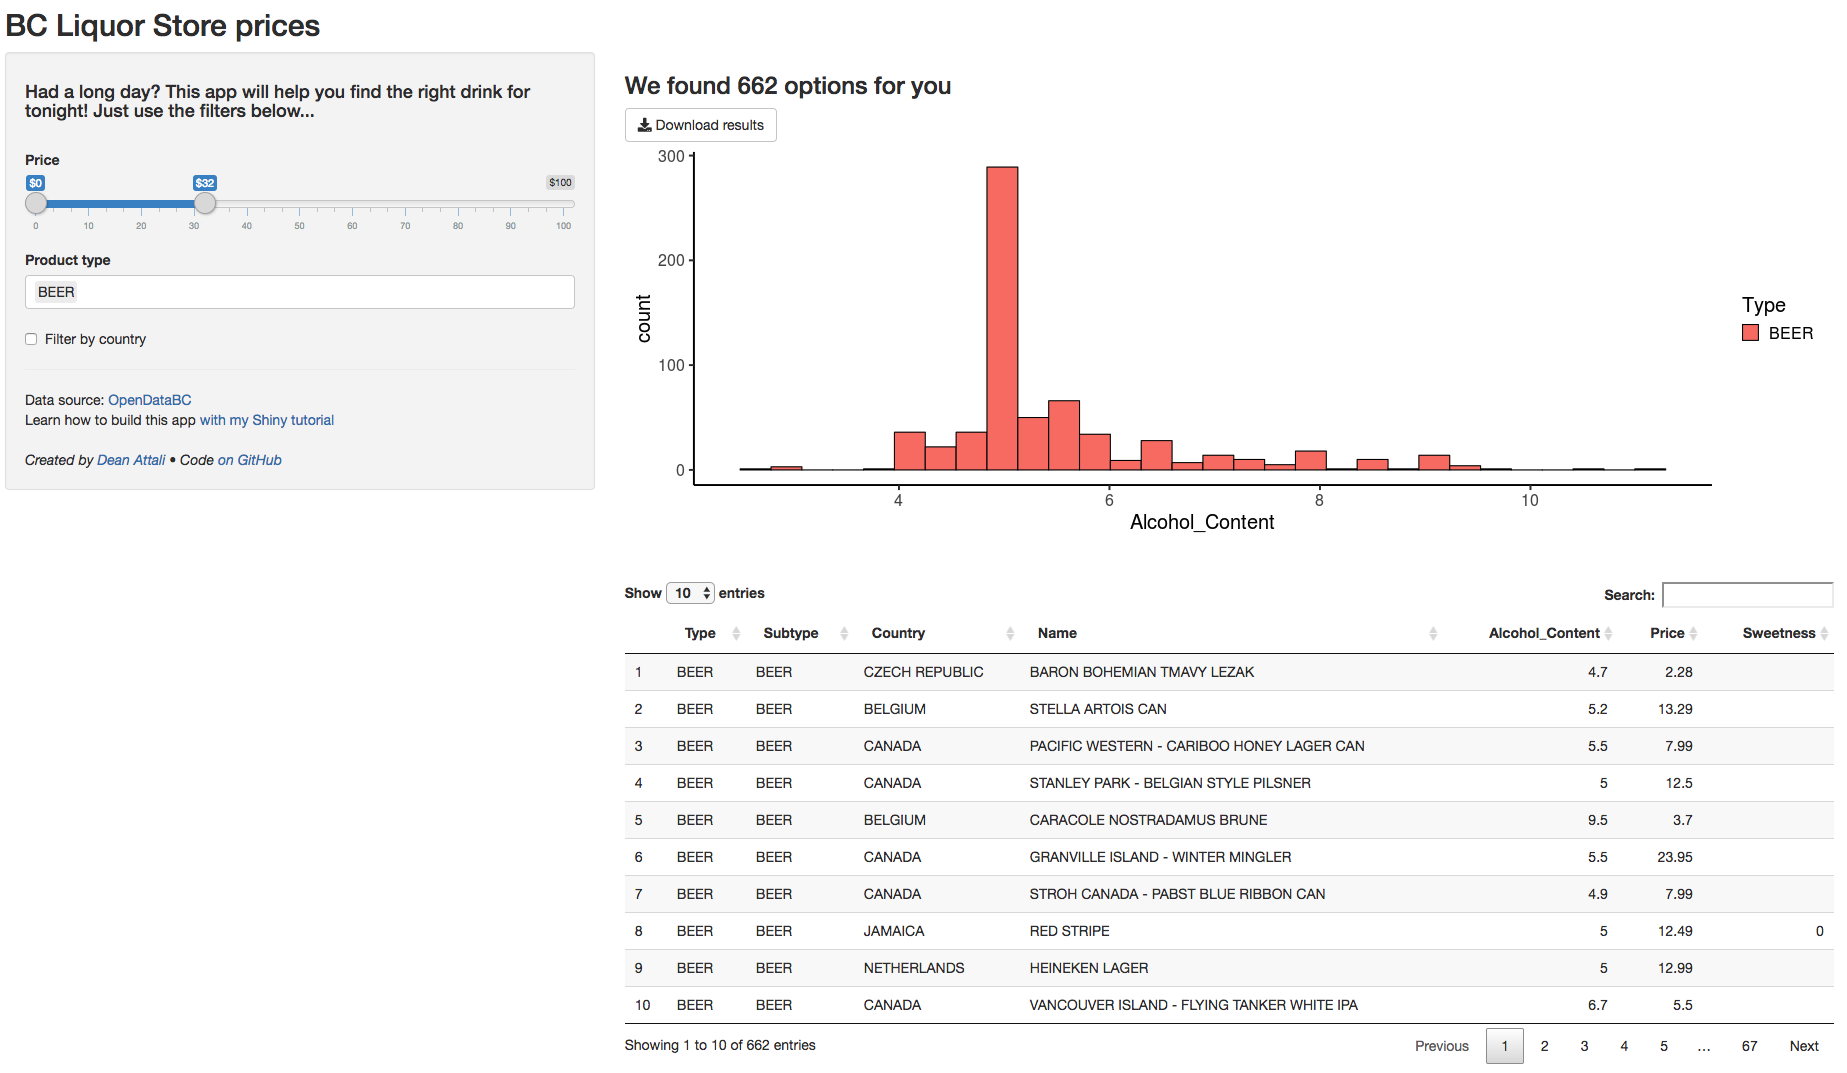
https://deanattali.com/blog/building-shiny-apps-tutorial/
https://daattali.com/shiny/bcl/
Reactivity
Reactive variables can only be used inside "reactive contexts"
input
Examples of reactive variables:
Examples of reactive contexts:
renderPlot()
reactive()
observe()
what is the value of y?
anything from the list
any object defined based on values from the list
> x <- 5
> y <- x + 10
> x <- 10
> y
input
Note: to access a reactive variable, it must be followed by parentheses "()"
Speeding up shiny
Make sure you are doing most computation outside of the shiny app itself
Shiny
By Rebecca Barter


