COMP2511 Week 8
Agenda
- Admin Stuff
- Introduction to Software Architecture
- C4 Models
- Sequence Diagrams
Admin Stuff
- Assignment 1 marks will be released
- You can view feedback on the FEEDBACK branch on your repo in the
Feedback.mdfile
- You can view feedback on the FEEDBACK branch on your repo in the
- For Assignment 2, Part 2 is submitted on Moodle, similar to Lab08.
Admin Stuff
- Lab09 is an attendance lab which means that attendance is mandatory in order to get marks
- There will be an in-person sample exam for Lab10 using the exam environment.
- The aim is for you to get familiar with the exam environment, layout and format for the exam.
Software Architecture
Software Architecture
Software Architecture
Software architecture defines the fundamental high-level structure of a software system.
It defines how system components are structured, how they interact and the guiding characteristics that shape its evolution.
We will be on to a new topic and learning software architecture for the rest of the course!
Software Architecture
So, how is software architecture different to the software design that we have been learning so far in this course?
So far, we have dealt with software design at a code-level, think about how individual parts of a system are implemented (i.e. classes, methods, controllers and design patterns)
Architecture operates at more macro-level, system-wide and involve more structural decisions of a system that take more effort to change. Typically involve multiple components or subsystems.
Services communicate via RESTful APIs
Observer pattern to update UI when data changes
vs.
Architectural
Design
Software Architecture
Specifically, it focuses on:
-
How the system is divided into modules, services, and layers for the frontend, backend, database, etc.
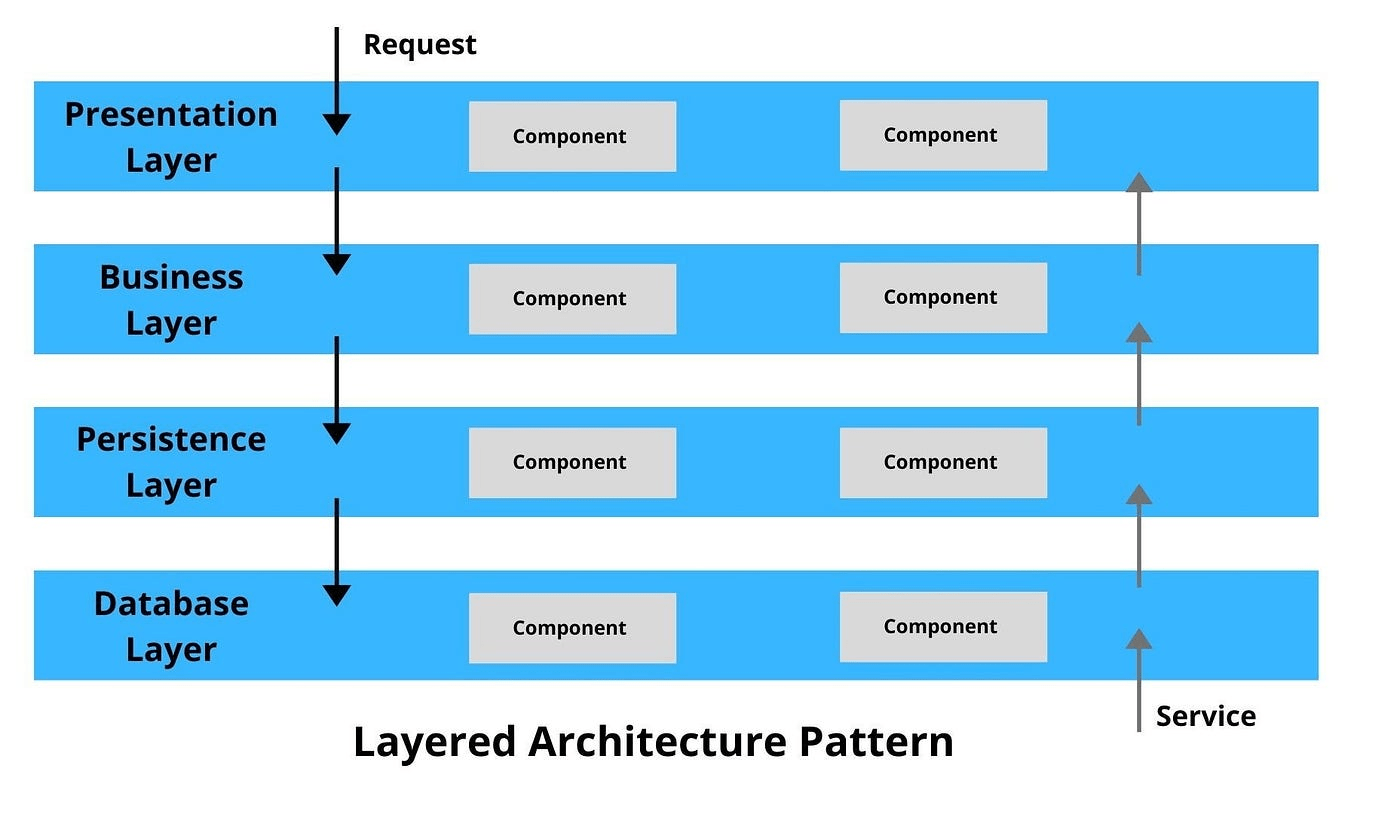
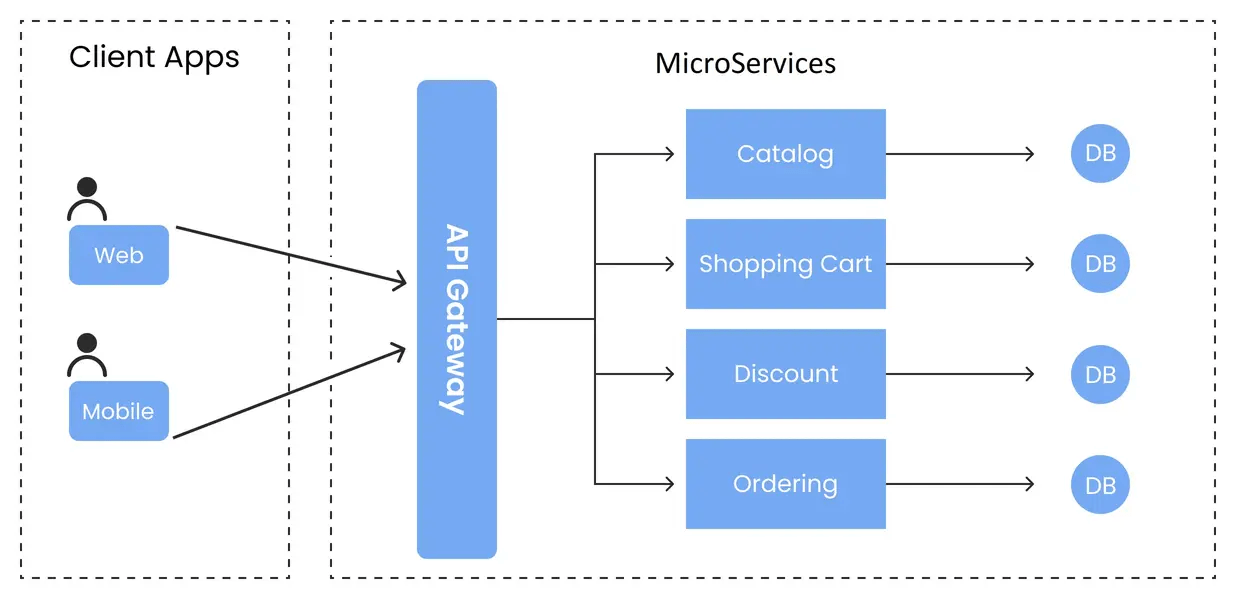
Layered
Microservices
We will learn more about this next week!
Software Architecture
Specifically, it focuses on:
-
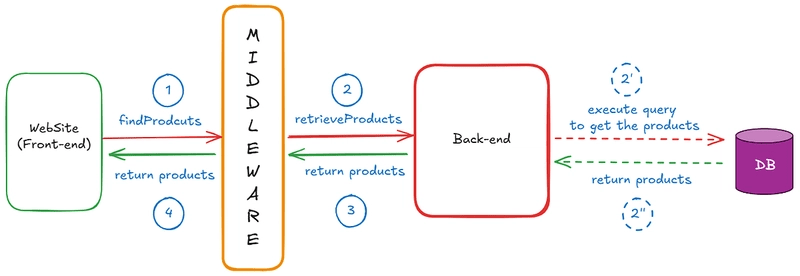
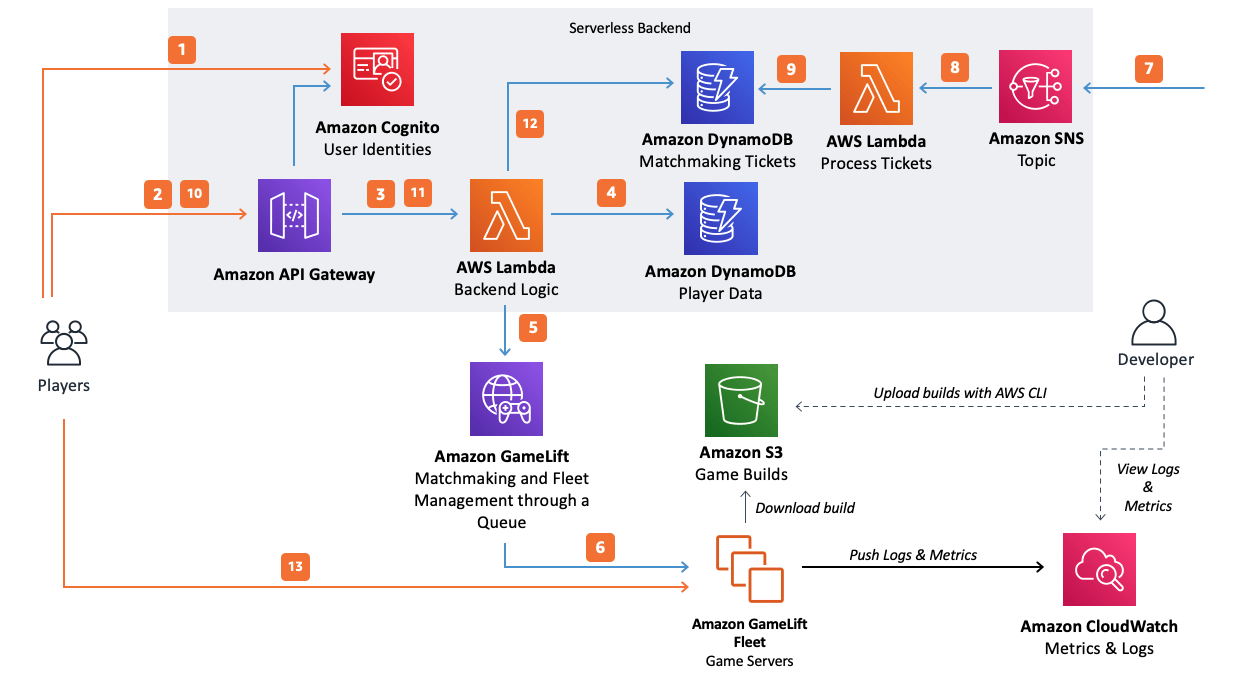
How data flows between different components
Software Architecture
Specifically, it focuses on:
-
What technologies, frameworks or infrastructure are used
Examples include:
- Frontend: React, Angular, Next.js
- Backend: Node.js, Flask, Spring Boot
- Data Storage: PostgreSQL (relational), MongoDB (noSQL), AWS S3 (Cloud Provider)
- Infrastructure: AWS, Google Cloud, etc.
Software Architecture
Specifically, it focuses on:
-
Architectural characteristics that should be addressed (e.g. security, scalability, performance, etc.)
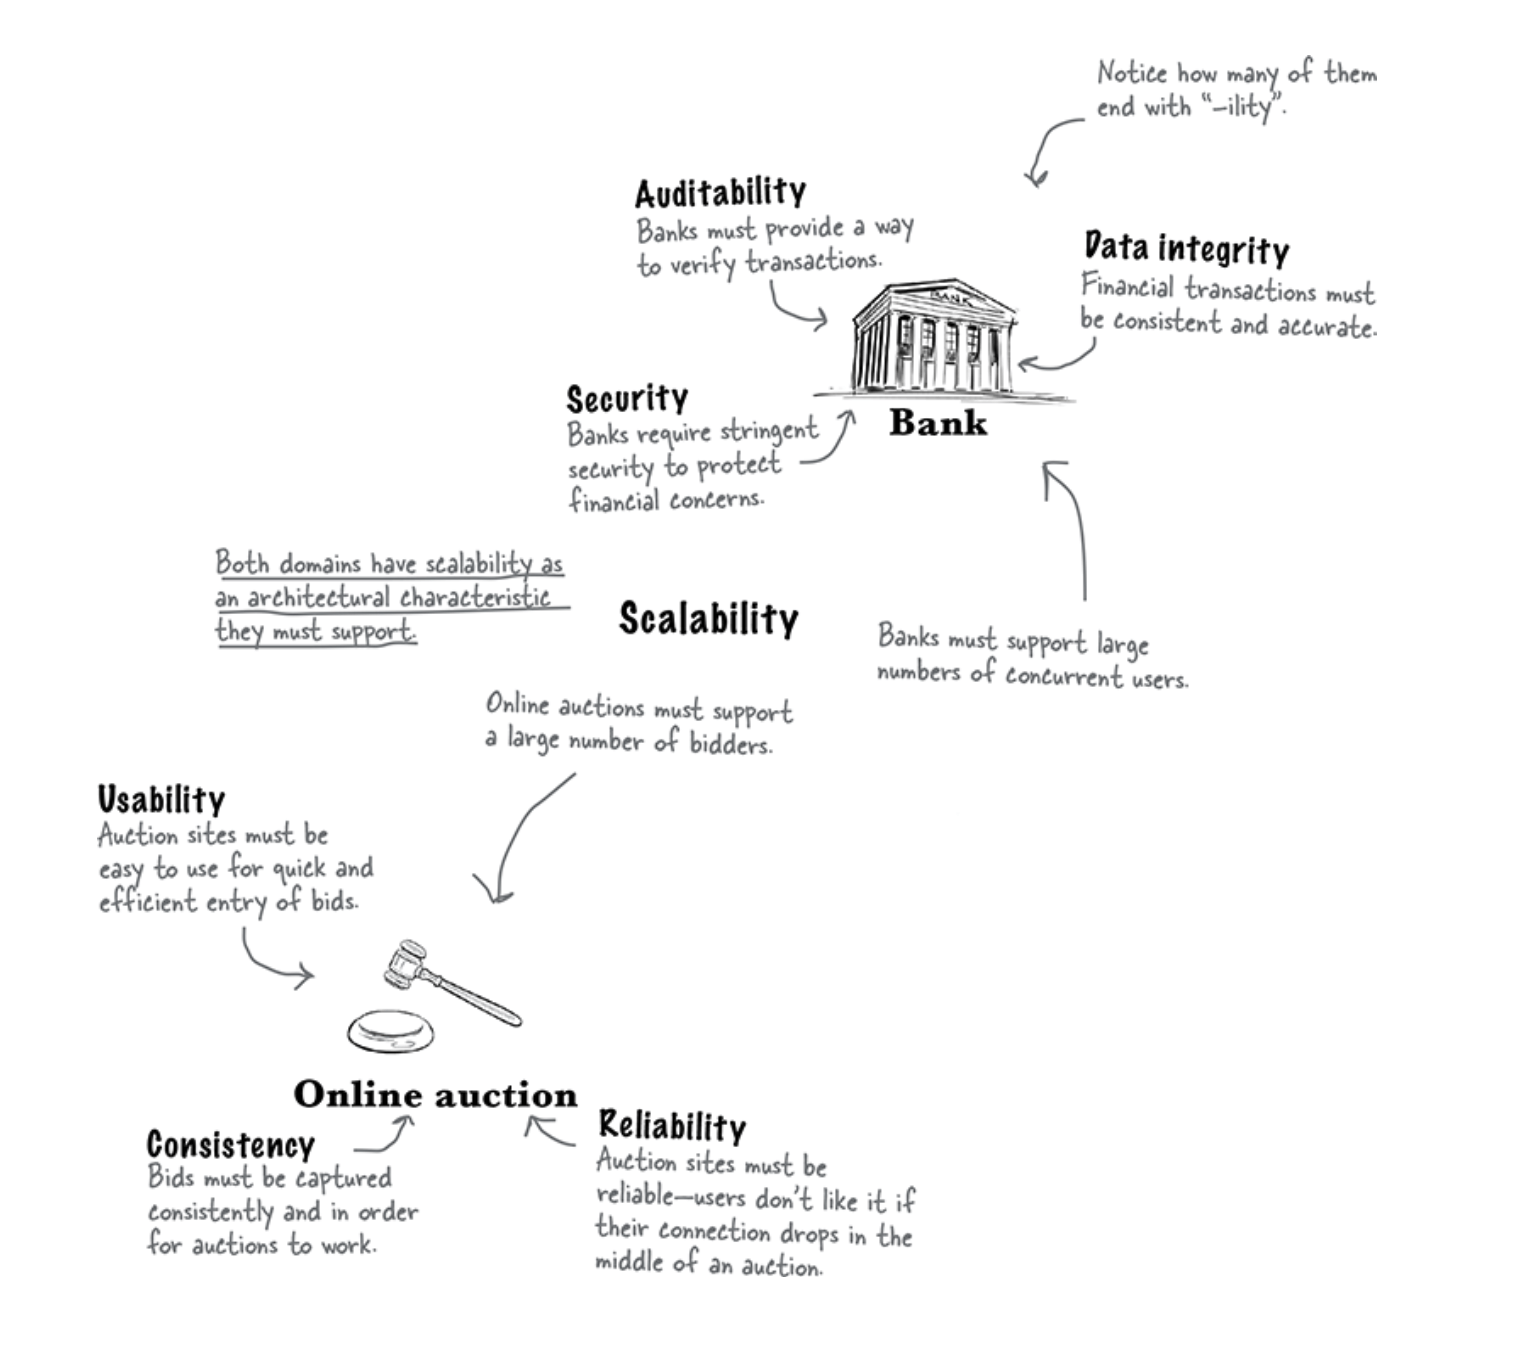
We will learn more about this next week!
Software Architecture is like designing a blueprint for a garden.

Architectural style → Overall layout of a garden
Architectural components → Grouping of like plants
Class files in components → Individual plants within a group
Gardens are influenced by weather in the same way a software architecture is influenced by changes in
technology, deployment, etc.
Software Architecture
Why is it so important to learn software architecture?
- Helps manage complexity especially with large systems, dividing it into manageable, understandable parts.
- Software is never static, it always grows, adapts and changes according to new requirements and the architecture can guide the technical vision and direction of teams in the long-term.
C4 Model
C4 Model
Helps teams visualise and communicate the software architecture of a system at different levels of abstraction.
- Bridges the gap between high-level system overviews and low-level code detail, ensuring alignment between stakeholders, developers and architects
Four Core Diagrams
The C4 Model includes 4 core diagrams:
- Context
- Container
- Component
- Code
These diagrams are a way to create "maps of your code" at different levels of detail, like zooming in and out on Google Maps
Level 1: Context Diagram
Shows the system as a "box" and its interactions with users and external systems (i.e. provides context surrounding the system)
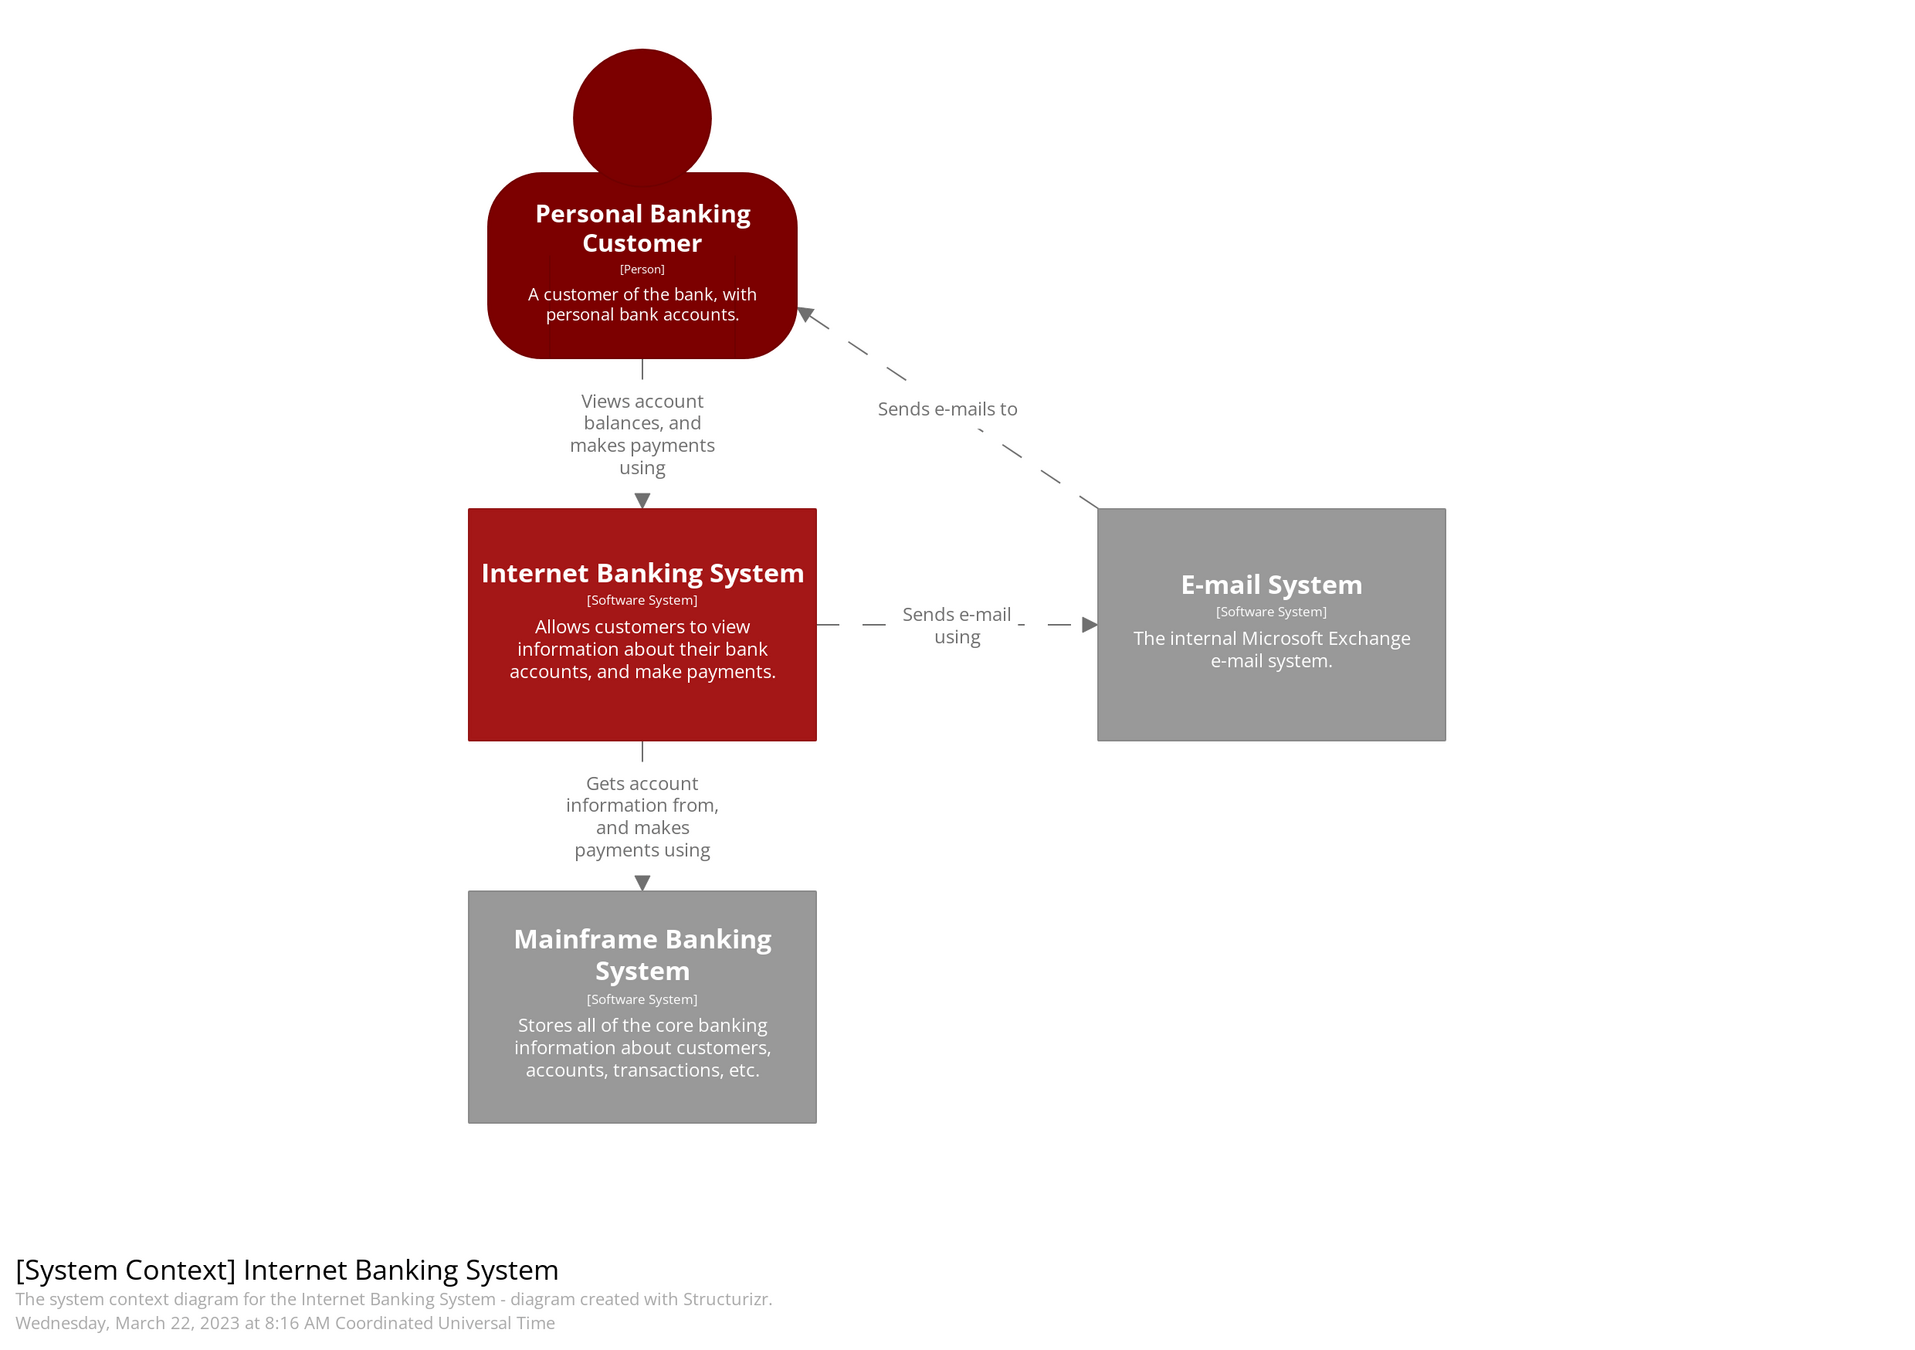

We can see the external users and systems represented as the different countries
Who is the intended audience for the Context Diagram in the C4 model?
Level 1: Context Diagram
- Non-technical stakeholders (e.g., business sponsors, product owners)
- External users or clients
- Enterprise architects
- Anyone who needs to understand what the system is, what it interacts with, and who uses it
It communicates the scope and external dependencies of the system in a simple and accessible way.
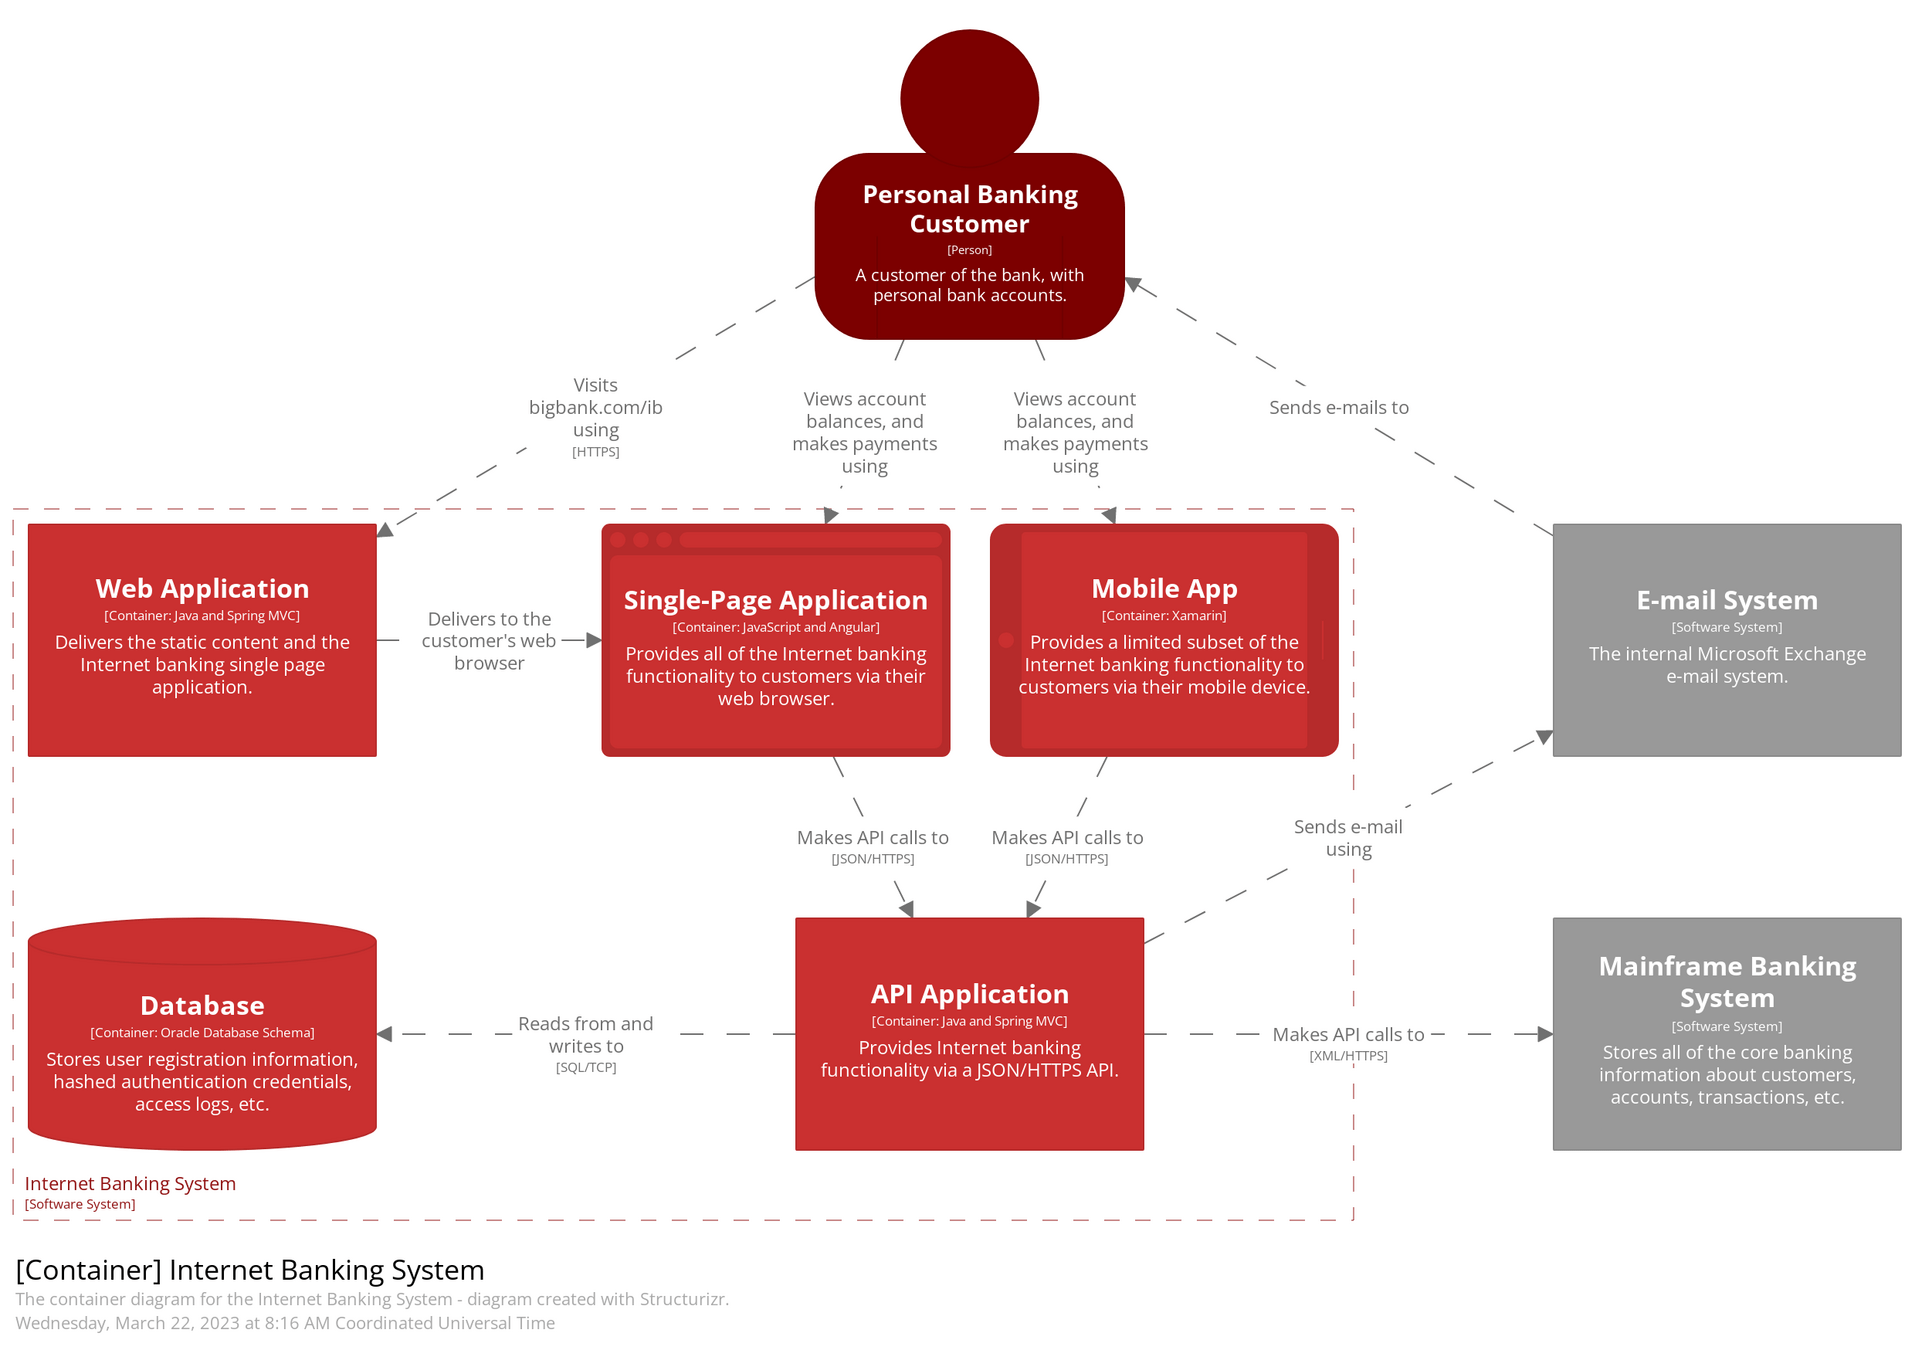
Level 2: Container Diagram
Breaks the system into containers (applications/services/databases) and shows how they interact.

Level 2: Container Diagram
Why separate the web frontend and backend service into different containers?
- Separation of concerns: UI logic is handled in the frontend; business logic and data processing in the backend.
- Independent deployment: You can update the frontend without touching the backend and vice versa.
- Scalability: Backend and frontend can be scaled independently depending on load.
- Technology flexibility: Different teams can use the most suitable tech stacks for each (e.g., React frontend + Node.js backend).
- Security: Backend can be isolated in a secure environment, while frontend runs in browsers.
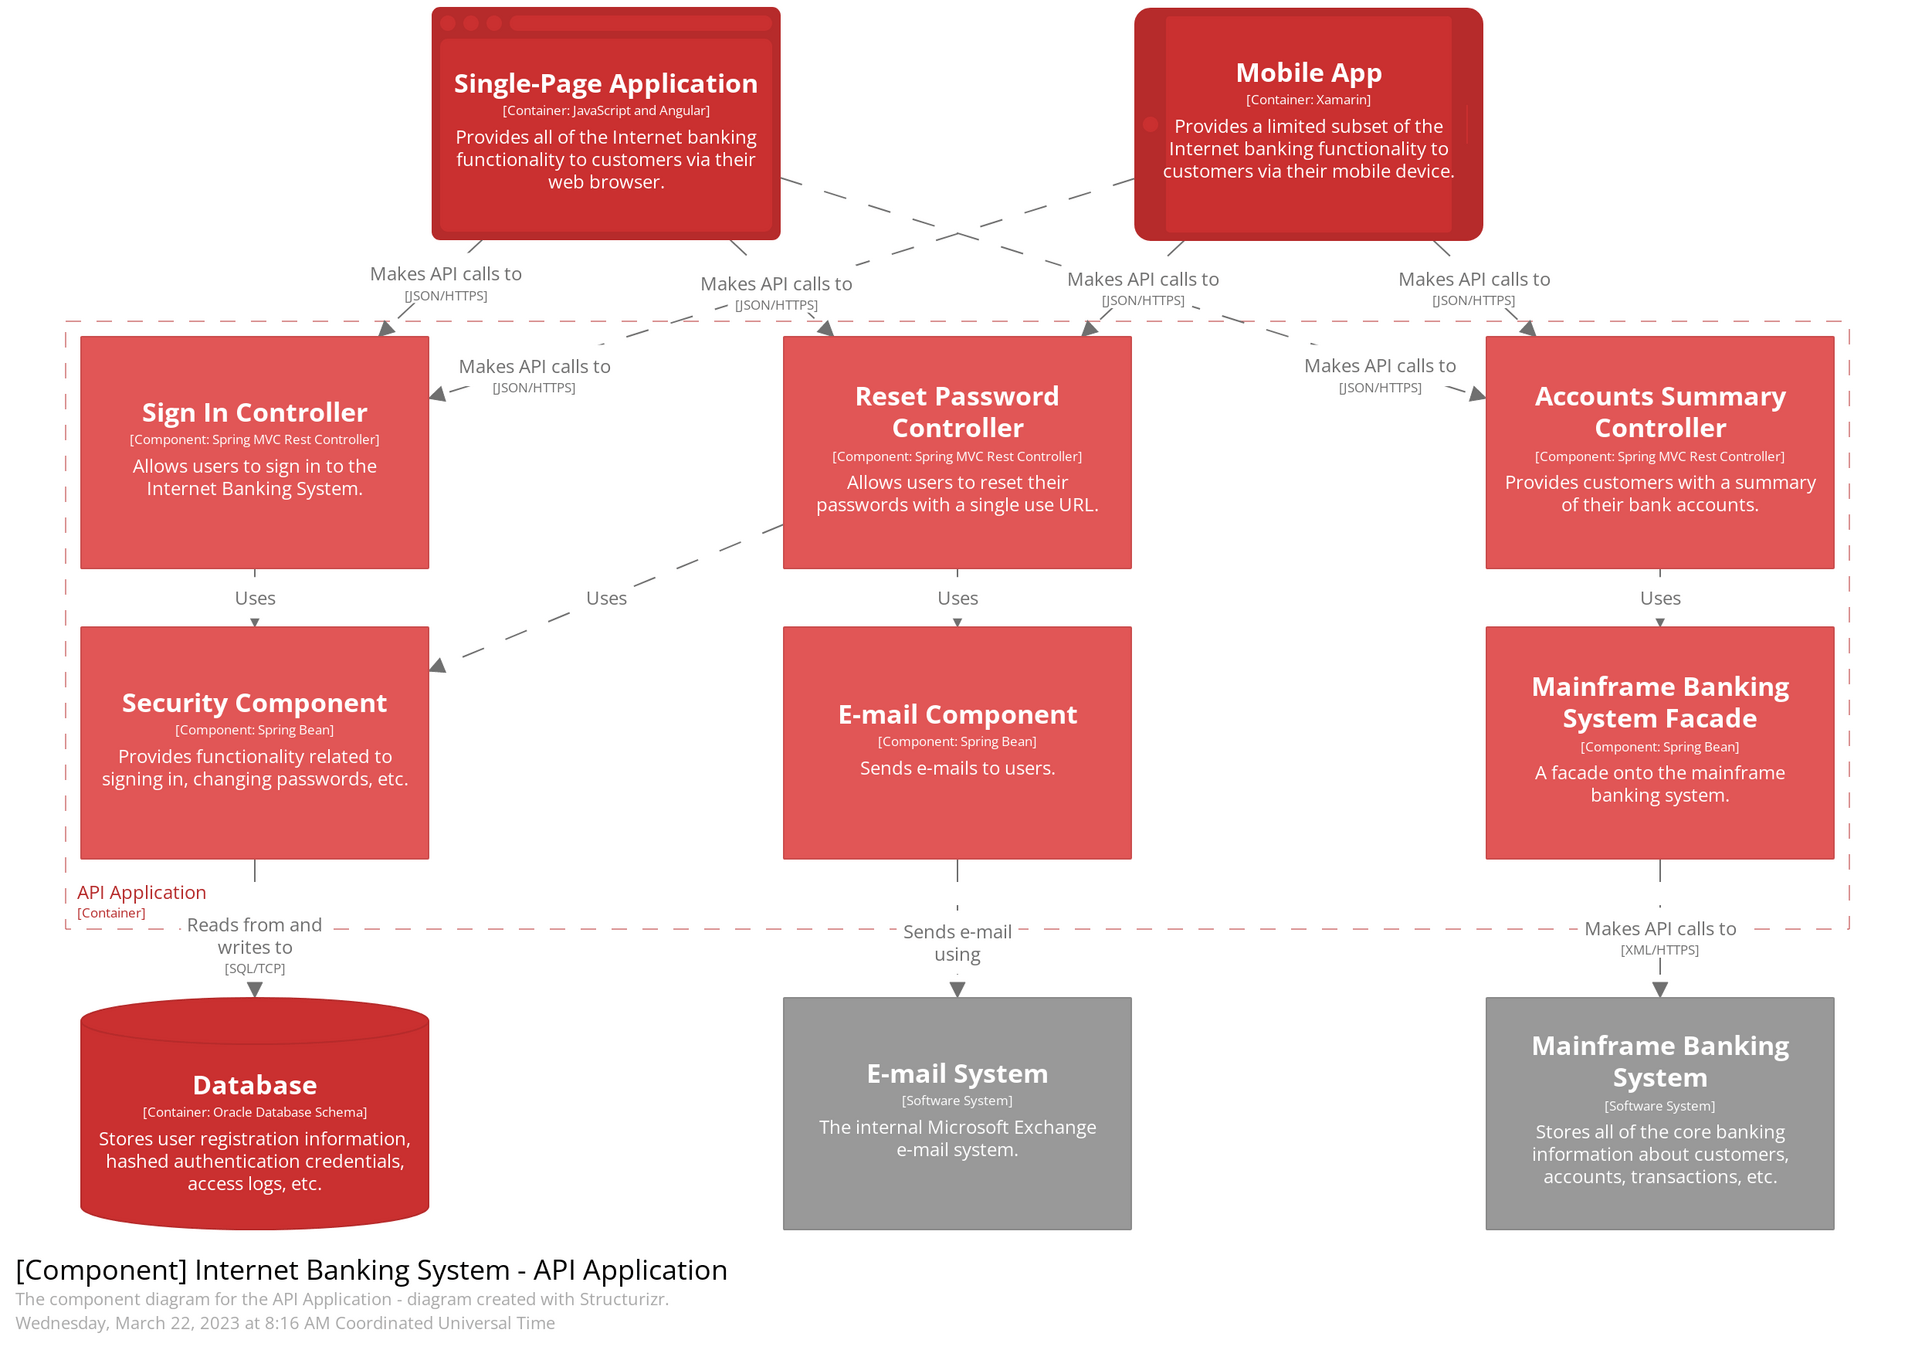
Level 3: Component Diagram
Zooms into a specific container to show its internal components/controllers and their relationships.

Level 3: Component Diagram
How does a Container Diagram differ from a Component Diagram?
Container
Component
- Focuses on the major deployable units (web apps, mobile apps, APIs, databases, microservices, etc.) within the system.
- Shows how containers communicate.
- Helps in deployment and infrastructure planning.
- Zooms into one container (like a backend service) and shows its internal components/modules, e.g., service classes, controllers, or data access layers.
- Useful for developers to understand internal design and division of responsibilities.
Level 4: Code (Class) Diagram
Offers a detailed view of the source code structure (e.g., classes and interfaces) within a component.
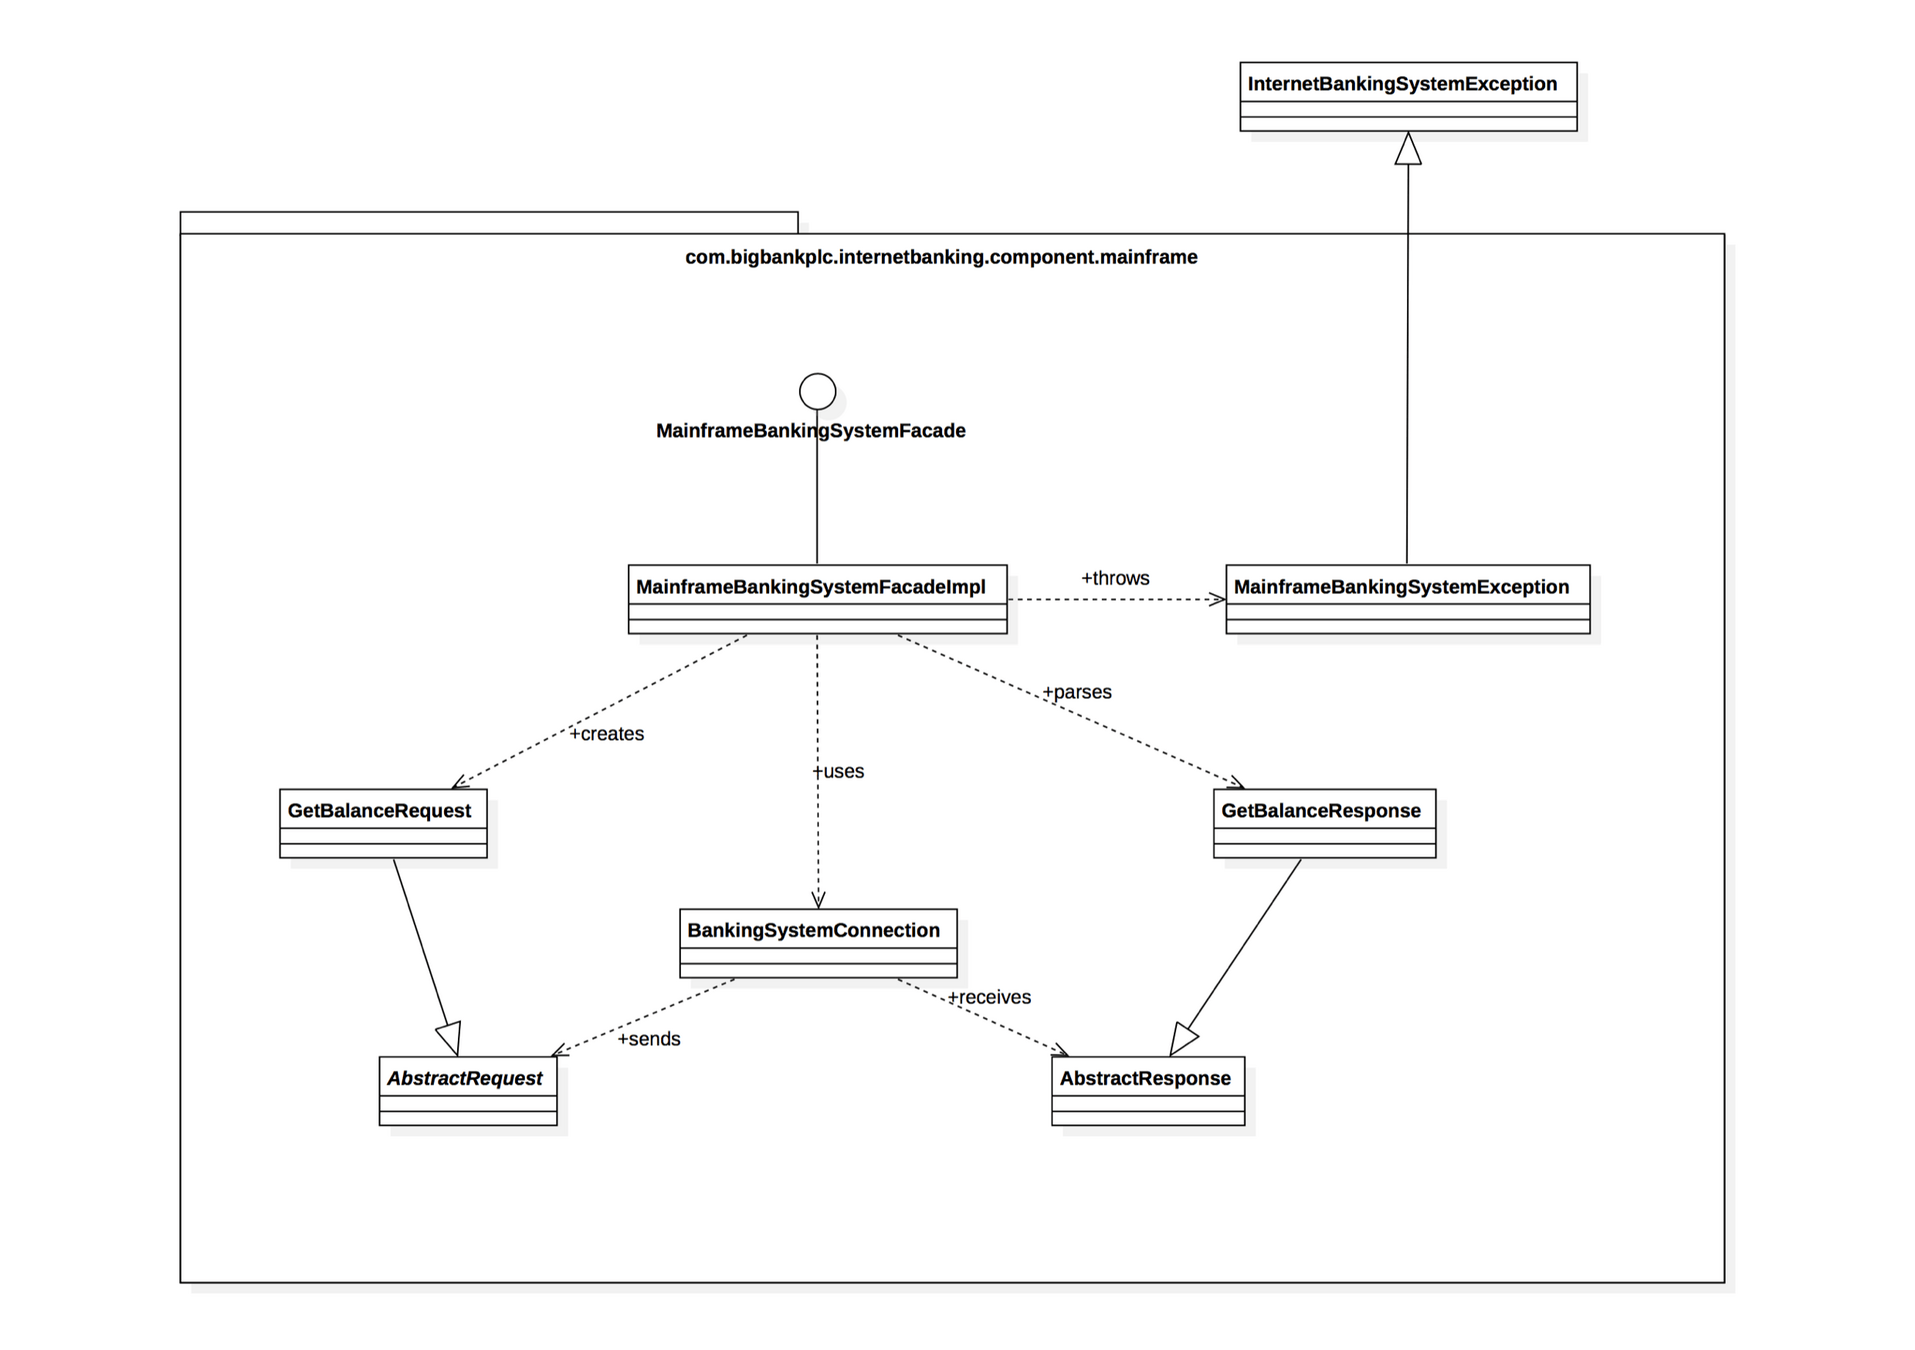
Our UML diagrams :)
C4 Model Demo on Excalidraw
C4 Model Demo on Excalidraw
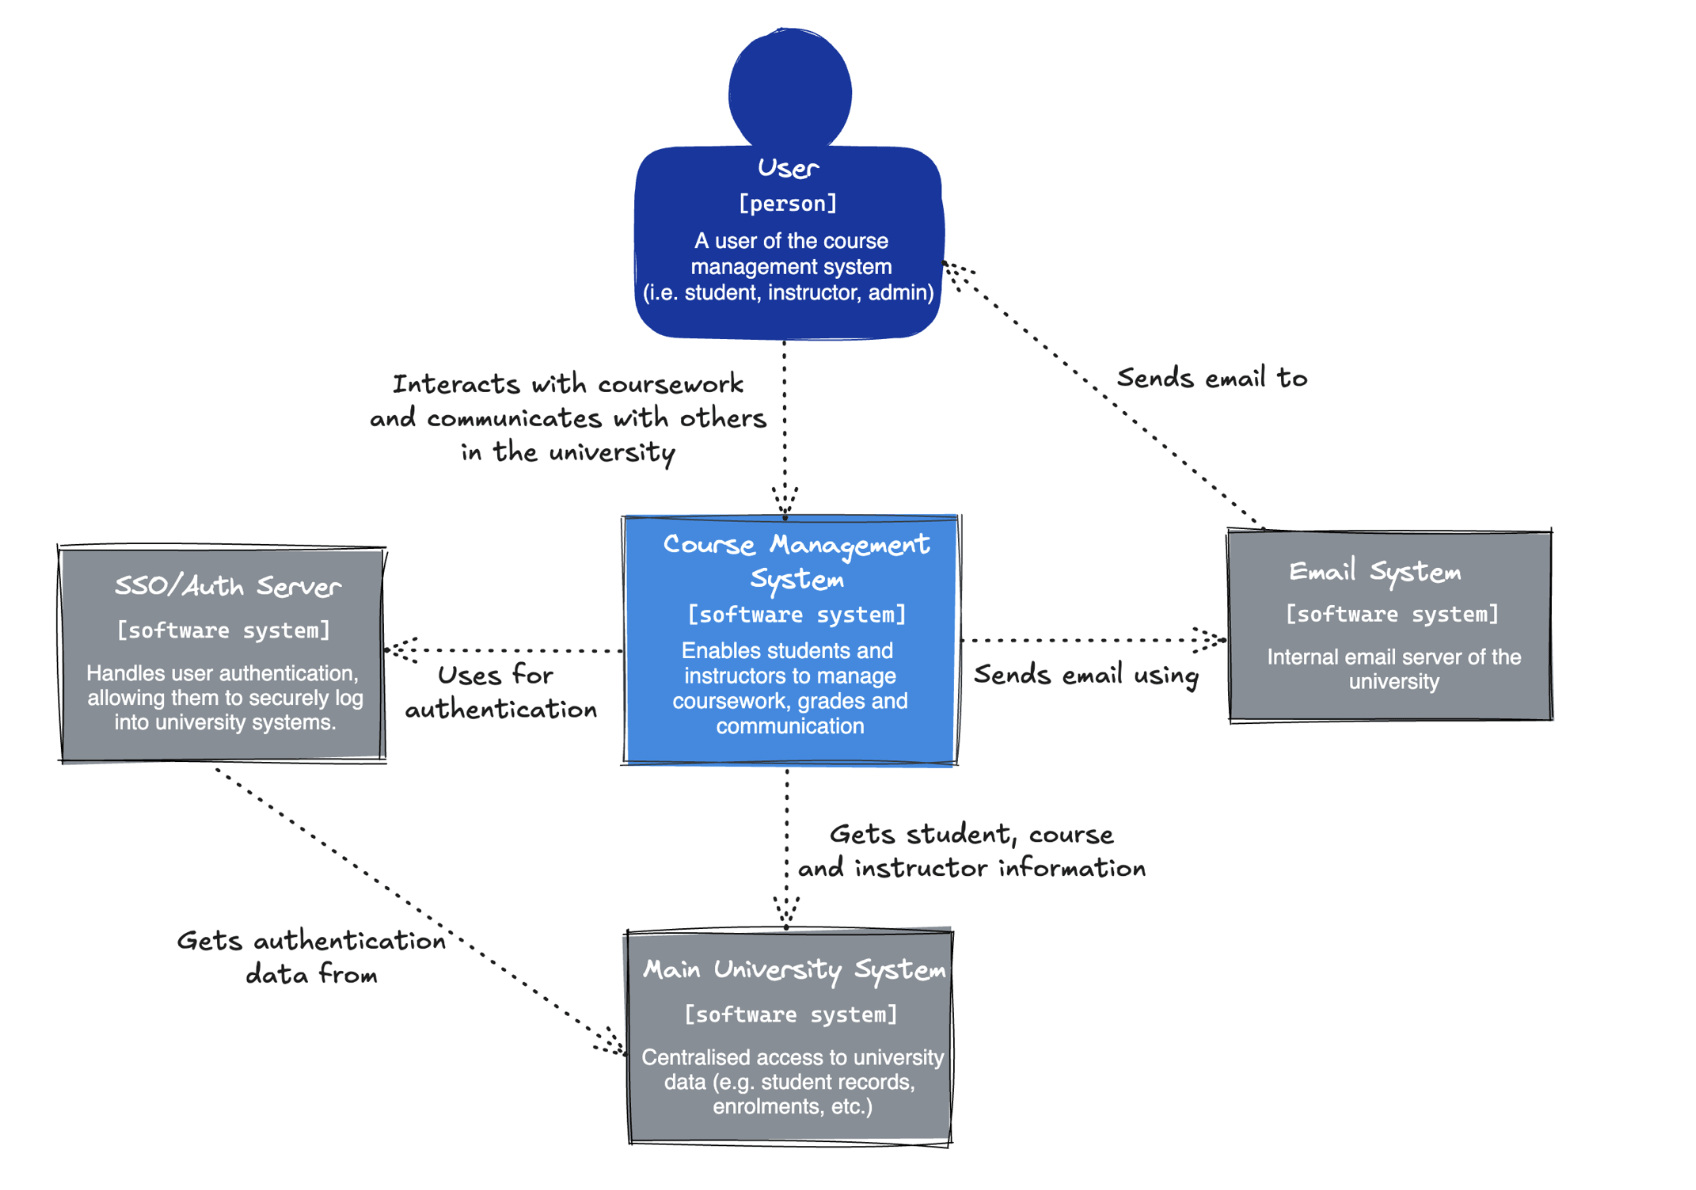
Context Diagram
C4 Model Demo on Excalidraw
Currently, all functionality of the Course Management System is implemented within a single monolithic backend. What might be the benefits of splitting this monolith into smaller, independent services?
How could we divide the system’s functionality to achieve better modularity, cohesion, and scalability?
Sequence Diagrams
Sequence Diagrams
A sequence diagram is an interaction diagram showing the temporal order of interactions between objects or components to achieve a specific functionality or use case
- Show how operations are carried out through message exchanges
- Excellent for visualising the flow of control and messages over time.
Sequence Diagrams
When would you choose to use a Sequence Diagram instead of a UML Class Diagram?
- UML diagrams are when you want to show the static structure of a system including classes, attributes, methods and relationships (agg, comp, etc.)
- UML describes what the system is made of, not how it behaves over time
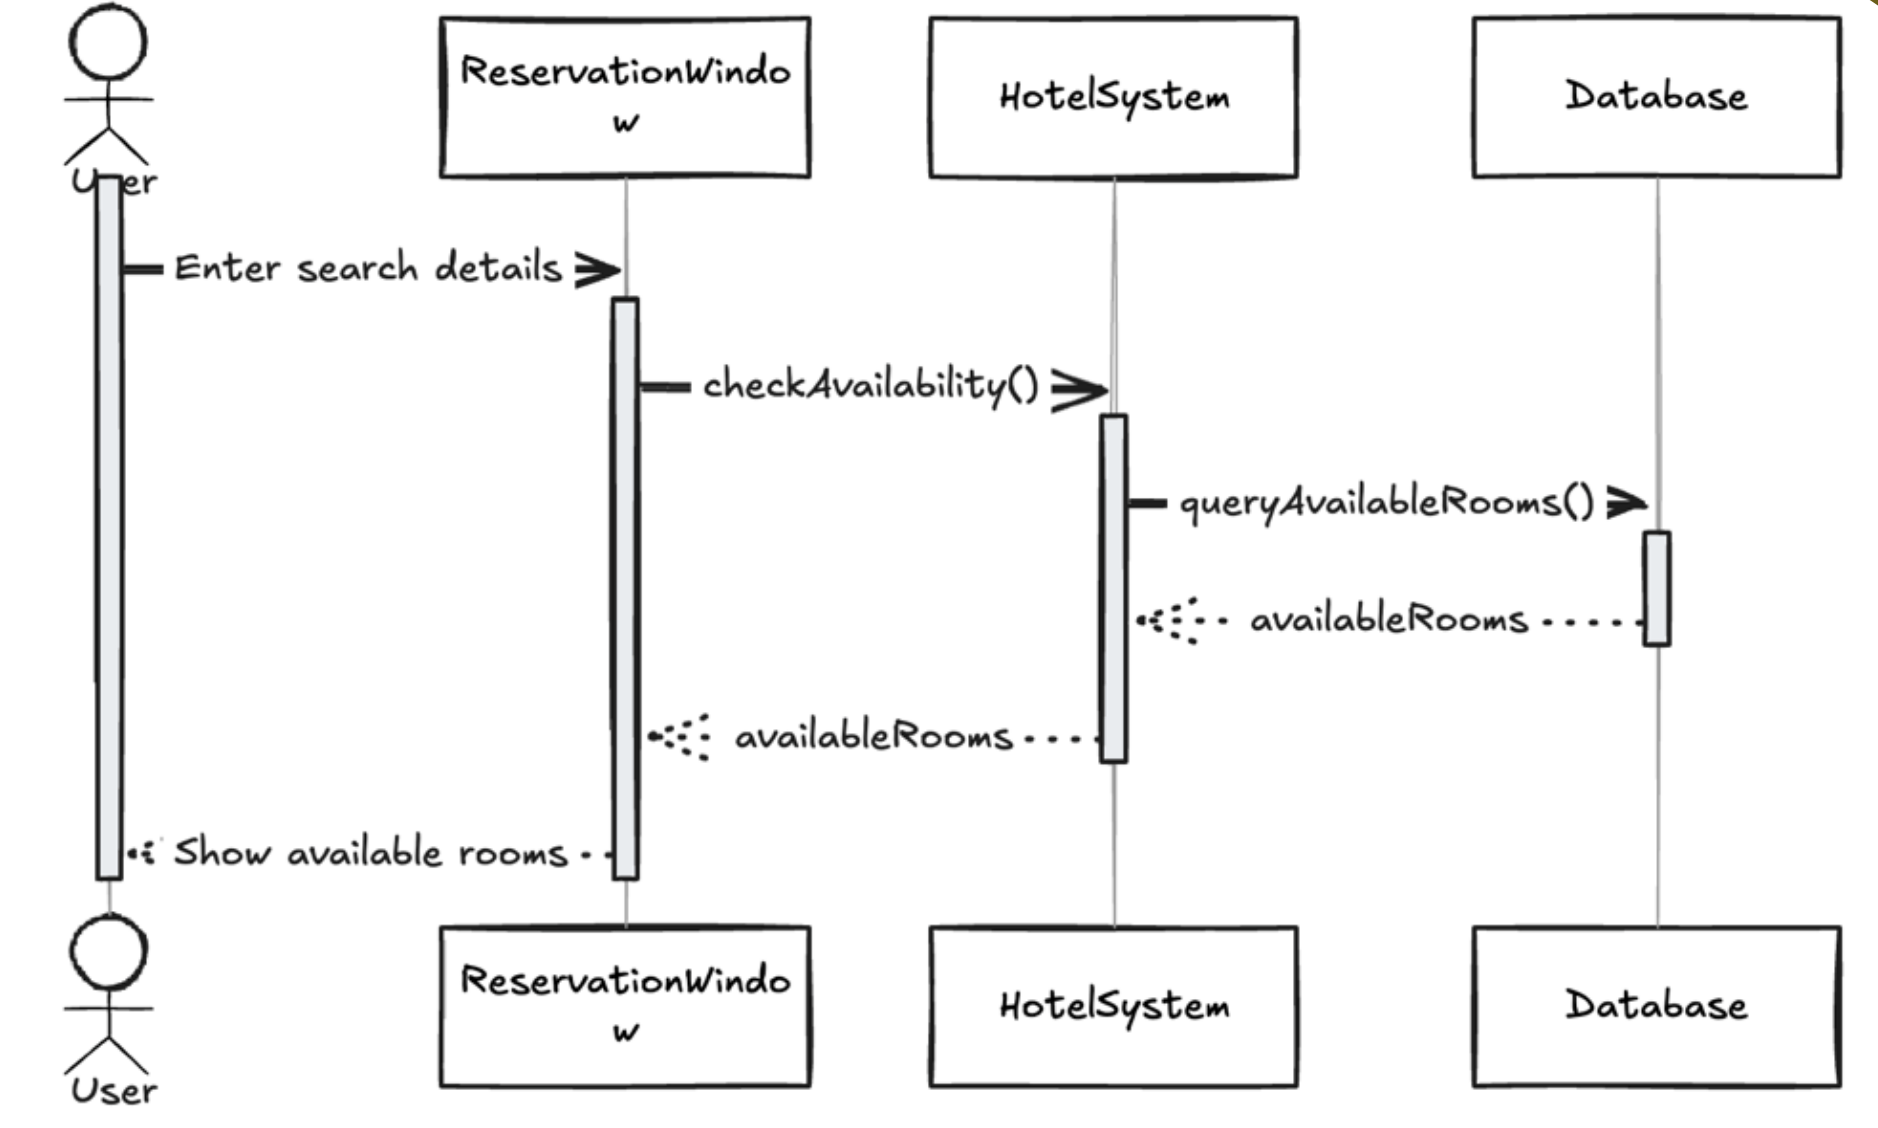
Structure and Key components
Actor: External user or system
Objects: Entities of the system
Lifelines: shows object existence during interactions
Messages: Communication between objects
Activation boxes: indicates active processing of messages

Axes in Sequence Diagrams
-
Horizontal axis represents objects
- Objects placed left to right
- The order represents the message sequence
-
Vertical axis represents time
- Time flows downward
- Sequence diagrams prioritise order, not duration
- Therefore, vertical spacing does not represent any sort of time intervals
Types of Messages
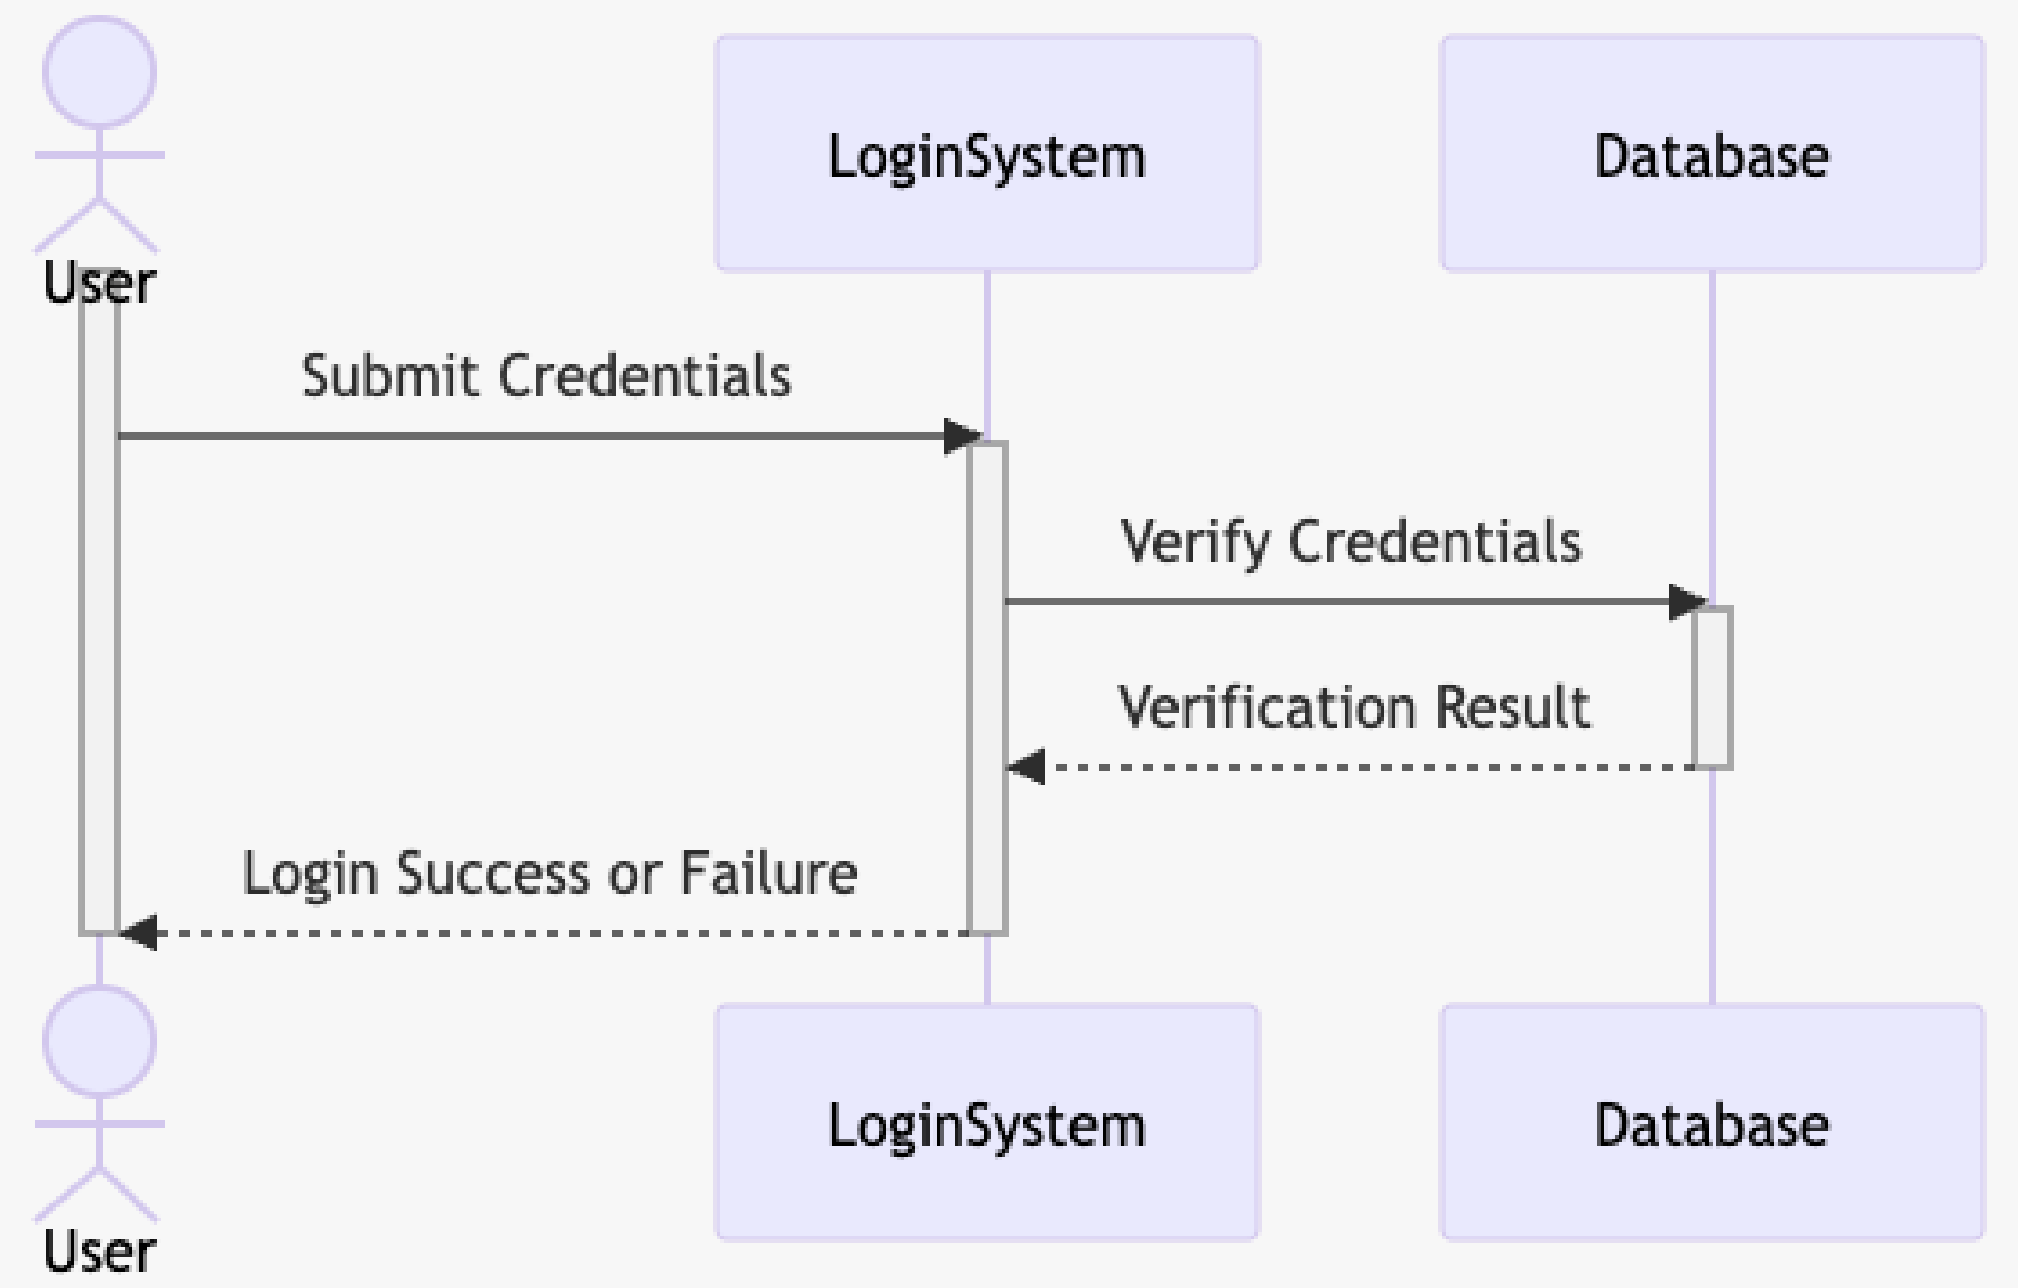
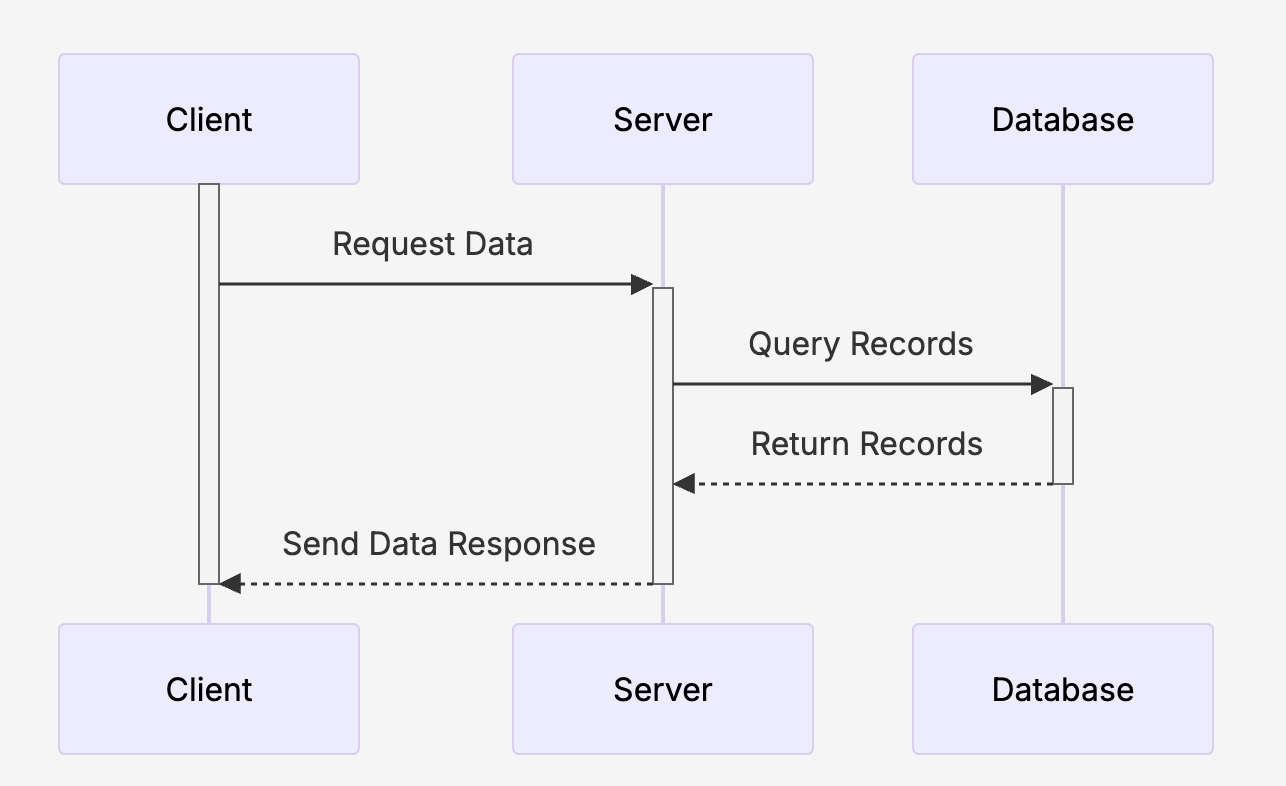
Synchronous
Asynchronous
Activation box exists so the message is processed immediately
No activation box so message processing and response is delayed
Sender waits for the receiver to complete the operation and return a response before continuing its own execution
Sender does not wait for the receiver to complete the operation; it sends the message and continues its own execution
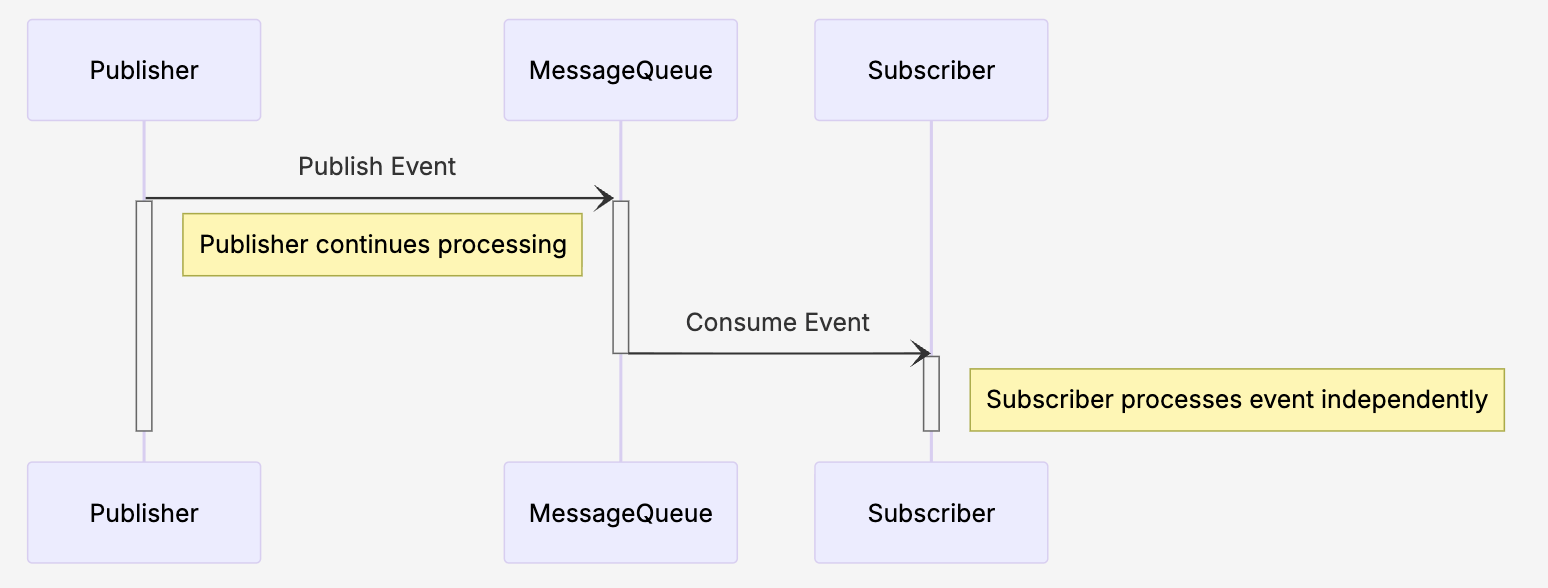
Solid line with open arrowhead are used for async messages
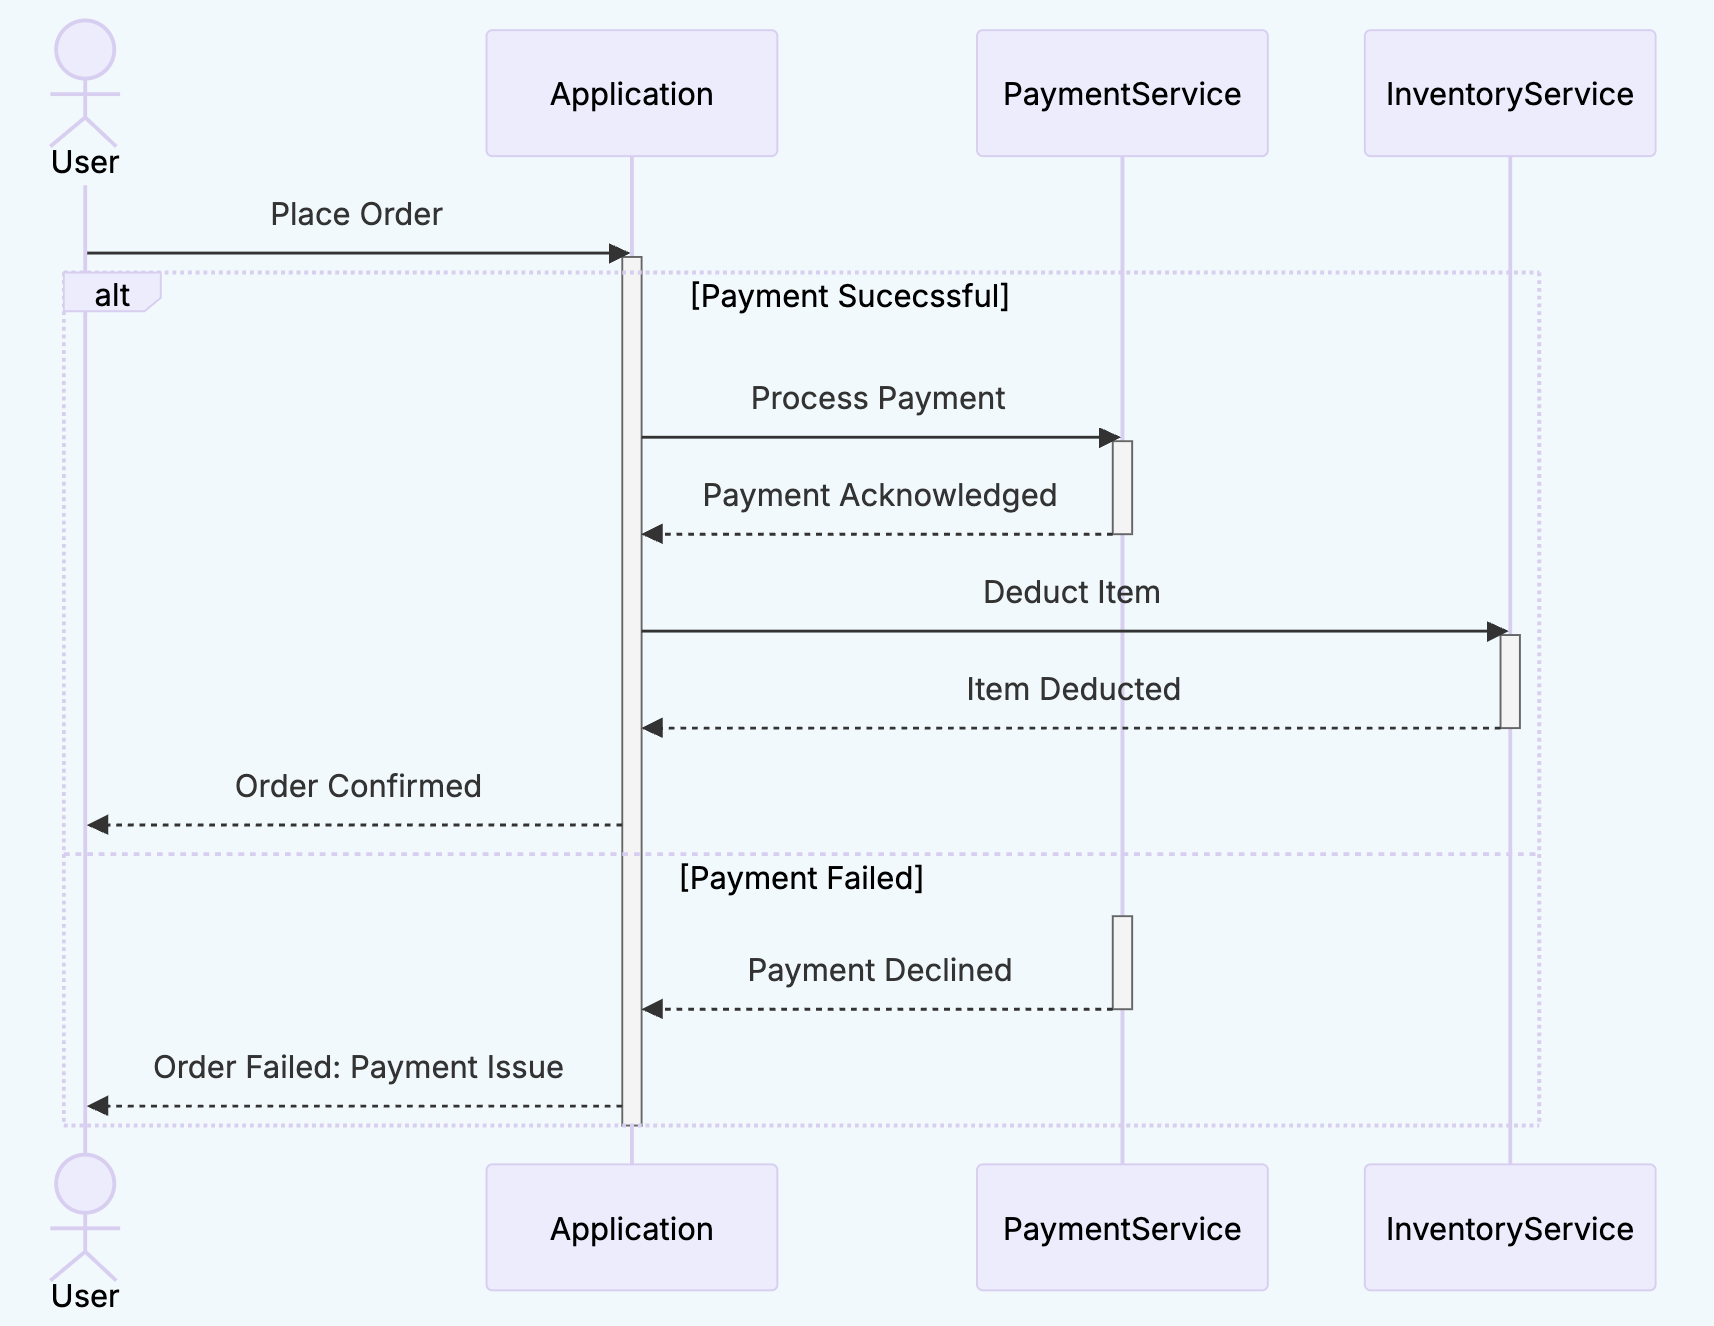
Conditional Behaviour
alt represents alternate scenarios
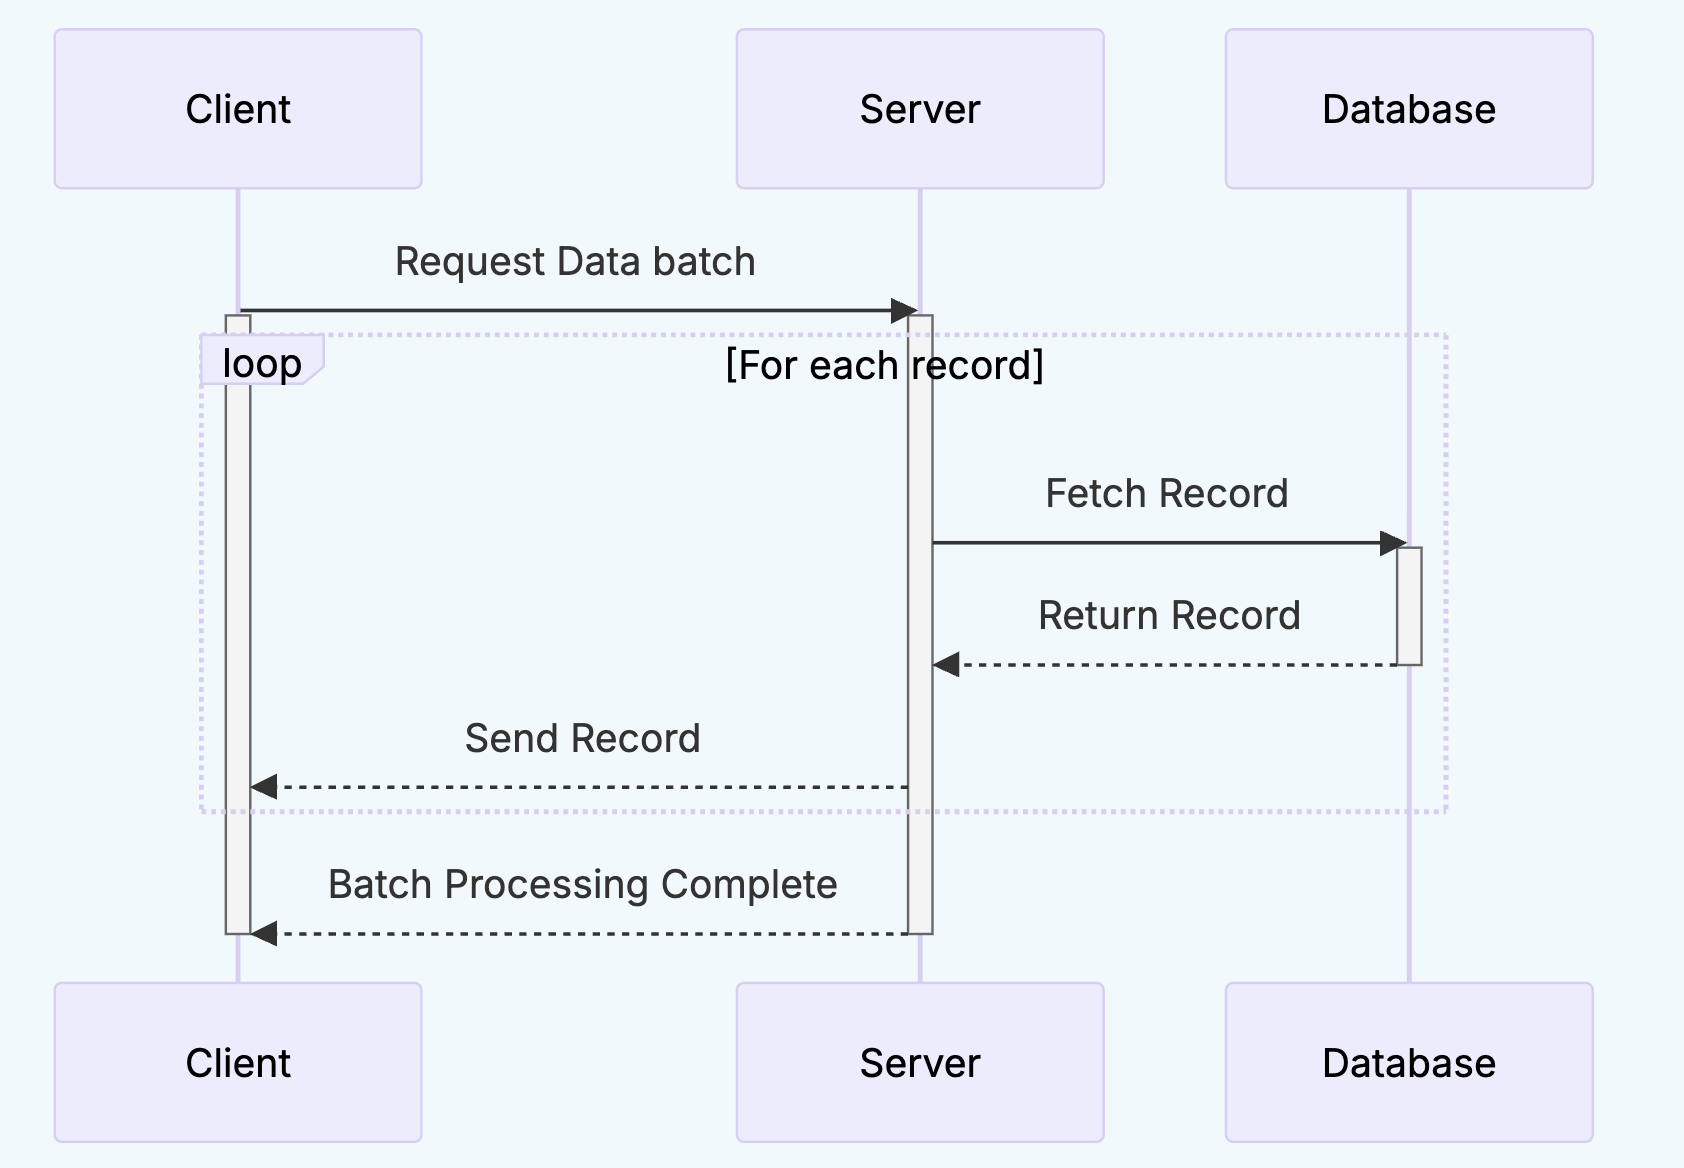
Looping Behaviour
loop represents repeated actions
Sequence Diagram Demo
We can create our sequence diagram using Mermaid code on VSCode and preview it
Sequence diagrams are often criticised for becoming unreadable in complex systems. What are some techniques to manage this complexity?
- Refactor / Decompose: Break down large system into smaller more manageable diagrams
- Focus on single case: Each diagram should focus on a specific scenario or path through a use case
- Use high level messages that abstract away internal details
- Use descriptive and consistent names for lifelines, messages, and guard conditions
COMP2511 Tute08
By rebeccahsu


