Tendermint Monitor
Rob Hilgefort

What's Monitored?
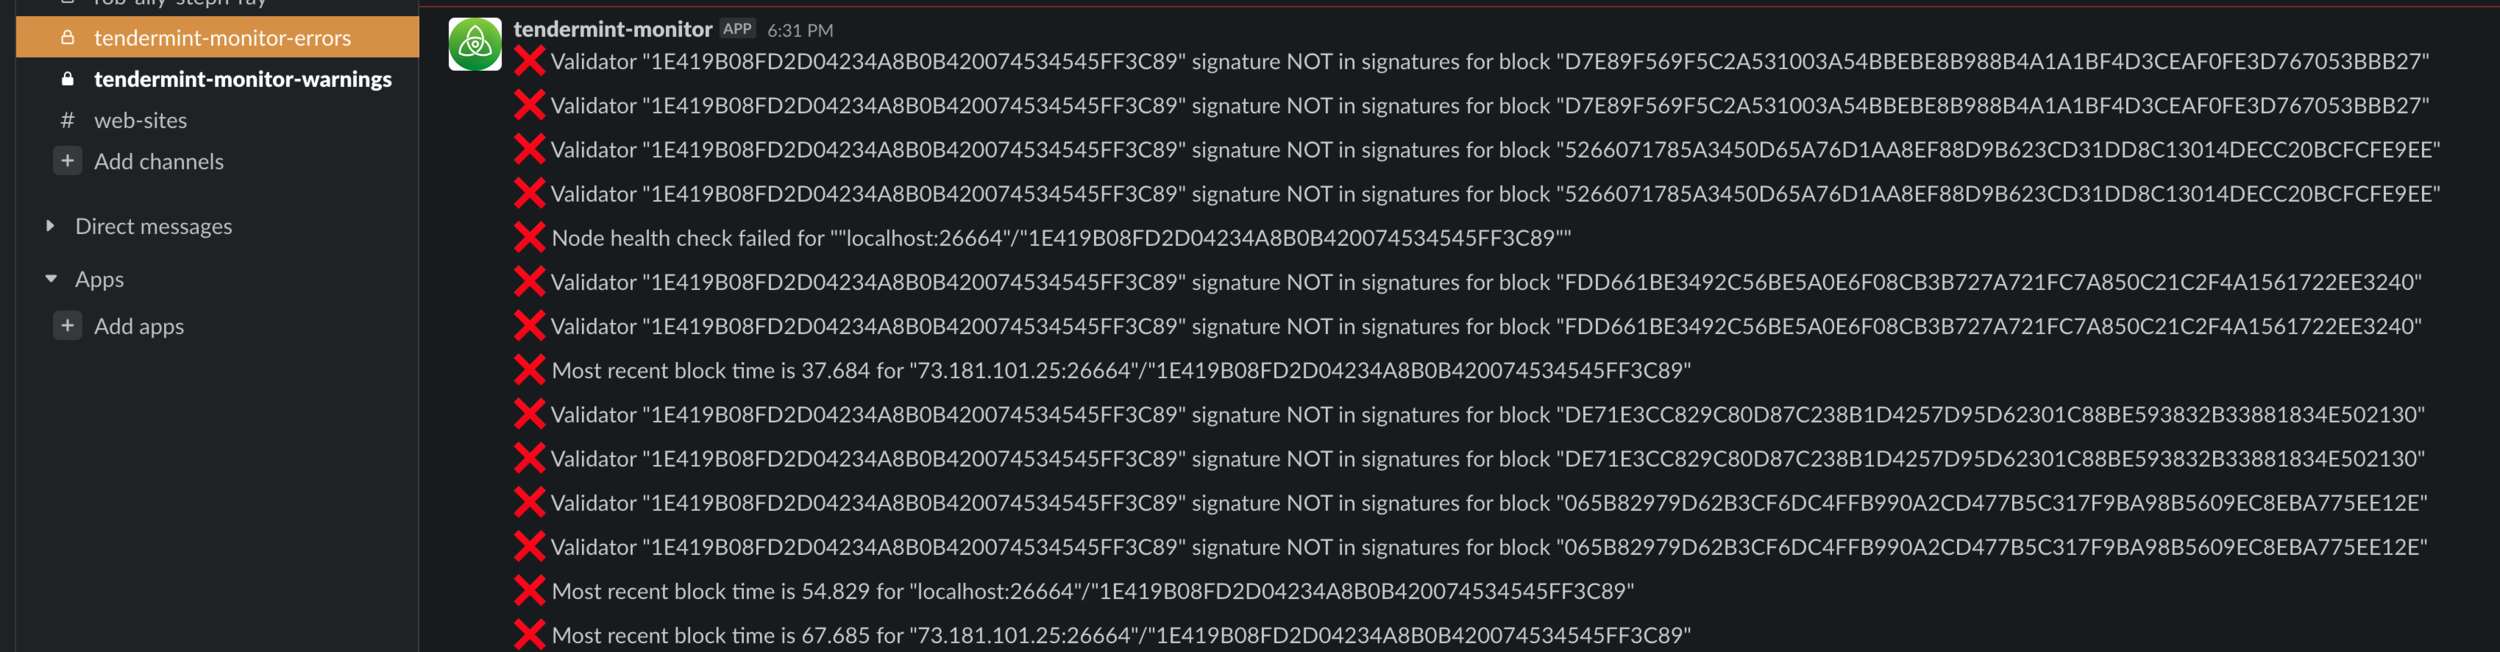
- Validators addresses appear in signatures list of each new block.
- HTTP Health checks.
- Calls to `/health` come back `200`.
- Validator addresses appear in `/validators` endpoint list.
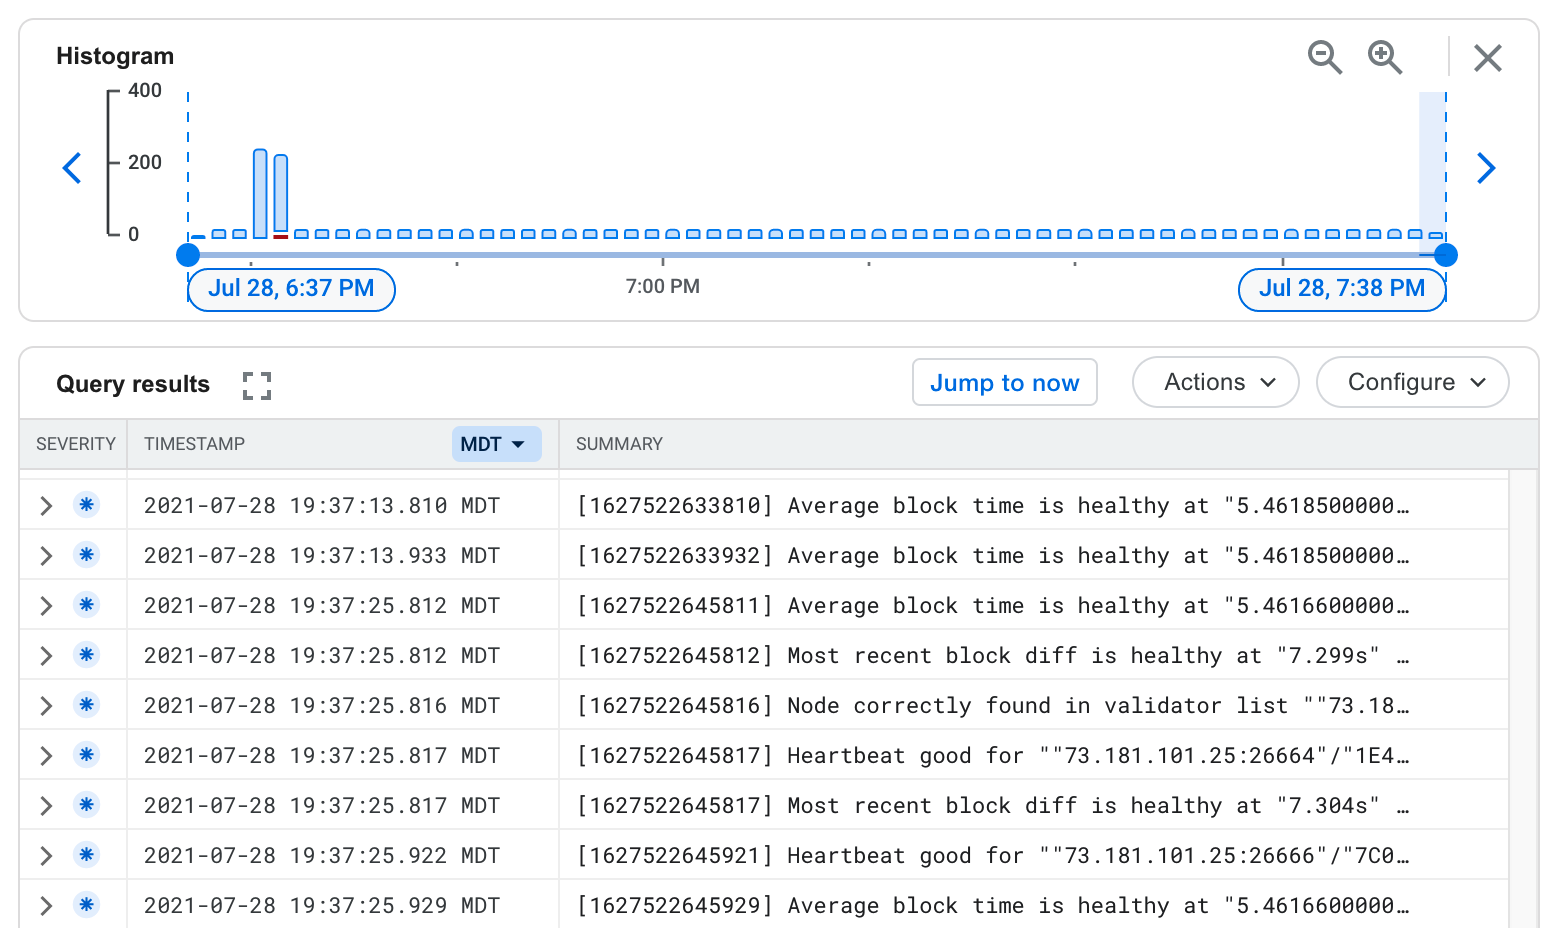
- Timely recent block.
- Most recent block is within past seconds.
- Configurable warning threshold and error threshold.
- Consistent streaming block
- Average time between blocks within certain number of seconds.
- Configurable warning threshold and error threshold.
How Monitored?
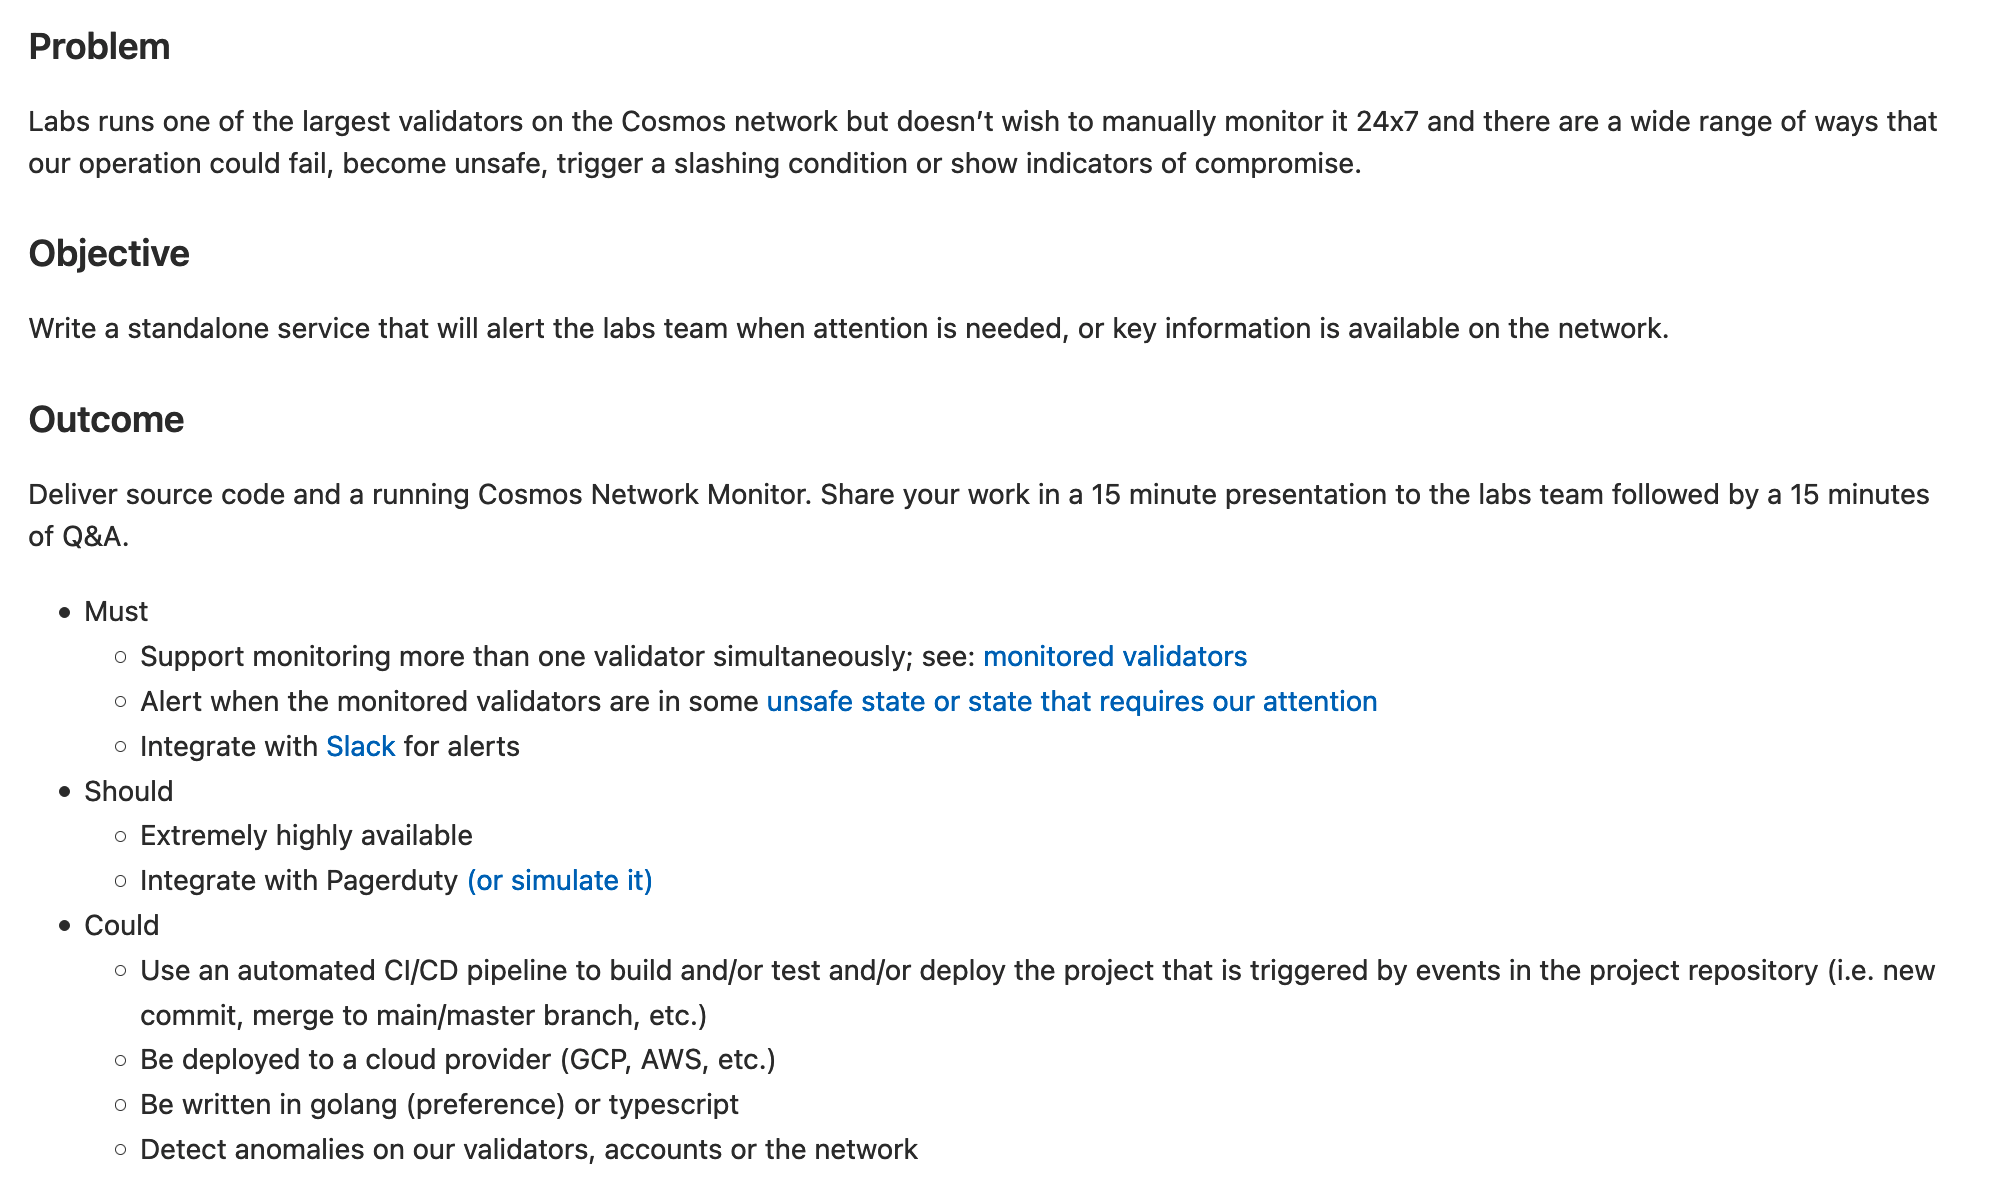
- Scheduled interval jobs.
- Instead of just relying on websocket events. Ensures analysis will be done.
- Websocket event analysis on block information
- In memory block history caching for job analysis.
- Monitors multiple nodes in parallel.
- Each node gets their own jobs scheduled.

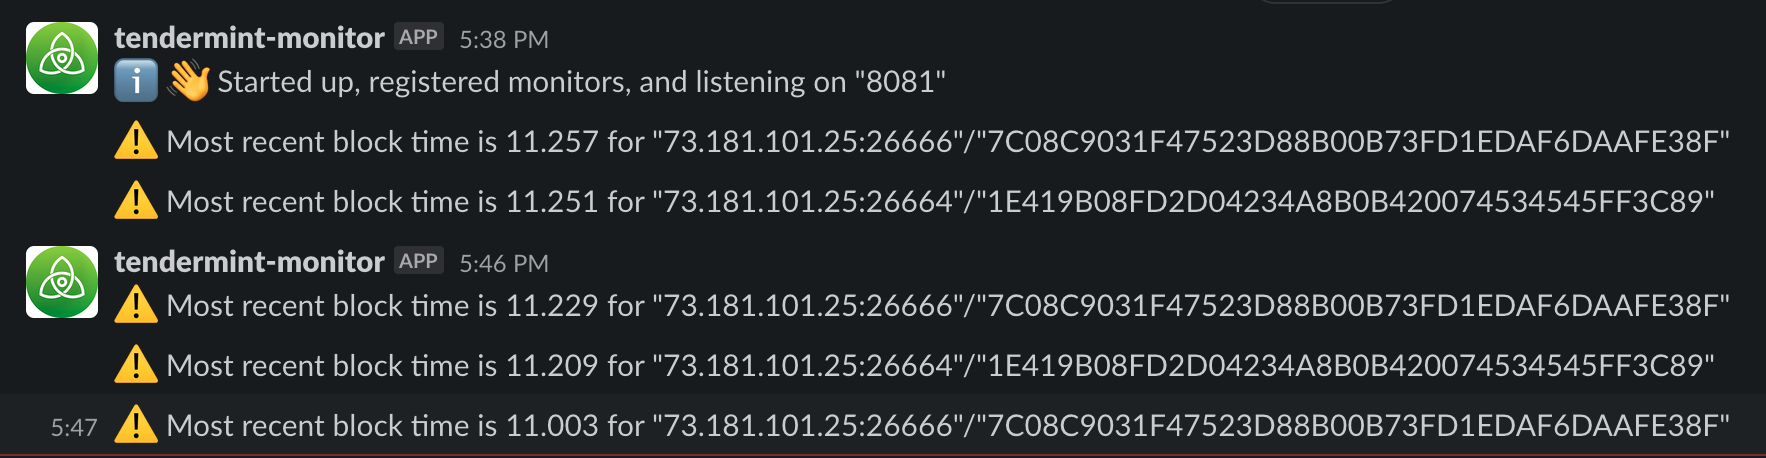
Reporting
- STDOUT / STDERR
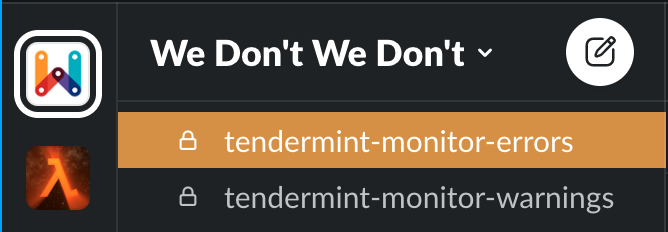
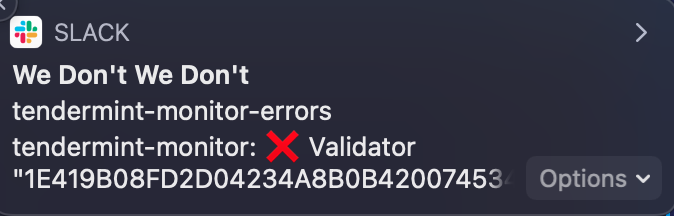
- Slack
- Pager Duty
STDOUT / STDERR
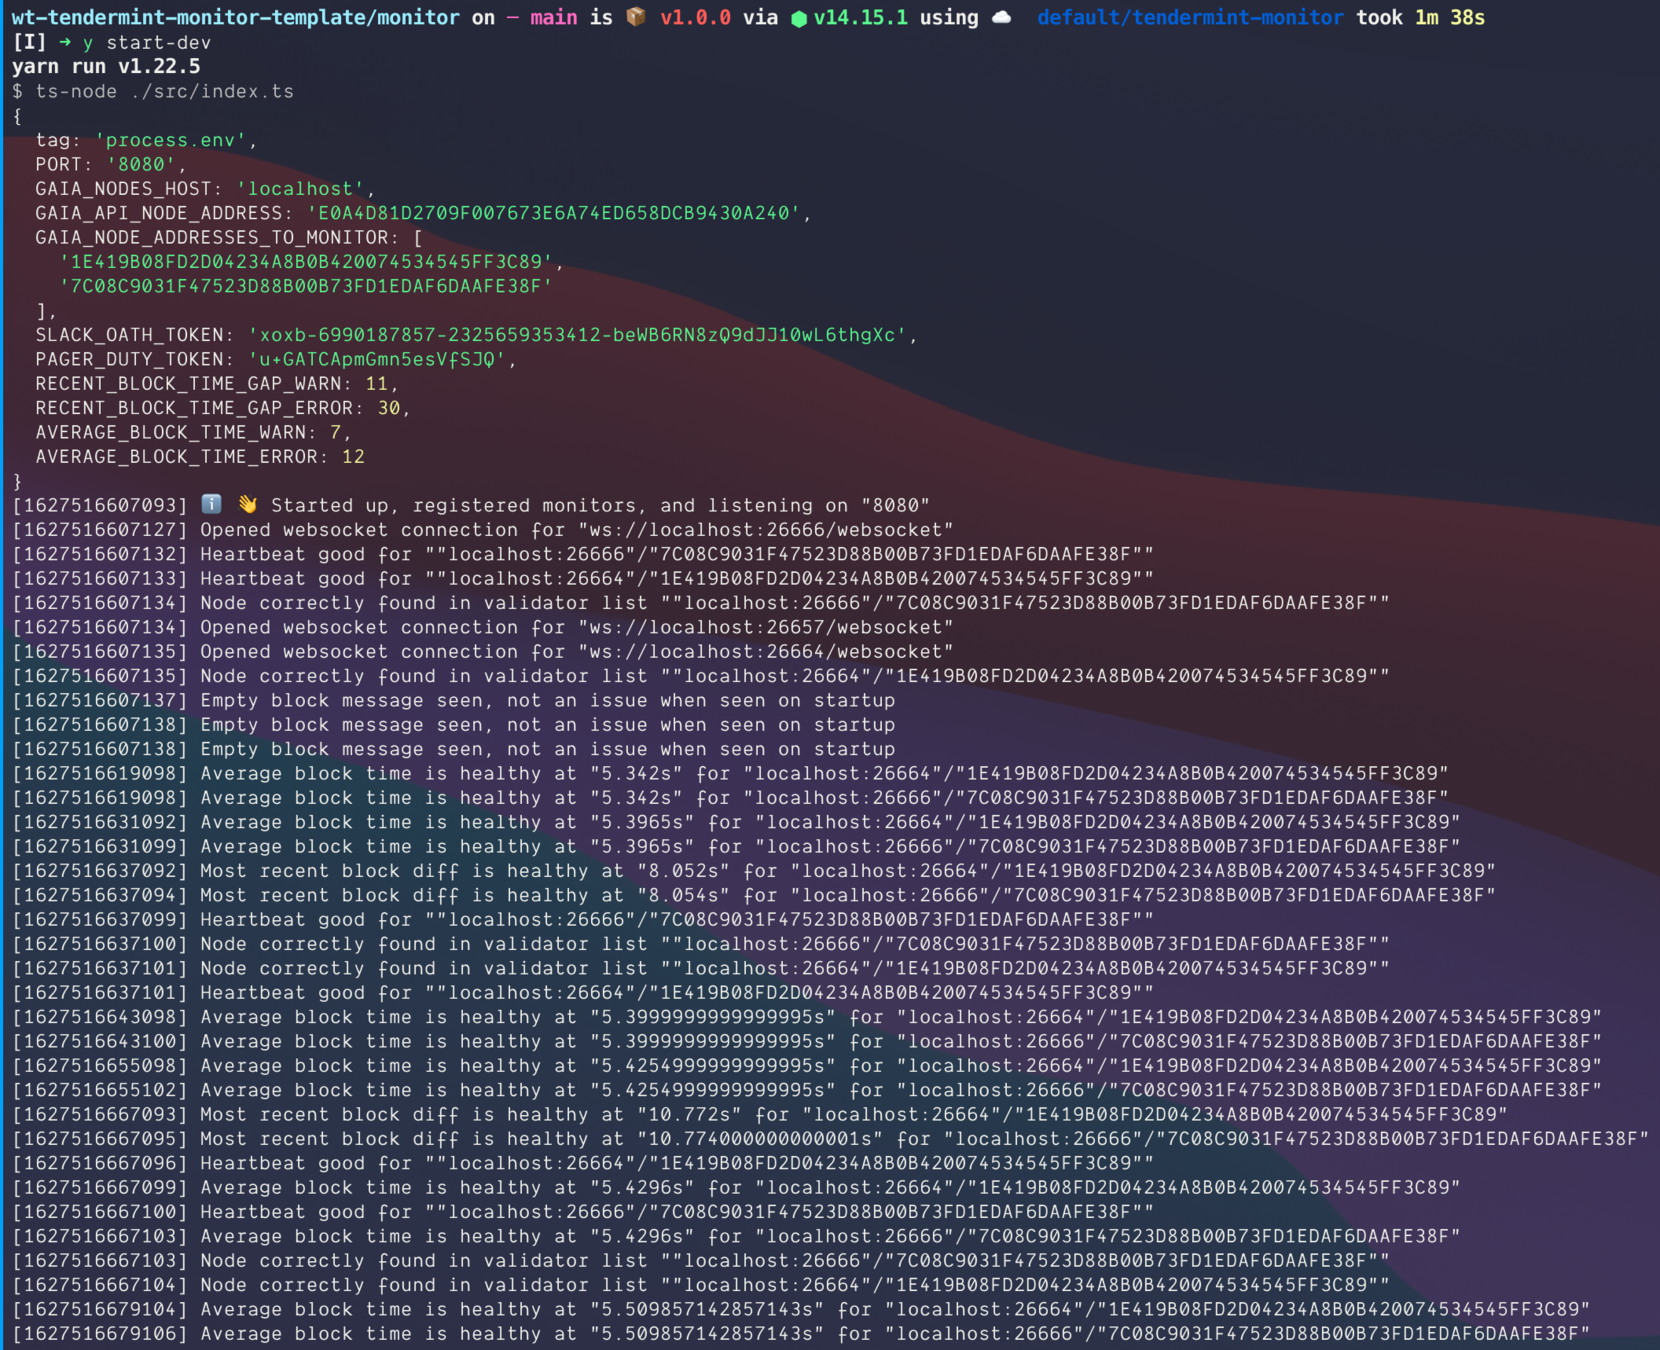
- Logs valid states/status and app events (HTTP/WS Connections).
- Verifying app state when booting.
- Useful for digging in after an alert
- Also logs errors and warnings to be seen in context of good logs.
Slack
- Sends messages in a Slack workspace
- Multiple channels based on severity (mute warnings).
Pager Duty
- "Error" alerts log to Slack, as well as Pager Duty.
Demo

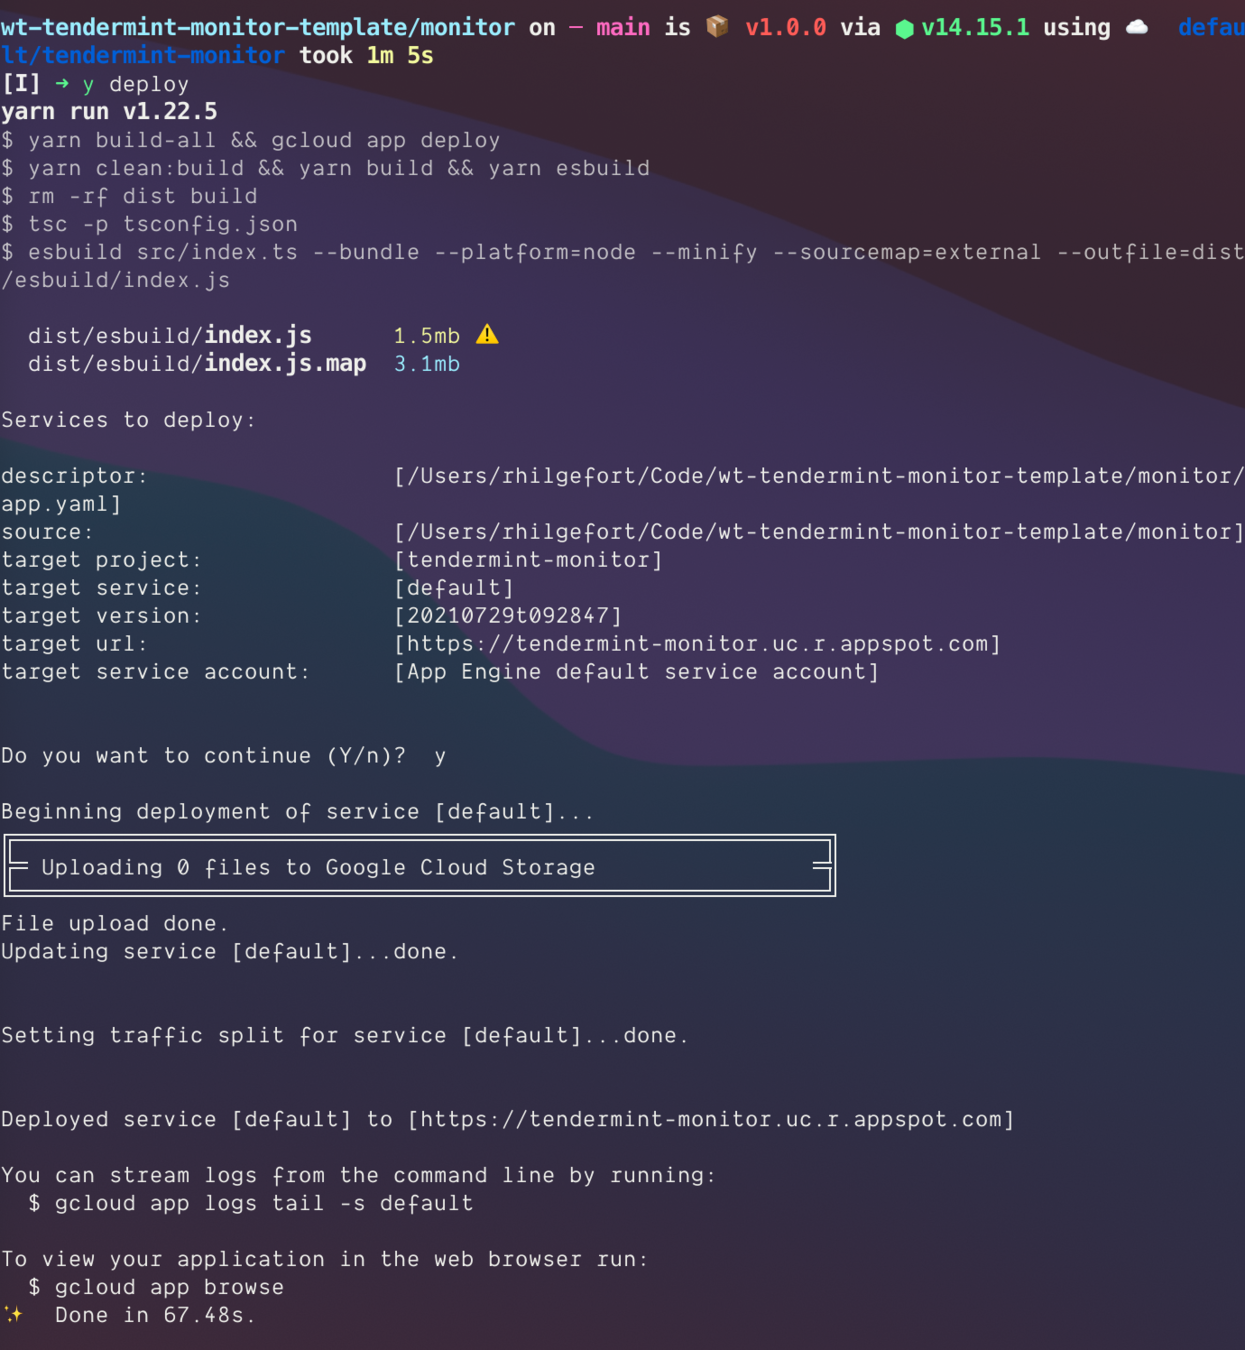
Deployment
- Local Tendermint Test Net
- NodeJS on Google App Engine
- Monitoring The Monitor
Local Test Net
- Docker containers
- Exposed via port forwarding to GAE
NodeJS Google App Engine
- NodeJS deployed on Google App Engine
- Manual scaling, 1 instance
- Exposed via port forwarding to GAE instance


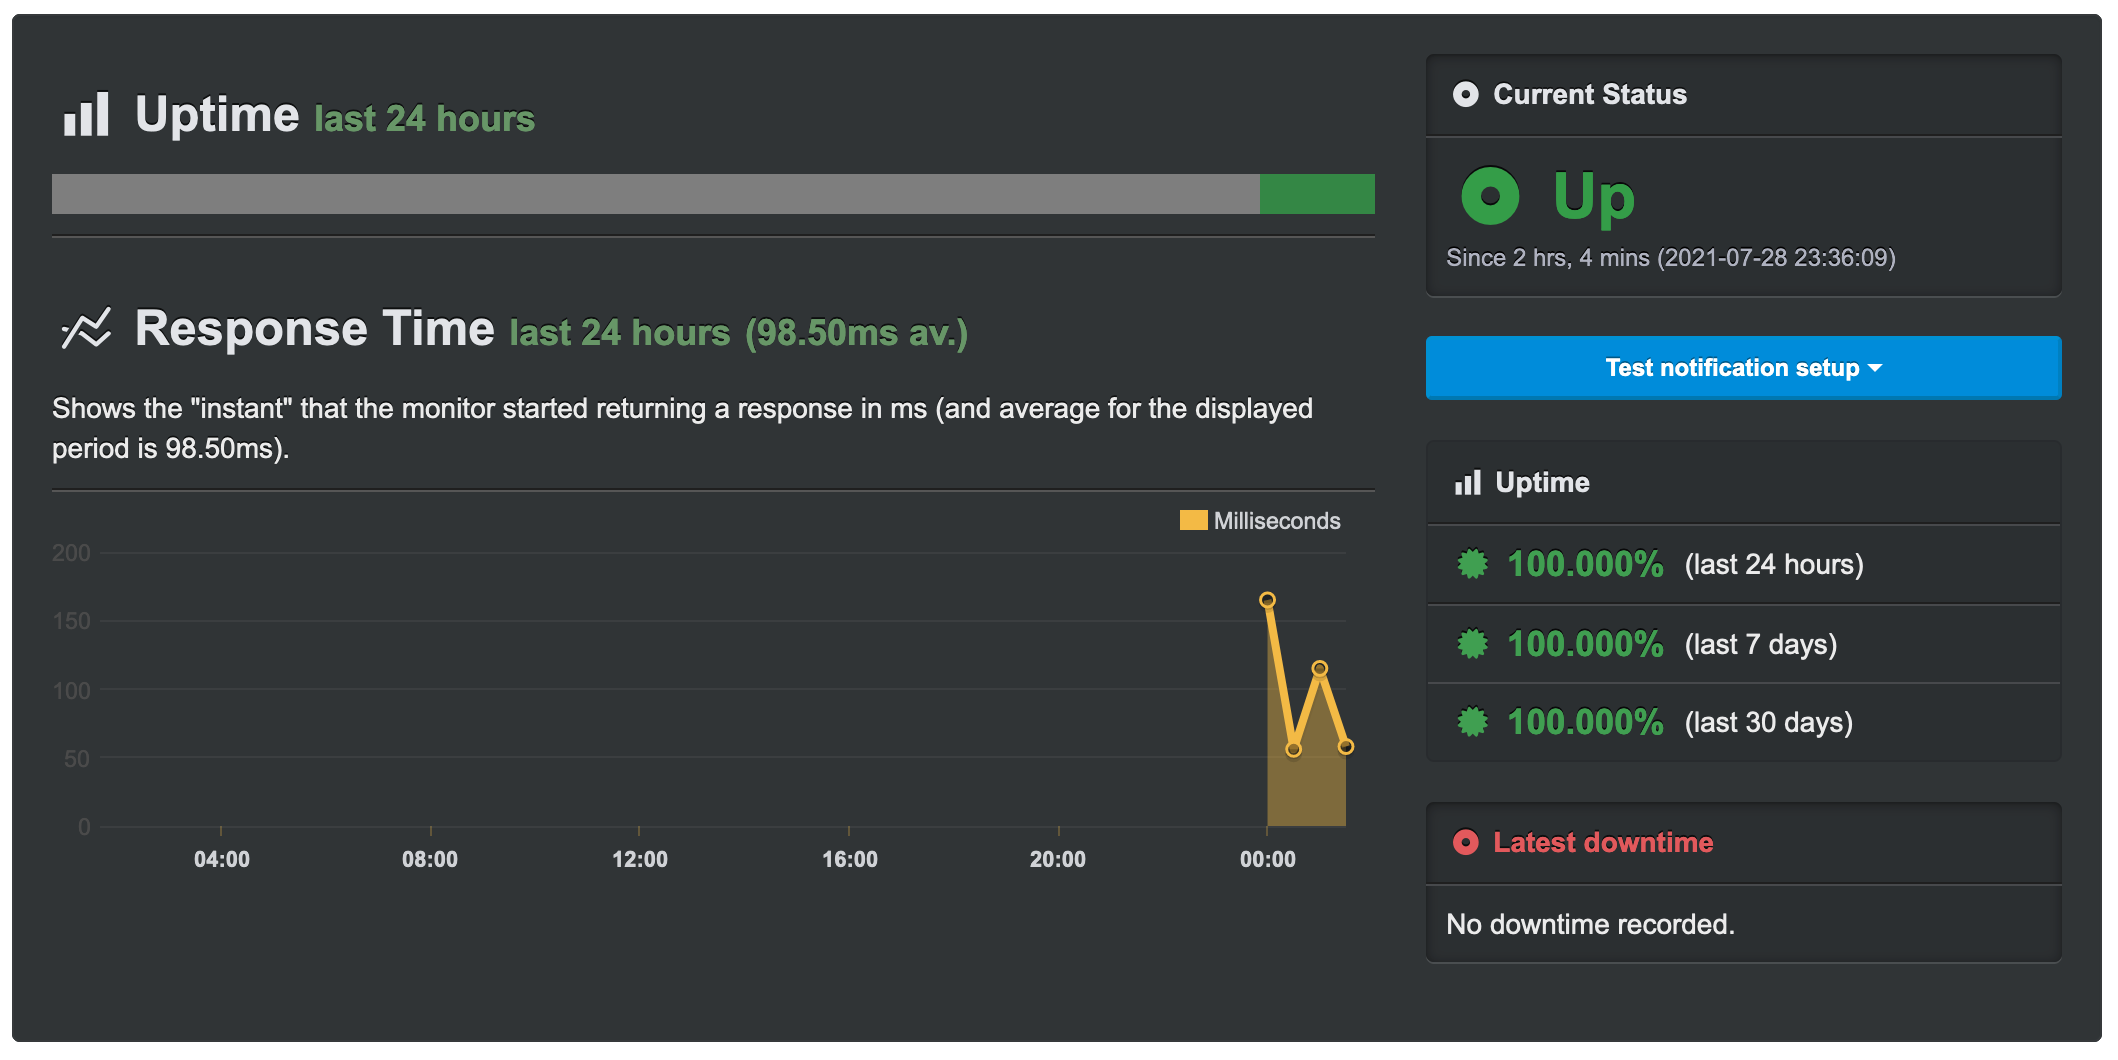
Monitoring The Monitor
- ExpressJS health endpoint
- Uptime robot
- Slack reporting
Monitor Implementation
- Language(s)
- Build Tooling
- Control Flow "Architecture"
- Integrations
- Libraries
Language(s)
- NodeJS
- Interpreter / Ecosystem
- TypeScript
- Fully and strictly statically typed
-
`fp-ts`
- Library that facilitates functional programming in TypeScript


Build Tooling
- TypeScript
- Compiler
- ESLint
- Style standard
- Prettier
- Formatter
- ESBuild
- Build artifacts


Control Flow "Architecture"
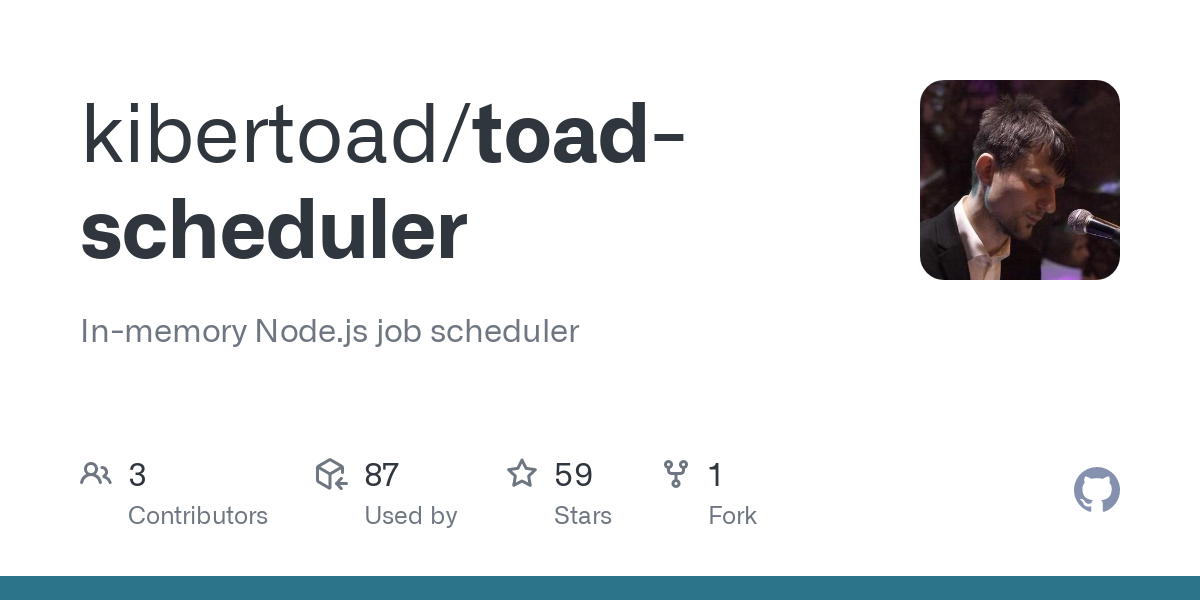
-
`toad-scheduler`
- Simple in-memory job scheduler
- Used for interval jobs
- While `node-scheduler` is the most popular, toad was sufficient for needs.
-
`ws`
- Defacto websockets lib.
- Used to ingest new blocks.

Integrations
-
`@slack/web-api`
- `chat.sendMessage`
- `@pagerduty/pdjs`
- Only one with TS support
- Hot garbage 🤮


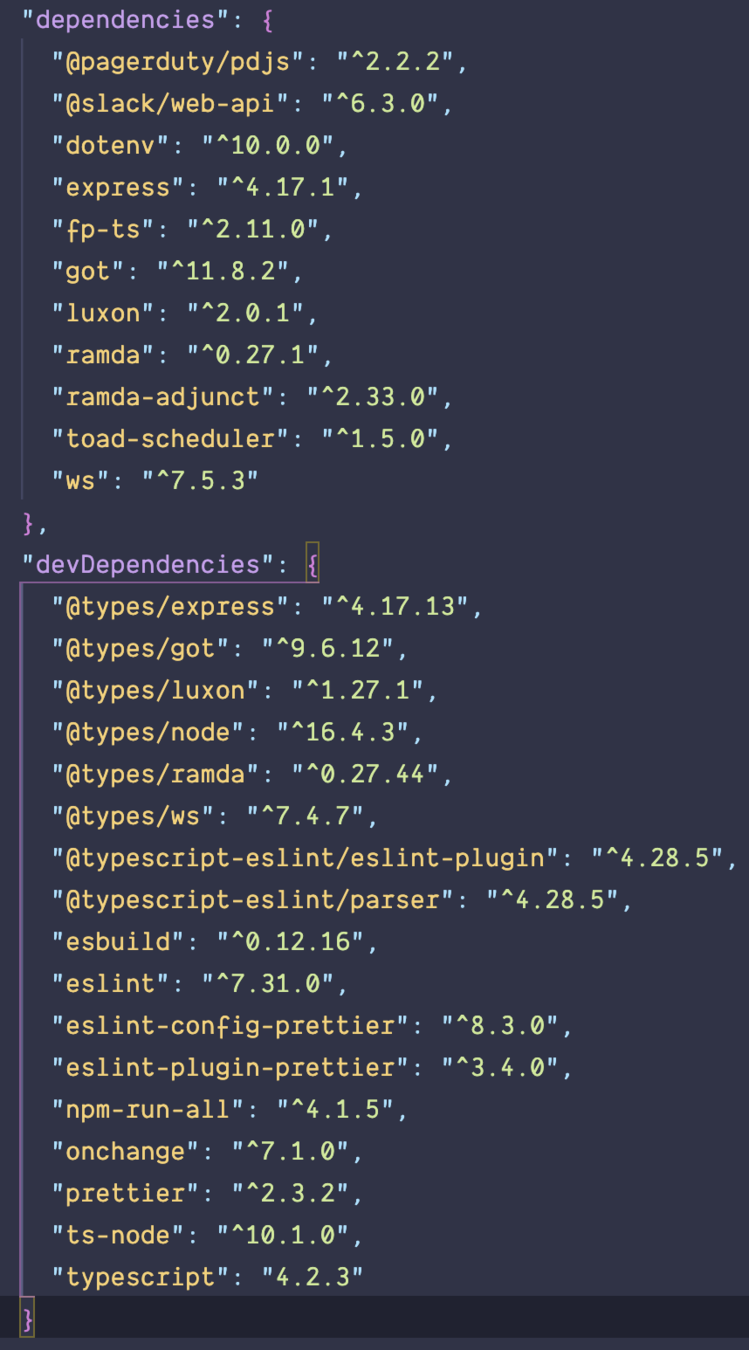
Libraries
- `dotenv`
- Environment variables
- `express`
- HTTP health endpoint
- `got`
- HTTP abstraction
- `luxon`
- DateTime library
- `ramda`
- Utility functions
- `ramda-adjunct`
- Utility functions


Next Steps
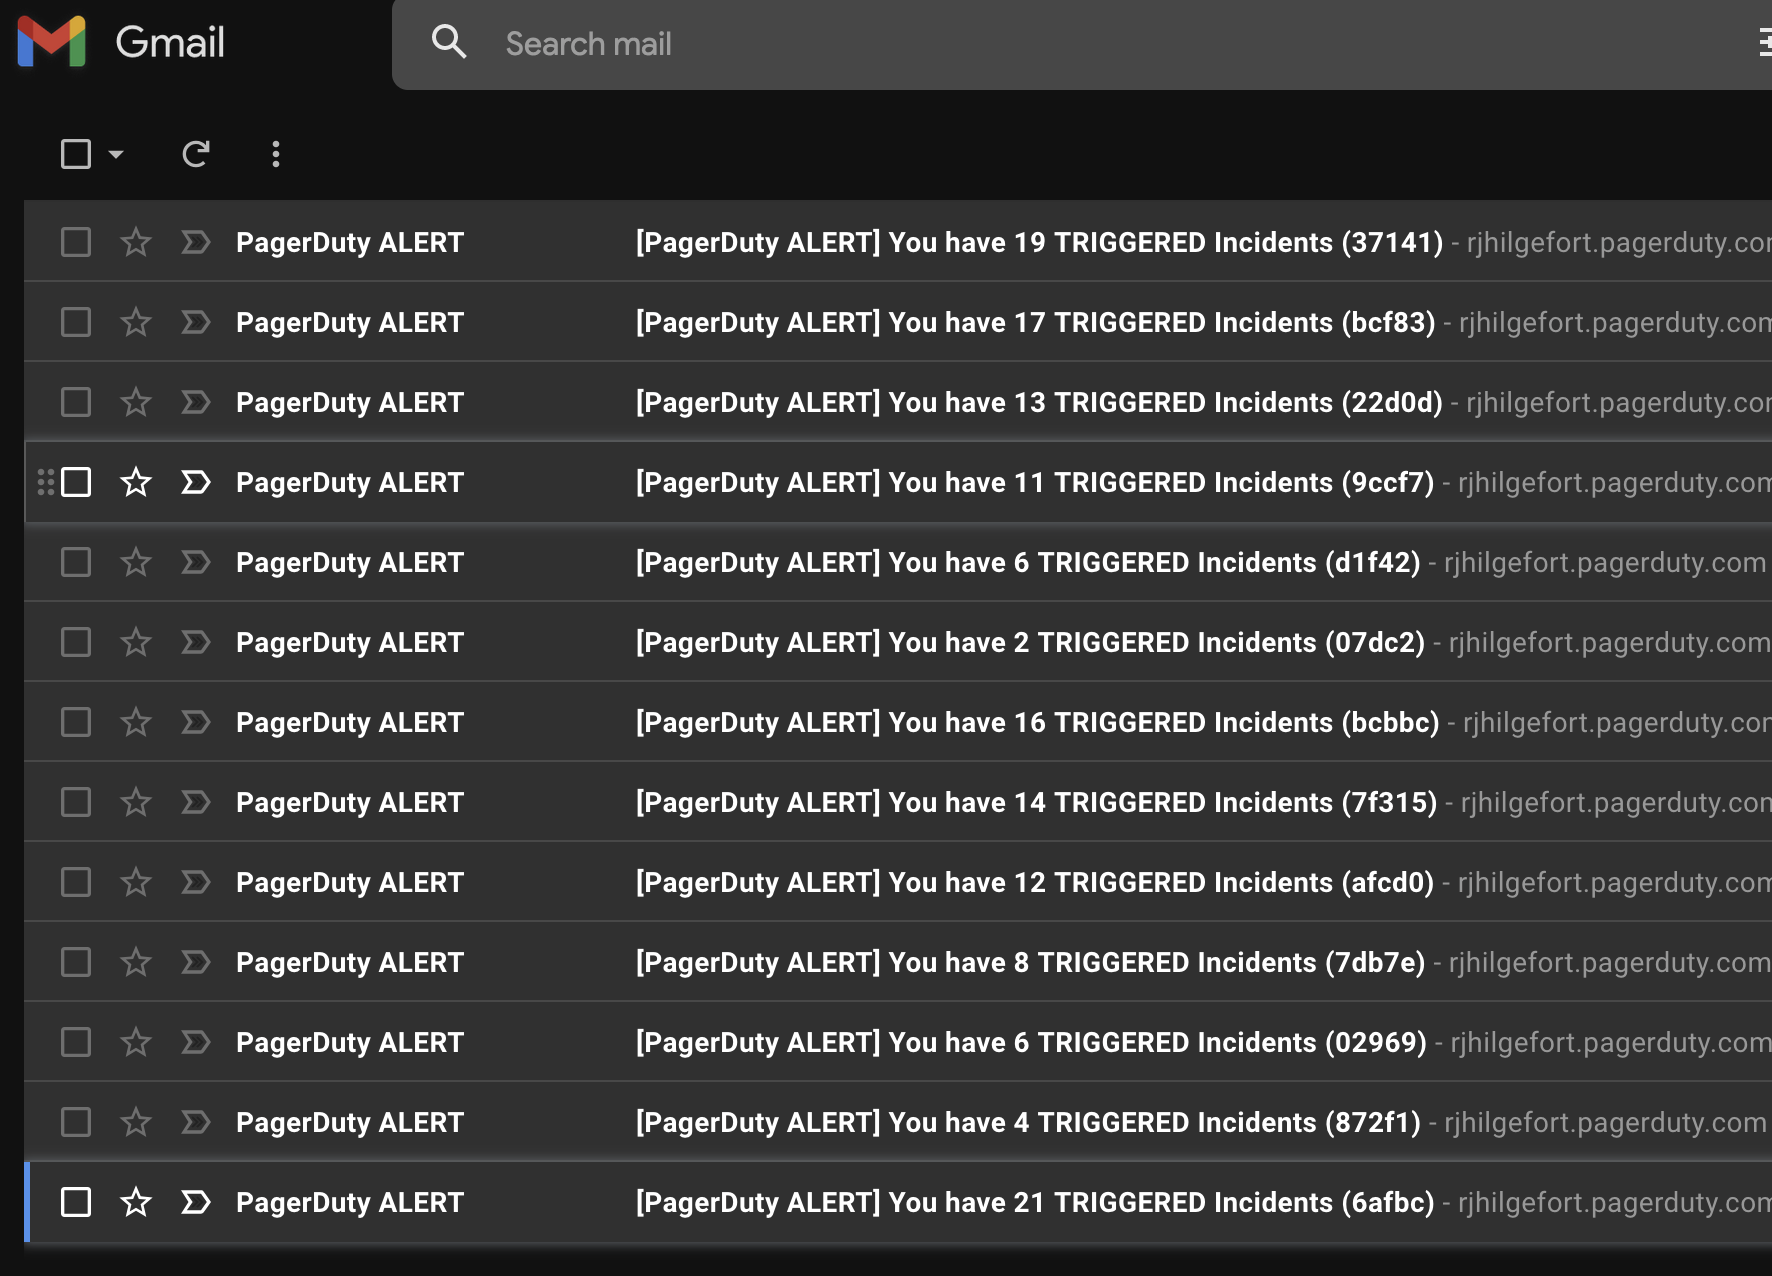
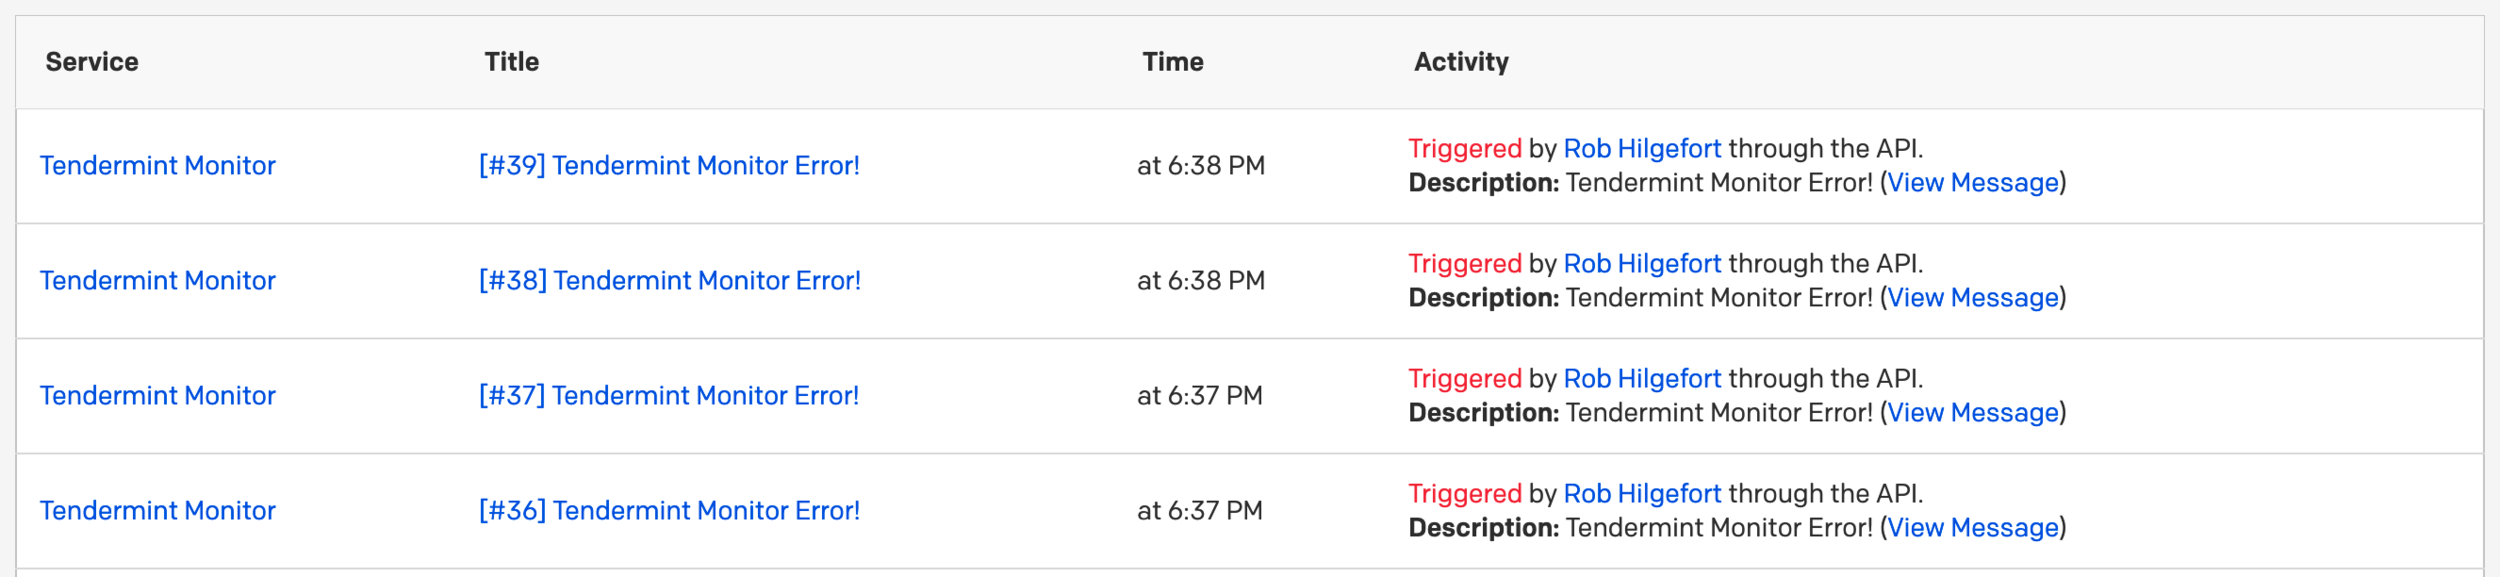
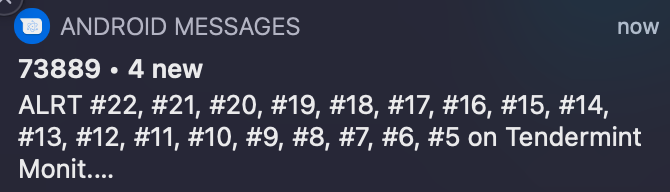
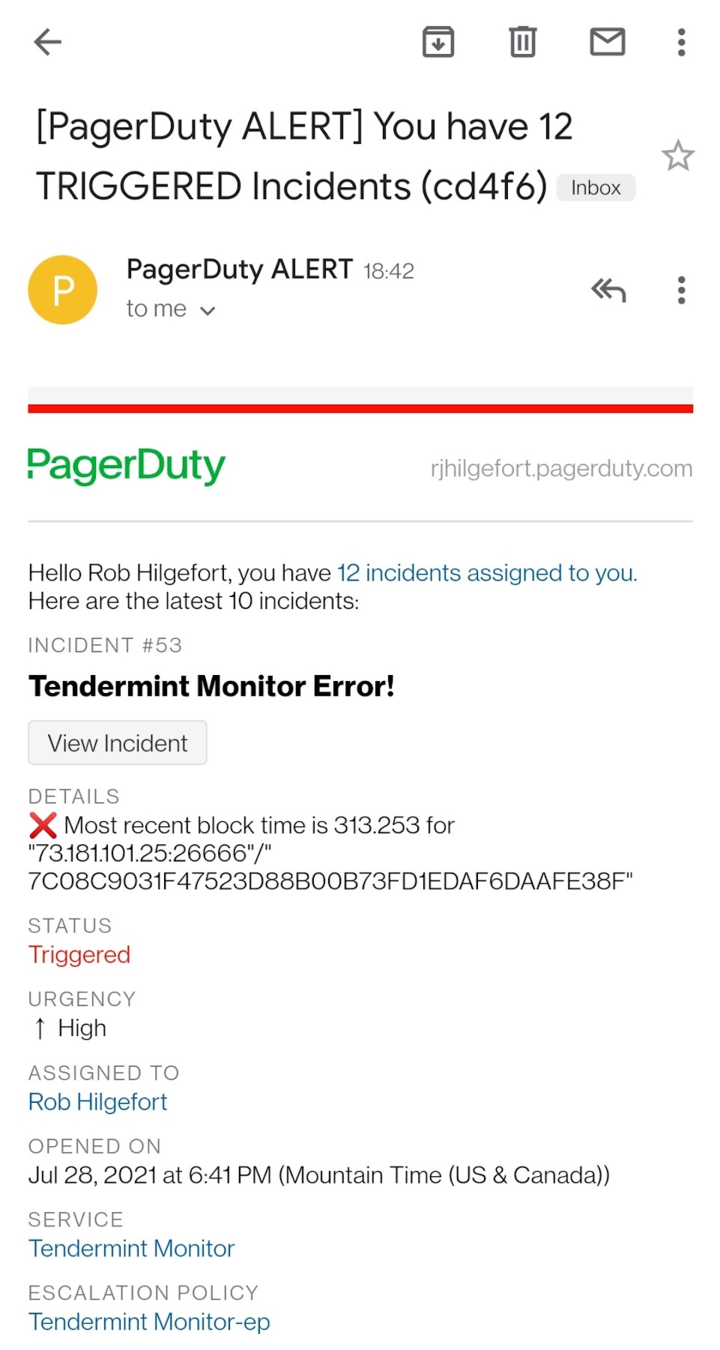
- If node goes down, you get LOTS of alerts
- Add Winston logger and transport to GCP
- Pager duty messages in Slack, ack inline.
- Reconnect to node after WS disconnects. (Have to restart to get healthy)
- Write tests.
- Move away from GAE, not a big fan- would rather Docker and some other managed solution.
- Push metrics to Prometheus, Grafana dashboarding / alerting.
- Much better auto-recovery and resolution.
- GitLab CD. (GAE secrets)
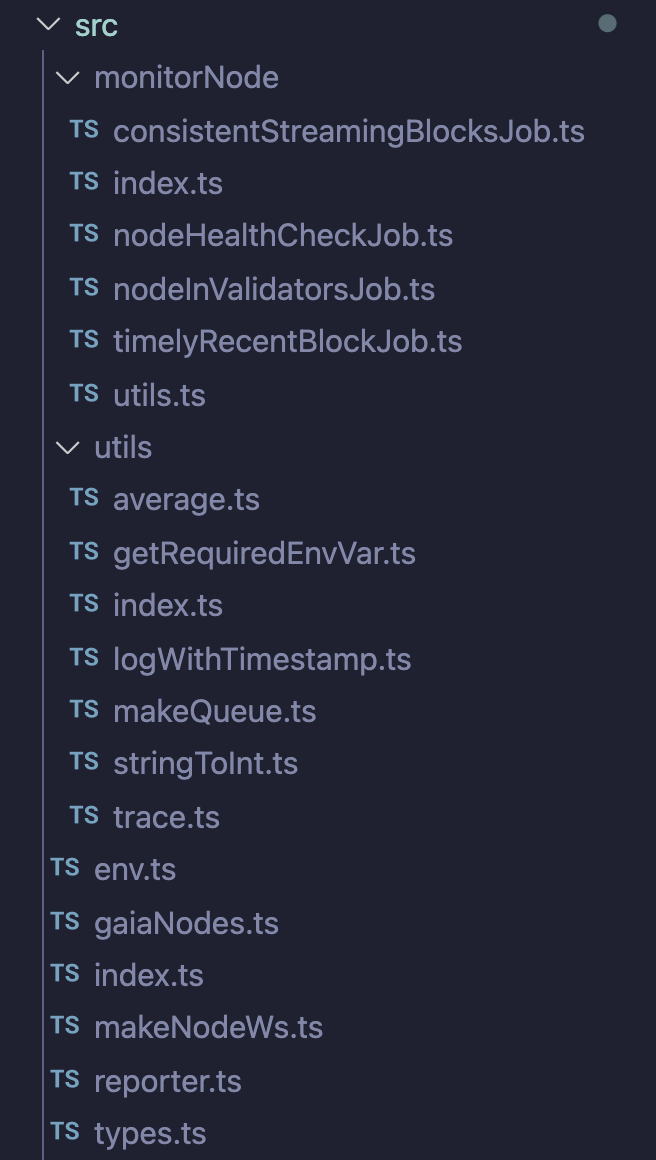
Code Exploration

Thanks 👋
Rob Hilgefort
Tendermint Monitor
By rjhilgefort
Tendermint Monitor
https://gitlab.com/rjhilgefort/wt-tendermint-monitor-template


