Open-source mobile-friendly maps
about me
Ryan Ohs
Phoenix Web Group
Waverly, Nebraska
var map = L.map('map').setView([51.505, -0.09], 13);
L.tileLayer('http://{s}.tile.osm.org/{z}/{x}/{y}.png', {
attribution: '© <a href="http://osm.org/copyright">OpenStreetMap</a> contributors'
}).addTo(map);
L.marker([51.5, -0.09]).addTo(map)
.bindPopup('A pretty CSS3 popup.
Easily customizable.')
.openPopup(); why leaflet?
- Google Maps for Business costs $10,000/yr
- Easy to use API
- Lightweight
- 64K (vs 700K for OpenLayers)
- Desktop and mobile support
- Retina display support with high-dpi tiles
- Currently at version 0.7.2
- Started in 2010
- Over 3000 commits and 157 contributers
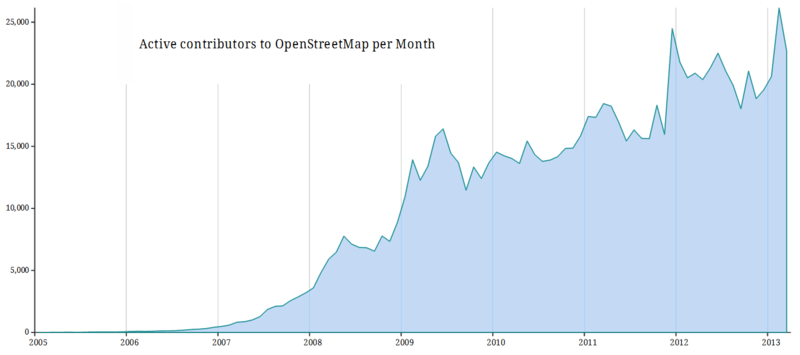
what is openstreetmap?
- Wikipedia for maps
- Data has open license
- User editable
- 1.5 million editors (doubling every year)
- > 2 trillion data points
OSM vs Google
Getting map tiles for free
-
OpenStreetMap
- Free but limited capacity
- Can’t use in distributed mobile apps
-
http://wiki.openstreetmap.org/wiki/Tile_usage_policy
- MapQuest Open license
- Free, open license, requires attribution
- For heavy usage (>4000 tiles/sec), contact them first
- JPEG
-
MapBox
- Free tier
- No satellite imagery
Commercial Options
- CloudMade
- Original creator of Leaflet
- $30 per 1 million tiles
- MapBox (Lead dev now works here)
- Free, then starting at $5/mo
- Roughly $30 per 900,000 tiles
- Also supports making your own tiles and layers
- Big list at http://wiki.openstreetmap.org/wiki/Commercial_OSM_Software_and_Services
Tiles and zooming
http://{s}.tile.osm.org/{z}/{x}/{y}.png
-
20 zoom levels
- 0 = whole world
- 13 = a town
- 19 = 1 ft/px
- Each level is about double the previous
-
Tiles are 256 x 256px PNG images
-
Approximately 15 tiles in a “map view”
getting started
- Link to javascript and stylesheet
<link rel="stylesheet" href="http://cdn.leafletjs.com/leaflet-0.7.2/leaflet.css" /> <script src="http://cdn.leafletjs.com/leaflet-0.7.2/leaflet.js"></script> - Add a map div. Give it a height.
<div id="map" style="height: 600px"></div> - Initialize the map.
var map = L.map('map').setView([51.505, -0.09], 13); - Add a map tile layer
L.tileLayer('http://{s}.tile.osm.org/{z}/{x}/{y}.png', {
    attribution: '© <a href="http://osm.org/copyright">
OpenStreetMap</a> contributors'
}).addTo(map);
mobile setup
Full screen support
body {
    padding: 0;
    margin: 0;
}
html, body, #map {
    height: 100%;
}
Disable automatic scaling
<meta name="viewport" content="width=device-width, initial-scale=1.0, maximum-scale=1.0, user-scalable=no" />
Initialize map (no coordinates here)
 var map = L.map('map');

L.tileLayer('map url', {
    attribution: 'attribution line',
    maxZoom: 18
}).addTo(map);
Geolocation
Zoom to the user's current position
map.locate({setView: true, maxZoom: 16});Continue initialization after success
function onLocationFound(e) {
    var radius = e.accuracy / 2;
    L.marker(e.latlng).addTo(map)
        .bindPopup("You are within " + radius + " meters from this point").openPopup();
    L.circle(e.latlng, radius).addTo(map);
}

map.on('locationfound', onLocationFound);
Handle error or permission denied
 function onLocationError(e) {
    alert(e.message);
}

map.on('locationerror', onLocationError);
Markers
Consist of an image and a shadow

 var appleIcon = L.icon({
    iconUrl: "../lib/images/apple.png",
    shadowUrl: "../lib/images/square-shadow.png",
    iconSize:     [32, 37],
    shadowSize:   [51, 37],
    iconAnchor:   [16, 37],
    shadowAnchor: [17, 37],
    popupAnchor:  [0, -37]
});

L.marker([51.5, -0.09], {icon: appleIcon}).addTo(map);
Creating Markers
Lots of free icons available online
Maps Icon Collection (CC BY SA 3.0)
Font-Awesome Markers (MIT)
Custom icons need custom shadow shapes
MArker Anchors
 iconSize:     [32, 37],
 shadowSize:   [51, 37],
 iconAnchor:   [16, 37],
 shadowAnchor: [17, 37],
 popupAnchor:  [0, -37]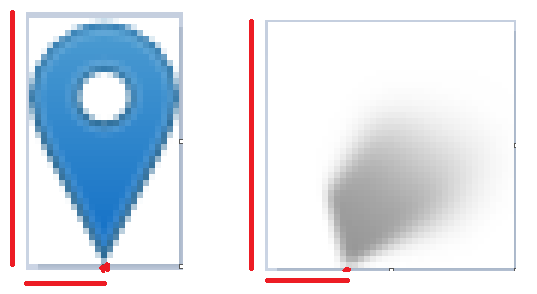
Popups
Popups can be bound to a coordinate, marker, or shape.
marker.bindPopup("<b>Hello world!</b><br>I am a popup.").openPopup();L.popup() .setLatLng([51.5, -0.09]) .setContent("I am a standalone popup.") .openOn(map);
Shapes
- Circles
- Polygons
- Lines
- Paths
var circle = L.circle([51.508, -0.11], 500, {
    color: 'red',
    fillColor: '#f03',
    fillOpacity: 0.5
}).addTo(map);

var polygon = L.polygon([
    [51.509, -0.08],
    [51.503, -0.06],
    [51.51, -0.047]
]).addTo(map);
Layers
Two types:
-
Base layers - only one can be visible
-
Overlays - markers, geoJSON, etc.
Add default layers to the map initialization:
 var map = L.map('map', {
    center: new L.LatLng(40.82,-96.65),
    zoom: 10,
    layers: [streets, cities]
}); L.control.layers(baseMaps, overlayMaps).addTo(map);
        var littleton = L.marker([39.61, -105.02]).bindPopup('This is Littleton, CO.'),
    denver    = L.marker([39.74, -104.99]).bindPopup('This is Denver, CO.'),
    aurora    = L.marker([39.73, -104.8]).bindPopup('This is Aurora, CO.'),
    golden    = L.marker([39.77, -105.23]).bindPopup('This is Golden, CO.');
var cities = L.layerGroup([littleton, denver, aurora, golden]);

var url = 'https://{s}.tiles.mapbox.com/v3/{key}/{z}/{x}/{y}.png';
var attribution = 'MapBox';

var streets   = L.tileLayer(url, {key: "rohs.hkme15d0", attribution: attribution});
var terrain  = L.tileLayer(url, {key: "rohs.hkmf3lfh",   attribution: attribution});

var map = L.map('map', {
    center: new L.LatLng(39.7308819,-105.0348376),
    zoom: 9,
    layers: [streets, cities]
});

var baseMaps = {
	"Streets" : streets,
	"Terrain" : terrain
};

var overlayMaps = {
	"Cities": cities
};

L.control.layers(baseMaps, overlayMaps).addTo(map);
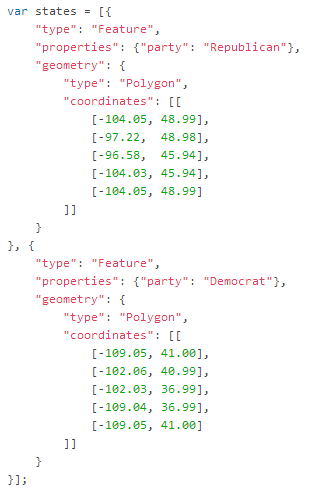
GEOJSON
Programmatically defining map elements is verbose.
GeoJSON is a standard format.
Using GEOJSON
Attach styles to geoJSON shapes:
var myStyle = {
    "color": "red",
    "weight": 5,
    "opacity": 0.65
};

L.geoJson(myLines, {
        style: myStyle
    }).addTo(map);
Points are converted to markers.
Alternatively you can turn them into a shape.
 var geojsonMarkerOptions = {
    radius: 8,
    fillColor: "#ff7800",
    color: "#000",
    weight: 1,
    opacity: 1,
    fillOpacity: 0.8
};

L.geoJson(someGeojsonFeature, {
    pointToLayer: function (feature, latlng) {
        return L.circleMarker(latlng, geojsonMarkerOptions);
    }
}).addTo(map);
You can attach popups to geoJSON features.
 function onEachFeature(feature, layer) {
    if (feature.properties && feature.properties.popupContent) {
        layer.bindPopup(feature.properties.popupContent);
    }
}

L.geoJson(geojsonFeature, {
    onEachFeature: onEachFeature
}).addTo(map);
You can filter geoJSON datasets.
L.geoJson(someFeatures, {
    filter: function(feature, layer) {
        return feature.properties.show_on_map;
    }
}).addTo(map);
Making geojson
MapBox TileMill - native app
Online editor at http://geojson.io/
MongoDB can serve and query geoJSON
routes
MapQuest routing plugin
 var map = L.map('map', {
    layers: MQ.mapLayer(),
    center: [ 38.895345, -77.030101 ],
    zoom: 15
});

var dir = MQ.routing.directions();

dir.route({
    locations: [
        '1600 pennsylvania ave, washington dc',
        '935 pennsylvania ave, washington dc'
    ]
});

map.addLayer(MQ.routing.routeLayer({ directions: dir, fitBounds: true }));
event model
- click
- mouseover object
- dragging
- popups
- resize
- geolocation
- errors
Events Demo
LeafLET.Draw
Marker cluster plugin
PLUGINS
Labels
BounceMarker
KML
geoCSV
Heatmap
Terminator
Context menu
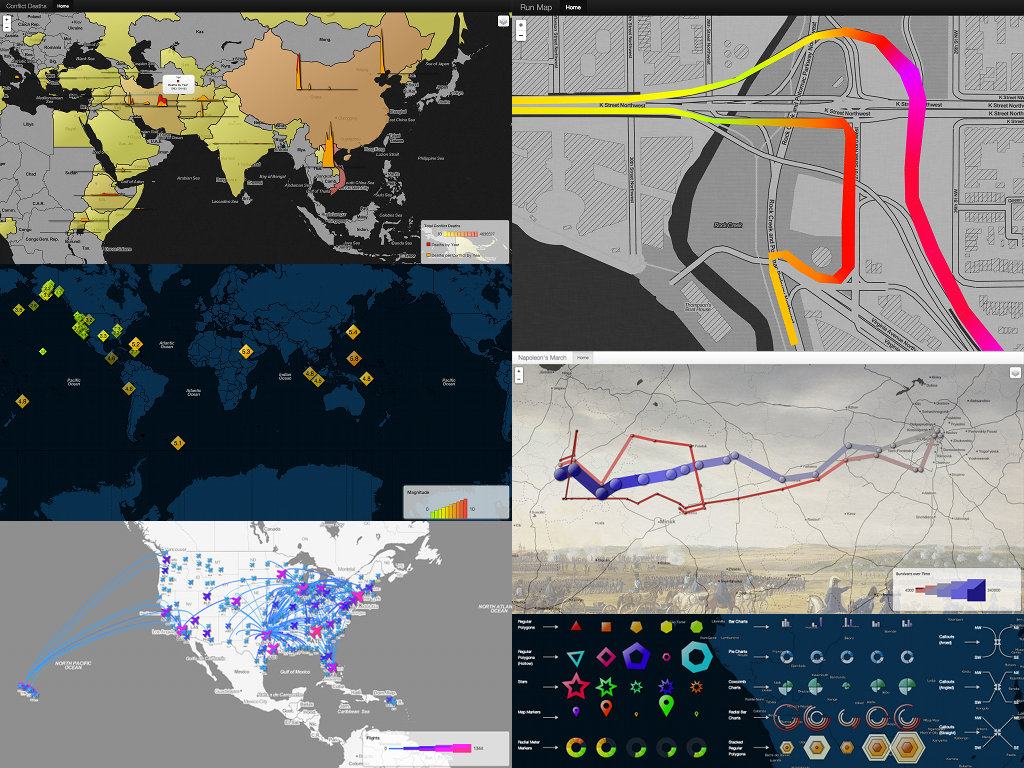
data visualization
RESOURCES
leaflet online
Find this Presentation
All code examples will be at
questions?
leaflet.js
By rohs
leaflet.js
Nebraska Code Camp 2014; The embedded code samples are available at https://gist.github.com/ryanohs/9810195