


Rositsa Zlateva
Full Stack Python Developer and lecturer
Tim Driscoll
Rositsa Kotseva
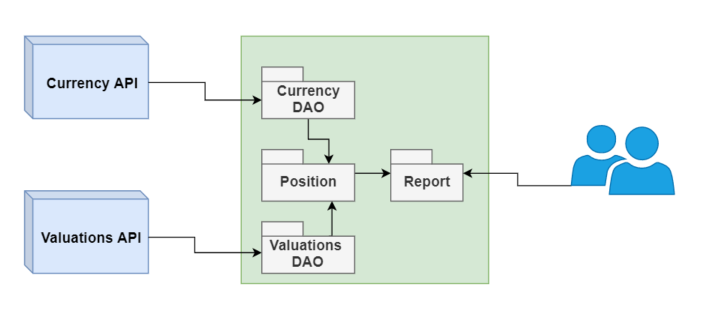
Report
Service
Valuations
Service
Positions
DB
Currency
Service
[2019-10-10 09:39:28,505] INFO in report_controller: Start loading ExposureReport data...
[2019-10-10 09:39:28,944] INFO in valuations_dao: Loaded all security greeks
[2019-10-10 09:39:28,980] INFO in currency_dao: Loading currencies...
[2019-10-10 09:39:36,515] INFO in report_controller: ExportReport data loaded.All the relevant information to a design decision
The information we use to make a design decision
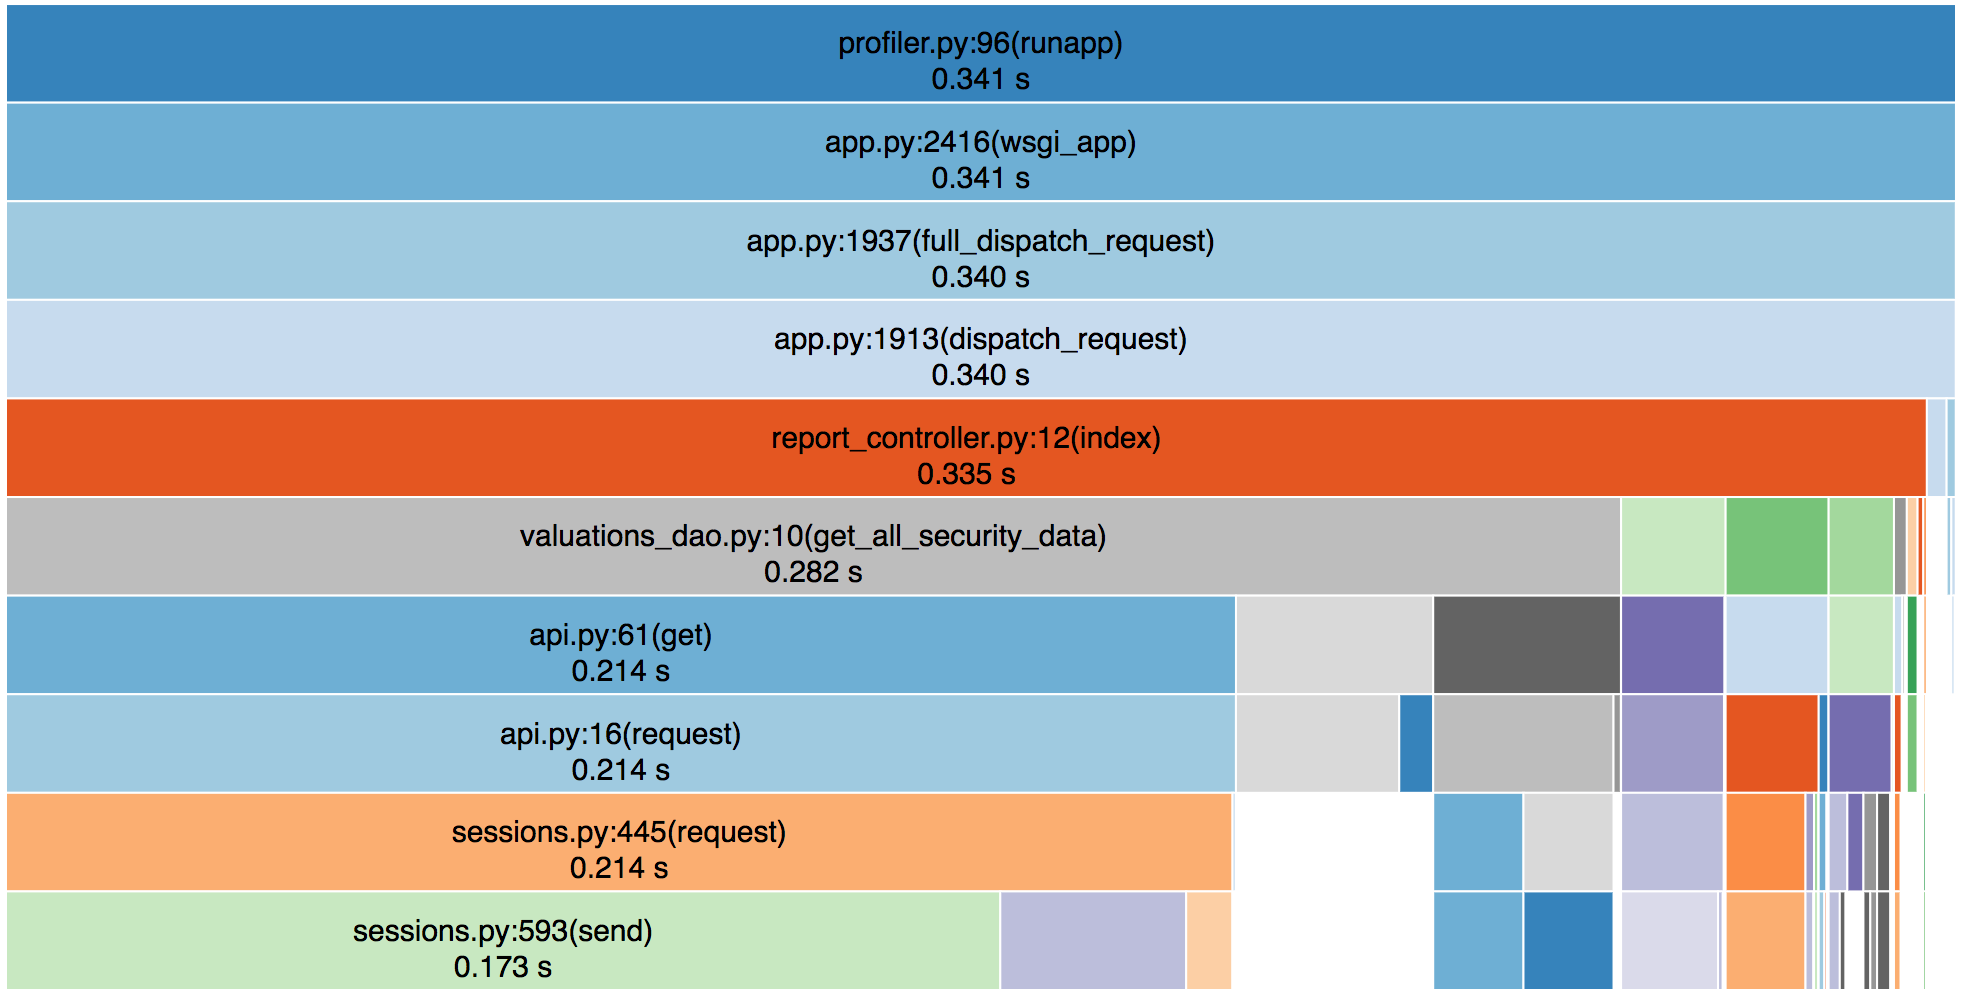
What is Profiling?
Profiling is a form of dynamic program analysis that measures the space, the time, the complexity of a program, the usage of components, the frequency and duration of function calls.
def enable_profiling(app):
	app.wsgi_app = ProfilerMiddleware(app.wsgi_app,
    					  restrictions=[30],
profile_dir=Constants.PROFILE_DIR) def _create_row(self, position):
security, underlying = self.security_dict[position.security_name]
currency = self._get_currency(security.currency_code)
delta_adjusted_exposure = position.calculate_exposure(security, underlying, currency)
return [position.security_name,
position.quantity,
position.market_value,
delta_adjusted_exposure]
def _build_security_dict(self):
result = {}
for security in self.securities: # Iterating the first time
security_name = security.security_name
underlying = self._get_security_data(security.underlying_name)
result[security_name] = (security, underlying)
return result
def _get_security_data(self, security_name):
for security_data in self.securities: # Nested iteration :(
if security_data.security_name == security_name:
return security_dataCurrent Code
    def _create_row(self, position):
        security = self.security_dict[position.security_name]
        underlying = self.security_dict.get(security.underlying_name)
        currency = self._get_currency(security.currency_code)
        delta_adjusted_exposure = position.calculate_exposure(security, underlying, currency)
        return [position.security_name,
                position.quantity,
                position.market_value,
                delta_adjusted_exposure]

    def _build_security_dict(self):
        return {security.security_name: security for security in self.securities}
New and Improved Code!
By Rositsa Zlateva


