Big Data and Python: Lessons Learned
Who am I?
- Software Engineer.
- Worked with Python for about 5 years.
- Last 3 years full-time.
- Hate complexity (when it can be avoided).
- Love Python.
- Founded a start-up in Jan-2013.


The Invisible Man
- Currently exploring Indonesia.
- Every bit as responsible for this talk as I.
- Co-founder of Kapiche.
- Also a Pythonista.
- Full time with Python for 3 years.
- Interested in Data Vis and Machine Learning.
- Very occasional BrisPy attendee.

What we will cover
-
Intro
- What is Big Data™?
- How does Big Data affect me?
- Caterpillar
-
Speed
- Benchmarks
- General Python Tips
- Profiling
- Caterpillar specific stories
-
Today and Tomorrow
- Python 2 vs 3
- Current Caterpillar Status
- The future of Caterpillar
- Demo
- Questions
Intro
What is Big Data?
- Not sure anyone actually knows?
- Basically, when you have a lot of data in a mess, people like to call it Big Data.
- Wikipedia: "an all-encompassing term for any collection of data sets so large and complex that it becomes difficult to process them using traditional data processing applications.".
- Me: "Oh hi data science guy - I've got all this random data from a gazillion different sources. I need to know what it means. Thanks."
- Lots of data, very little structure, looking for meaningful insight from that data.
Think the data equivalent of this.

How Big Data affects me
- Kapiche derives insights from unstructured data.
- That means qualitative + quantitative insights - text and numbers basically.
- To do that, we need to store both the data AND information (statistics) about the data.
- The Kapiche Insights Engine stores data, makes the data searchable and most importantly provides query driven insights into the data.
- Think Elasticsearch on steroids.
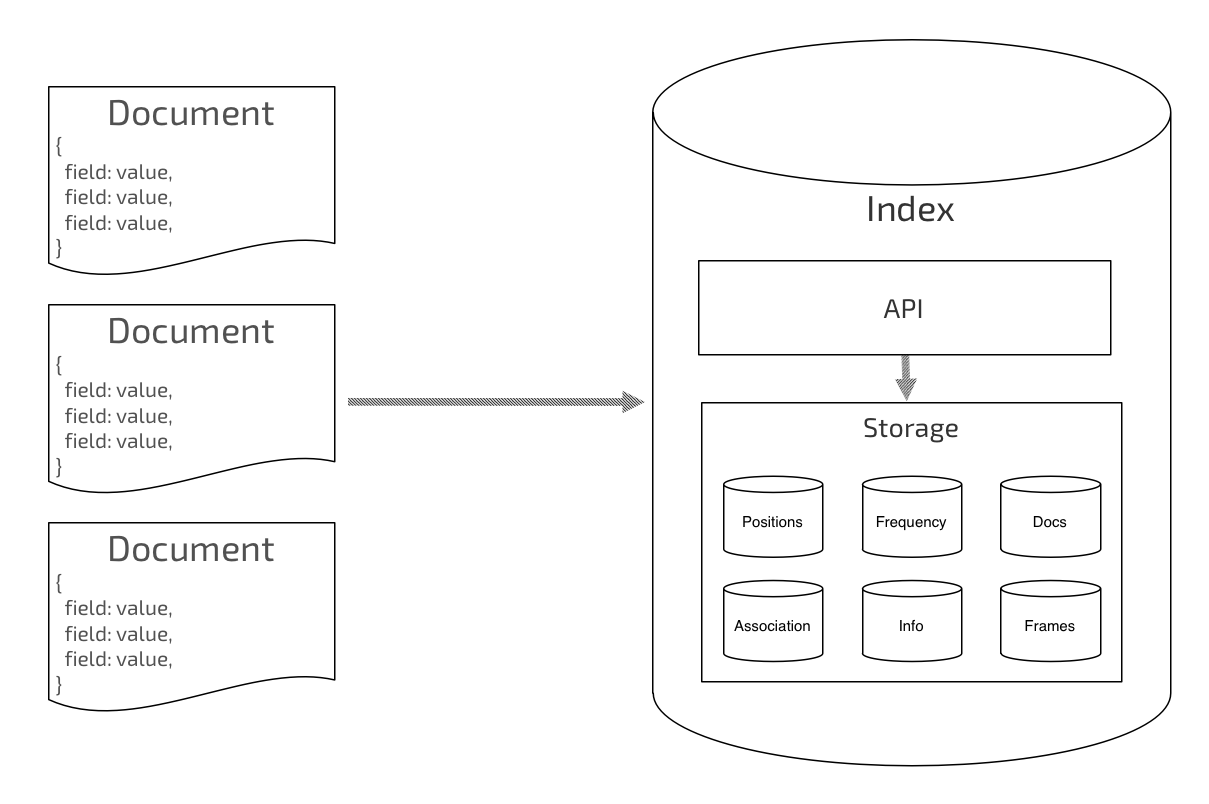
The insight engine
- Written in Python.
- Is both a storage engine and query engine.
- Pluggable storage mechanism (more info later...)
- Stores additional information about the data to make the analytics as fast as possible.
- Is comprised of 2.5 core technologies:
- Caterpillar: The data indexer. Open Source.
- Caterpillar Plugins: Analytics modules that can be used with the indexer. We have open sourced a caterpillar-lsi plugin (Latent Semantic Indexing - see Wikipedia). Internally, we have commercial plugins for calculating influence, extracting topics and measuring sentiment.
- Chrysalis: The server wrapper that provides a REST API and horizontal scaling. Not yet open sourced, but will be.
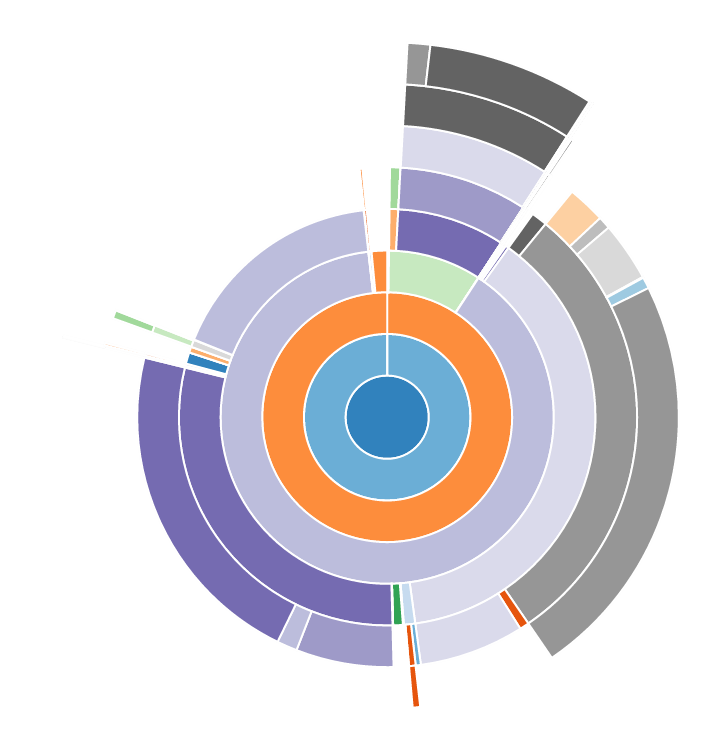
What sort of insights?
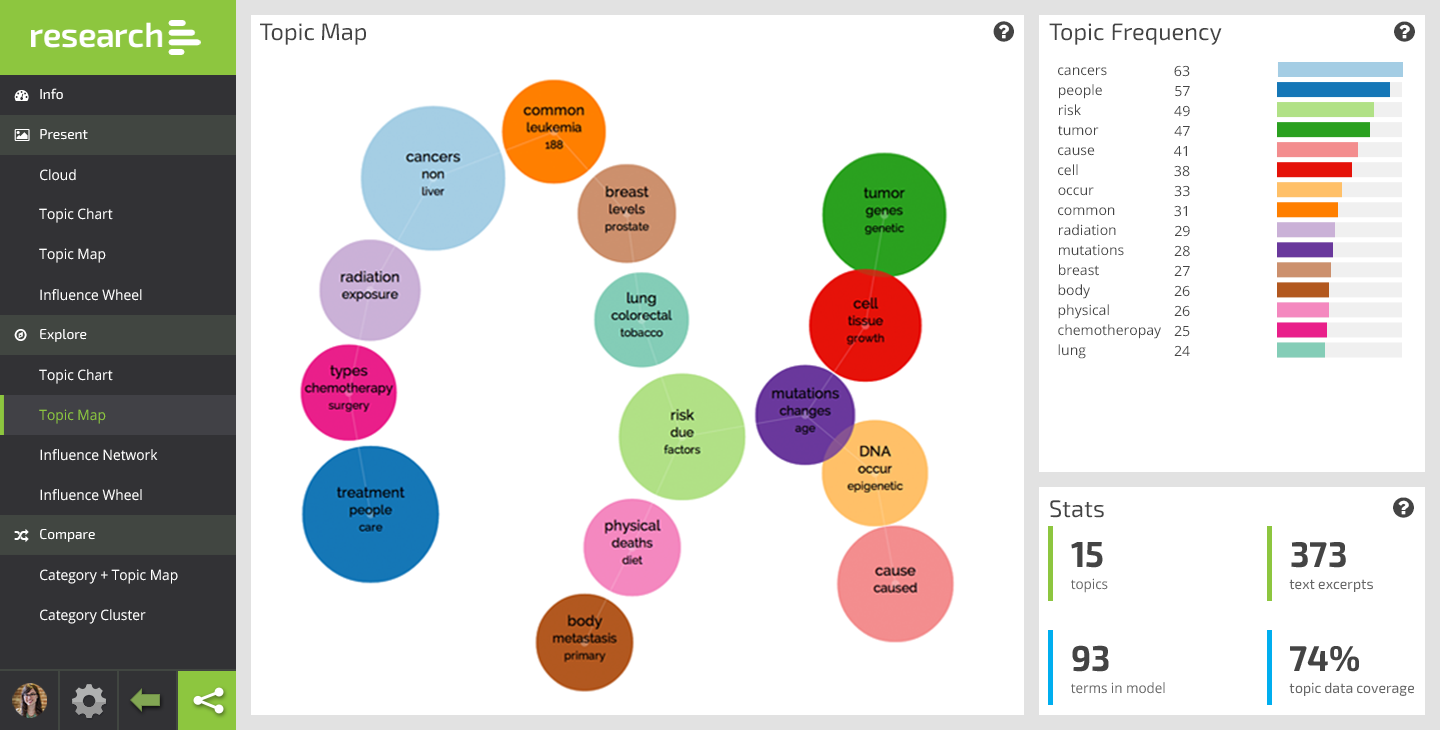
What is a data indexer!?
- To make data searchable (Information Retrieval), it needs to be indexed.
- That means breaking it into it's component parts.
- For example:
- Given the text: "The quick brown fox jumps over the lazy dog"
- And the query: "dog"
- How do I know how to return that piece of text?
- The inverted index of course!
{
    'quick': [(1, 1, 4)],
    'brown': [(1, 2, 6)],
    'fox'  : [(1, 3, 12)],
    'jumps': [(1, 4, 16)],
    'over' : [(1, 5, 22)],
    'lazy' : [(1, 7, 31)],
    'dog'  : [(1, 8, 26)],
}
Taking that 1 step further...
id
Gender
Location
Date
Comment
1
Male
Brisbane
01/12/14
The meetup is awesome. I'd prefer caviar instead of pizza though.
- Each row is a document.
- Each column is a field.
- Every field has an index >>
2
Female
Brisbane
02/12/14
Everything is great but I don't trust the free WiFi. #BigBrother.
{
    'male' : [(1,)],
    'female' : [(2,)],
}
A basic indexing pipeline
We analyse each field:
- Read input (text, dates, numbers whatever).
- Produce a stream of tokens.
- Apply filters to the tokens (stop word filter for example).
- Store the resultant data structure.
An example with a text field
Input: "The quick brown fox jumps over the lazy dog."
Token Stream: [ 'the', 'quick', 'brown', 'fox', 'jumps', 'over', ... ]
Post Filters: [ 'quick', 'brown', 'fox', 'jump', 'over', ... ]
Token Info: position, start index, length (analyser dependent)
Result: "quick": [ (doc_id, position, start, end,) ]
A basic query pipeline
- Parse Query
- Apply filters
- Score Documents
gender: 'male' and comment: 'pizza'
- Each query is itself a document.
- So, we follow the same process - analyse each field.
- Apply filters - gives us a set of documents.
- Score the documents - outside the scope of this talk.
That's IR, but what about analytics?
- There are lots of approaches to text analytics.
- Broadly speaking: NLP, Machine Learning, Other.
- Almost all ML/Other solutions need context blocks to work with.
- Our approach uses an Influence algorithm.
- It requires:
- a configurable context block size.
- an associations matrix - need raw access to tokens per field.
- Language and domain independent.
- Possibly other applications?
Enter Caterpillar!
Caterpillar
- Open Source: https://github.com/Kapiche/caterpillar/
- Pluggable key/value object store for storage (currently only implementation is SQLite).
- Transaction layer for reading/writing (along with associated locking semantics).
- Supports searching indexes with some built in scoring algorithm implementations (including TF/IDF).
- Stores additional data structures for analytics above and beyond traditional information retrieval data structures.
- Plugin architecture for quickly accessing the data structures and performing custom analytics.
- 100% test coverage.
Why?
- There are other indexers out there.
- Why didn't we just use an exist indexer and modify it!?
- In short, existing technologies were either too hard to modify, too young and obscure or not suitable.
- However, even though I think I can defend our decision, there was probably an appreciable amount of not written here / this will be fun going on.
Whoosh
This slide is entirely my own opinion, could well be wrong!
- I spent a week using and perusing Whoosh. I thought for a long time about using it as a starting point.
- There only appears to be one contributor.
- The code reads a lot like Java. Some parts look like they were straight ports from the Lucene code.
- Very little code commenting.
- Not overly fast.
- Ultimately, I thought taking Whoosh and using it for what I needed would take just as long or longer as writing my own.
- No real way to tell if I was right or not.
Apache Lucene
- Java.
- Extremely large and complex.
- An example patch - called omitTFAP - required a 50KB patch that touched 25 core Lucene files.
- What did omitTFAP do? Add an option to not store positions and termFreq with a field.
- Michael McCandless description of the patch - "This was a simple change!"
- His conclusion - "Yes, devs can make these changes... but
that’s not good enough." - Source: https://app.box.com/shared/mqhoyz5jv7
Lucene is hard to change, at low-levels – Index format is too rigid
Michael McCandless - Committer, PMC member Lucene/Solr

Why?
- So the choices were:
- Persist with Whoosh, taking the time to understand it and add the features we needed (basically fork the project); or
- Use Lucene with the knowledge that making changes to core Lucene might be impossible (so possibly maintain an external wrapper that uses it underneath) and the endless task of tuning and monitoring a JVM runtime would be required; or
- Develop our own solution running the risk that it could be a long running task and take much longer than anticipated;
- Obviously, we went with option 3. And we don't regret it...yet.
- Side Note: Elasticsearch is a server-side wrapper around Lucene. It provides sharding, redundancy and a REST API. If you think the Lucene source code is scary, take a look at Elasticsearch.
So what's the result?
import os
import shutil
import tempfile

from caterpillar.processing.index import IndexWriter, IndexConfig, IndexReader
from caterpillar.processing.schema import TEXT, Schema
from caterpillar.searching.query.querystring import QueryStringQuery
from caterpillar.storage.sqlite import SqliteStorage

path = tempfile.mkdtemp()
try:
    index_dir = os.path.join(path + "examples")
    with open('caterpillar/test_resources/alice.txt', 'r') as f:
        data = f.read()
        with IndexWriter(index_dir, IndexConfig(SqliteStorage, Schema(text=TEXT))) as writer:
            writer.add_document(text=data)

    with IndexReader(index_dir) as reader:
        searcher = reader.searcher()
        results = searcher.search(QueryStringQuery('W*e R?bbit and (thought or little^1.5)'))
        print "Query: 'W*e R?bbit and (thought or little^1.5)'"
        print "Retrieved {} of {} matches".format(len(results), results.num_matches)
finally:
    shutil.rmtree(path)
Speed
How fast is caterpillar?
- We recently indexed all of Wikipedia on an Amazon EC2 instance.
- Instance: c3.2xlarge - 8 cores, 16GiB RAM, 1 x 4000 IOPS SSD.
- There are ~15M English articles (in August), ~14GB (only counting the raw text).
- Indexing all articles took ~12 hours. That means ~1GB per hour.
How does that compare?
- Apache Lucene claims ~200GB per hour. That's on a 24 core machine with 10 high end SSDs in RAID 0 (striped). Obviously that is VERY fast. So fast I am skeptical.
- Whoosh doesn't give any real statistics but we can test it....
- The Test: Add 2,640 articles in plain text format running on my local machine to an index.
- The Contestants: Whoosh, Lucene (PyLucene), Caterpillar.
-
The Environment: My laptop.
- MacBook Pro Retina Mid 2012
- 2.6 GHz Intel Core i7 (4 cores, 8 virtual cores)
-
8 GB 1600 MHz DDR3
-
APPLE SSD SM512E - 14.1 MB/s Random 4k read/writes (benchmark)
Whoosh
from whoosh.fields import TEXT, Schema, ID
from whoosh.index import create_in, os

schema = Schema(
    title=TEXT(stored=True),
    text=TEXT(stored=True)
)
ix = create_in(index, schema)  # Create index
writer = ix.writer()
for article in articles:
    writer.add_document(
        title=unicode(page[1], 'utf-8'),
        text=unicode(page[4], 'utf-8')
    )
writer.commit()
The basic code
Actual Code: here.
Result - 18.160s
Lucene (PyLucene)
import lucene
from java.io import File
from org.apache.lucene.analysis.standard import StandardAnalyzer
from org.apache.lucene.document import Document, Field, FieldType
from org.apache.lucene.index import FieldInfo, IndexWriter, IndexWriterConfig
from org.apache.lucene.store import SimpleFSDirectory
from org.apache.lucene.util import Version

store = SimpleFSDirectory(File(index_dir))
analyzer = StandardAnalyzer(Version.LUCENE_CURRENT)
config = IndexWriterConfig(Version.LUCENE_CURRENT, analyzer)
config.setOpenMode(IndexWriterConfig.OpenMode.CREATE)
writer = IndexWriter(store, config)

title = FieldType()
title.setIndexed(True)
title.setStored(True)
title.setTokenized(False)
title.setIndexOptions(FieldInfo.IndexOptions.DOCS_AND_FREQS)

text = FieldType()
text.setIndexed(True)
text.setStored(True)
text.setTokenized(True)
text.setIndexOptions(FieldInfo.IndexOptions.DOCS_AND_FREQS_AND_POSITIONS)

for article in articles:
    doc = Document()
    doc.add(Field("title", page[1], title))
    doc.add(Field("text", page[2], text))
    writer.addDocument(doc)
The (not really) basic code
Actual Code: here.
Result - 1.666s
Caterpillar
from caterpillar.processing.index import IndexWriter, IndexConfig
from caterpillar.processing.schema import Schema, TEXT, CATEGORICAL_TEXT

config = IndexConfig(
    SqliteStorage,
    Schema(
        title=TEXT(indexed=False, stored=True),
        text=TEXT(indexed=True, stored=True),
        url=CATEGORICAL_TEXT(stored=True)
    )
)
with IndexWriter('/tmp/cat-index', config) as writer:  # Create index
    for article in articles:
        writer.add_document(title=article[1], text=article[2])
The basic code
Actual Code: here.
Result - 15.655s

Damn...
BUT!!!
- Caterpillar breaks documents up into context blocks.
- By default, those context blocks are 2 sentences long.
- To do sentence tokenisation, it uses the Punkt tokenizer from NLTK. And that adds overhead....

Caterpillar - Reboot
Result - 10.183s
Remove sentence tokenisation.
Well then...

BUT!!!
- Lucene cheats!!!
- There is no such thing as a GIL in Java, and Lucene leverages this.
- So, how does caterpillar scale with more cores? Can we make this more parallel?
- Lets give it a go....
Caterpillar - Reboot (again)
Use 2 process to index the articles.
import begin
from concurrent import futures
from caterpillar.processing.index import IndexWriter, IndexConfig
from caterpillar.processing.schema import Schema, TEXT, CATEGORICAL_TEXT

def index(path, articles):
    # Same index code as before...omitted to save space

def chunks(l, n):
    """Yield successive n-sized chunks from l."""
    for i in xrange(0, len(l), n):
        yield l[i:i+n]

@begin.start
def run(articles):
    chunks = [articles[:len(articles)/2], articles[len(articles)/2:]]
    paths = [
        os.path.join('/tmp/wiki-index', 'index-{}'.format(i))
        for i in range(len(chunks)
    ]
    with futures.ProcessPoolExecutor() as pool:
        pool.map(index, paths, chunks)
Result - 6.299s
Taking Stock
- My competitive nature means I can't pretend to be happy about the time difference between Caterpillar and PyLucene.
- However, when I wiped away the tears, it wasn't all doom and gloom.
- Caterpillar is almost twice as quick as Whoosh even with the NLTK sentence tokenizer which brings added analytics possibilities.
- AFAIK it's that fastest pure python indexer available.
- However, it appears to be a clear demonstration of compiled vs interpreted.
- There is no denying the API is much nicer in both Whoosh and Caterpillar.
So, how did we get here?
- There are a number of simple things you can do to improve the speed of any Python 2 code you write.
- I have some general tips that apply to Python 2. Maybe others can talk about Python 3.
- If you need to optimise your code, the first step will be profiling your code.
- Some (maybe most) of what I am about to say will be well known to some. I'm expecting (and hoping) people will tell me I'm wrong about some things.
- There are also specifics things inside Caterpillar that we did that have helped with speed and might be interesting.
General tips
Calling methods/functions is slow
>>> import timeit
>>> timeit.timeit('a = 5')
0.03456282615661621
>>> timeit.timeit('foo()', 'def foo(): a = 5')
0.14389896392822266
The practical implication of this for me is that sometimes you need to forgo a "sexier" API in favour of less nested calls. I was overly addicted to the neat APIs possible in Python because of the bitterness instilled in me by Java, so I've had to rein that in. Still more to do on that front in Caterpillar.
Avoid if..else on collections
positions = dict()

for token in tokens:
    if token in positions:
        positions[token].append((t.index, t.position,)]
    else:
        positions[token] = [(t.index, t.position,)]
The above code always runs two operations. If you are doing this thousands of times in an inner loop, it will add up! It doesn't need to be this way.
positions = dict()

for token in tokens:
    try:
        positions[token].append((t.index, t.position,)]
    except KeyError:
        positions[token] = [(t.index, t.position,)]
Know the builtins!
You can think of map as a for moved into C code. The only restriction is that the "loop body" of map must be a function call. Besides the syntactic benefit of list comprehensions, they are often as fast or faster than equivalent use of map.
This can be extended to don't write something yourself if there is an equivalent builtin. Chances are, the builtin is written in C and much faster then your pure Python implementation.
Know the Big O of basic operations on the builtin types
This can make a big difference to your everyday code.
>>> timeit.timeit('2 in my_list', 'my_list = [1,2,3,4,5]')
0.05846595764160156
>>> timeit.timeit('2 in my_set', 'my_set = set([1,2,3,4,5])')
0.04645490646362305
Also, don't forget about collections.deque!
Time Complexity article on the Python Wiki: here.
Lecture on Complexity of Python Operations: here.
And the list goes on..
- That's some general tips you should be able to help you out in almost every situation.
- In general, it boils down to know your tools and keep it simple stupid.
- But, if you are dumb enough to try and take on a compiled library from an interpreted environment or you have some other situation where execution time matters, you have to profile.
PythonSpeed article on the Wiki: here.
Profiling
- It really is dead simple. Nothing to be scared of.
- The basic idea is to start with profile / cProfile (from the stdlib).
- From there, there are other tools you can use to visualise the results.
- Or, you can just start at the terminal.
- I like pretty pictures personally.
- Finally, you can go a step further by using a line profiler or memory profiler.
- Dont forget, profiling can be fun....
...especially when you find that simple speed-up!

profile / cProfile
- Unless you have a very good reason not to (like extending the profile module), you will want to use cProfile. Its overheads are much smaller than its Python equivalent.
- It can be invoked as a script that takes another script (python -m) or in code.
- Generally, I always enact it from code because 99% of the time, I use another tool to visualise the output.
- By default, profile / cProfile will print out a table with information about all function calls.
- You can customise how the table is printed, interact programmatically with the statistic captured or save the output to a file (using the pstats module).
Sample output
      197 function calls (192 primitive calls) in 0.002 seconds

Ordered by: standard name

ncalls  tottime  percall  cumtime  percall filename:lineno(function)
     1    0.000    0.000    0.001    0.001 <string>:1(<module>)
     1    0.000    0.000    0.001    0.001 re.py:212(compile)
     1    0.000    0.000    0.001    0.001 re.py:268(_compile)
     1    0.000    0.000    0.000    0.000 sre_compile.py:172(_compile_charset)
     1    0.000    0.000    0.000    0.000 sre_compile.py:201(_optimize_charset)
     4    0.000    0.000    0.000    0.000 sre_compile.py:25(_identityfunction)
   3/1    0.000    0.000    0.000    0.000 sre_compile.py:33(_compile)
import cProfile
import re
cProfile.run('re.compile("foo|bar")')
Produces
snakeviz
- Using pstats.dump_stats() means you can use other tools to visualise the profile dump. My favourite is snakeviz.
def do_some_work_yo():
    print 'Some work'

pr = cProfile.Profile()
pr.runcall(do_some_work_yo)
ps = pstats.Stats(pr)
ps.dump_stats("storage_benchmark.profile")
Demo......
line_profiler
- If you are still having trouble tracking down the exact cause of slowness, line_profiler might be a good next step.
- The argument for line_profiler is that cProfile only details function calls and it isn't always enough to figure out which part of the function is actually slow.
- In practice, I find that is rarely the case, but it is still a nice tool to have in your locker.
- You will typically only be interested in profiling one function (it literally prints out each line of code with profiling information so it is very verbose).
- Be aware that line_profiler adds significant overhead to runtime but it's consistent enough to give you meaningful results.
Typical line_profiler workflow
You need to tell it what functions to profile. Easiest way to start is via the kernprof script.
$ kernprof -l script_to_profile.pykernprof inserts a LineProfiler instance into the __bultins__ namespace under the name profile. It can be used as a decorator. As adjust your code.
@profile
def slow_function(a, b, c):
    ...
kernprof saves to a file <script_name>.lprof. This is the out you run line_profiler on.
$ python -m line_profiler script_to_profile.py.lprofAnd voilà
Pystone(1.1) time for 50000 passes = 2.48
This machine benchmarks at 20161.3 pystones/second
Wrote profile results to pystone.py.lprof
Timer unit: 1e-06 s

File: pystone.py
Function: Proc2 at line 149
Total time: 0.606656 s

Line #      Hits         Time  Per Hit   % Time  Line Contents
==============================================================
   149                                           @profile
   150                                           def Proc2(IntParIO):
   151     50000        82003      1.6     13.5      IntLoc = IntParIO + 10
   152     50000        63162      1.3     10.4      while 1:
   153     50000        69065      1.4     11.4          if Char1Glob == 'A':
   154     50000        66354      1.3     10.9              IntLoc = IntLoc - 1
   155     50000        67263      1.3     11.1              IntParIO = IntLoc - IntGlob
   156     50000        65494      1.3     10.8              EnumLoc = Ident1
   157     50000        68001      1.4     11.2          if EnumLoc == Ident1:
   158     50000        63739      1.3     10.5              break
   159     50000        61575      1.2     10.1      return IntParIO
Some resources
Final word on profiling
- I hope I demonstrated that profiling really is easy.
- It really should be your first stop for optimising code.
- You will develop your own best practises based on your experience with profiling.
Specific notes on Caterpillar
- Remember I said I hated complexity? Well we started SIMPLE!
- There was lots of loops, really simple serialisation and no transactions, plus many other things.
-
Profiling told us:
- Using if..else when building the indexes was bad.
- Using JSON serialisation was bad.
- Trying to merge new data into large indexes was expensive.
- Time spent writing to disk was excessive (transactions).
- Unfortunately, I think we have probably only scratched the surface. That's both exciting and soul crushing.
Today and Tomorrow
To 3 or not to 3
- Didn't think I would be allowed to give a talk on Python without touching on Python 2 vs 3.
- Caterpillar is Python 2. But why?
- Remember, I hate complexity.
- That meant leaning on NLTK to start. And at the time, it had no Python 3 support.
- As we now know, NLTK isn't optimised for speed and hence needs to be removed. As does my only reason for being on Python 2.
- So, that means Python 3 is on the todo list. The question now becomes whether to support Python 2 at all?
The Current status of Caterpillar
Notes
- There is an internal storage layer that presents itself as a key/value store.
- It provides access to an unlimited number of containers for you to store data in.
- Each container can be thought of as an individual key/value store.
- Right now, the only concrete implementation of the layer is based on SQLite.
- Originally, serialisation was via JSON and index merges where done in the foreground everytime you add a document.
- It became very obvious when we started playing with the wikipedia data that this just wasn't going to scale.
The Future for Caterpillar
- Finish segmented index implementation. That means finding an efficient way to do merges. Maybe Numpy?
- Figure out if SQLite is the best solution for us. When you get past 1mb of data per term, it seems like it isn't.
- Removing NLTK and moving to Python 3.
- Creating the association index on-the-fly.
- Helpers welcome!
And for my last trick...a demo!
Questions?
Resources
Thanks!
Big Data and Python: Lessons Learned
By Ryan Stuart
Big Data and Python: Lessons Learned
Python is gaining momentum as the preferred tool for data science and experimentation. This is largely due to powerful libraries like Gensim and Pandas that leverage Python's ease of use. But can Python be used in an enterprise-oriented Big Data context? We have attempted to do exactly that with our Python text indexer Caterpillar, and following are some of the lessons we learned along the way.