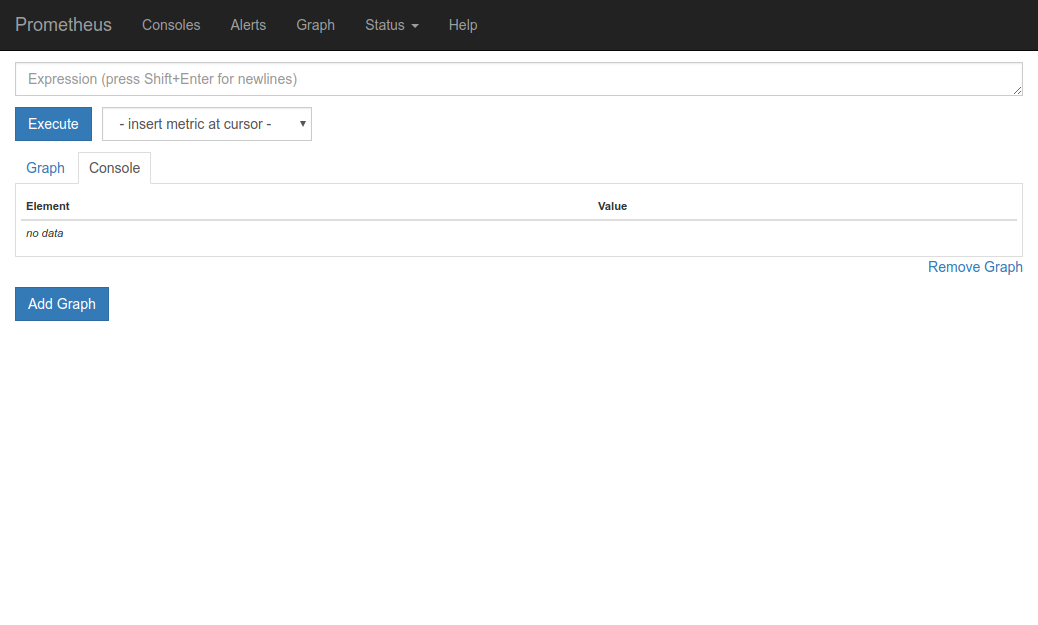
Prometheus


Prometheus
/metrics
/metrics
/metrics
http://app
node_exporter
blackbox_exporter
your app
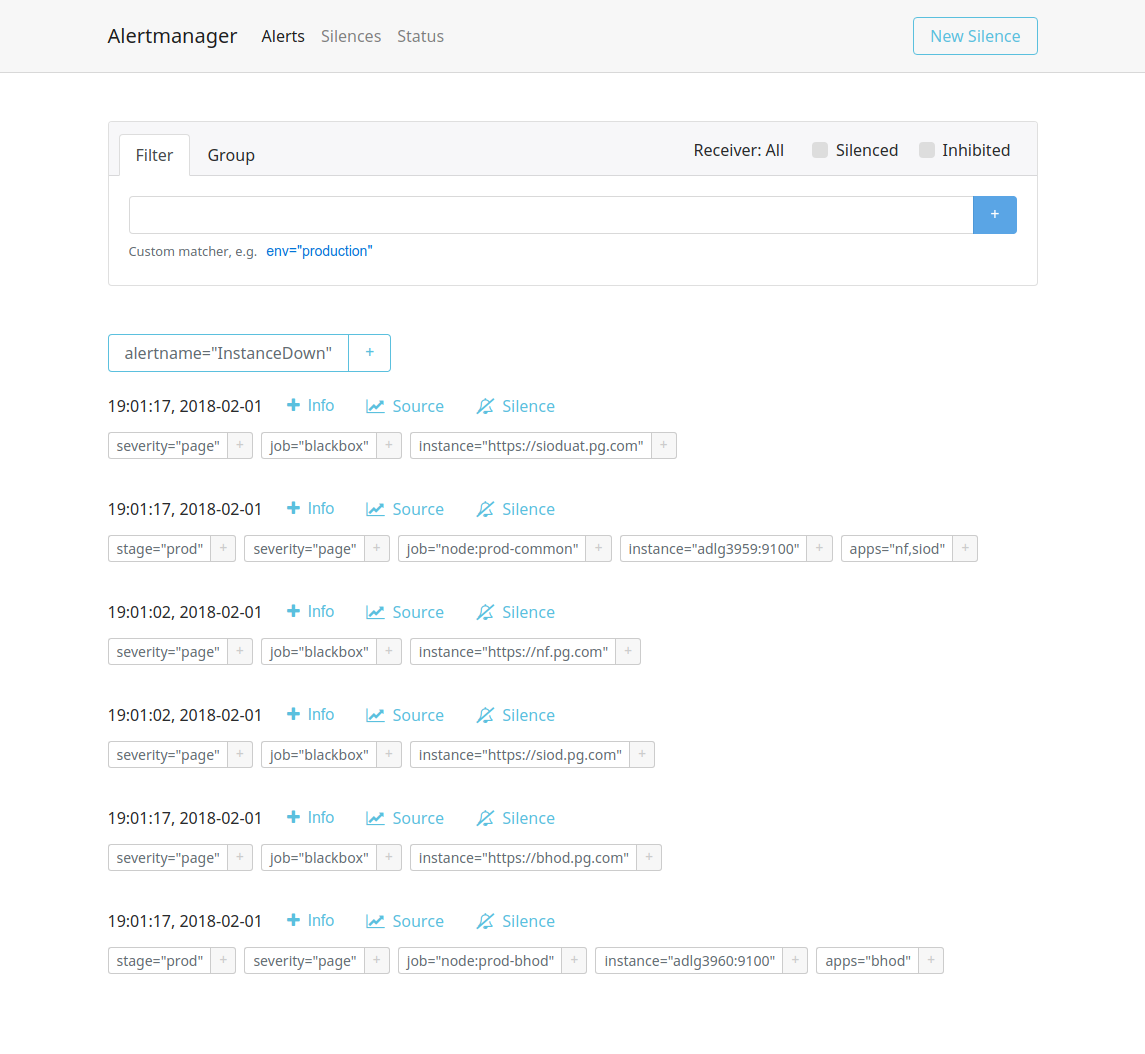
Alertmanager
Slack
HipChat
/metrics
dockerd
...
Graphana
nginx
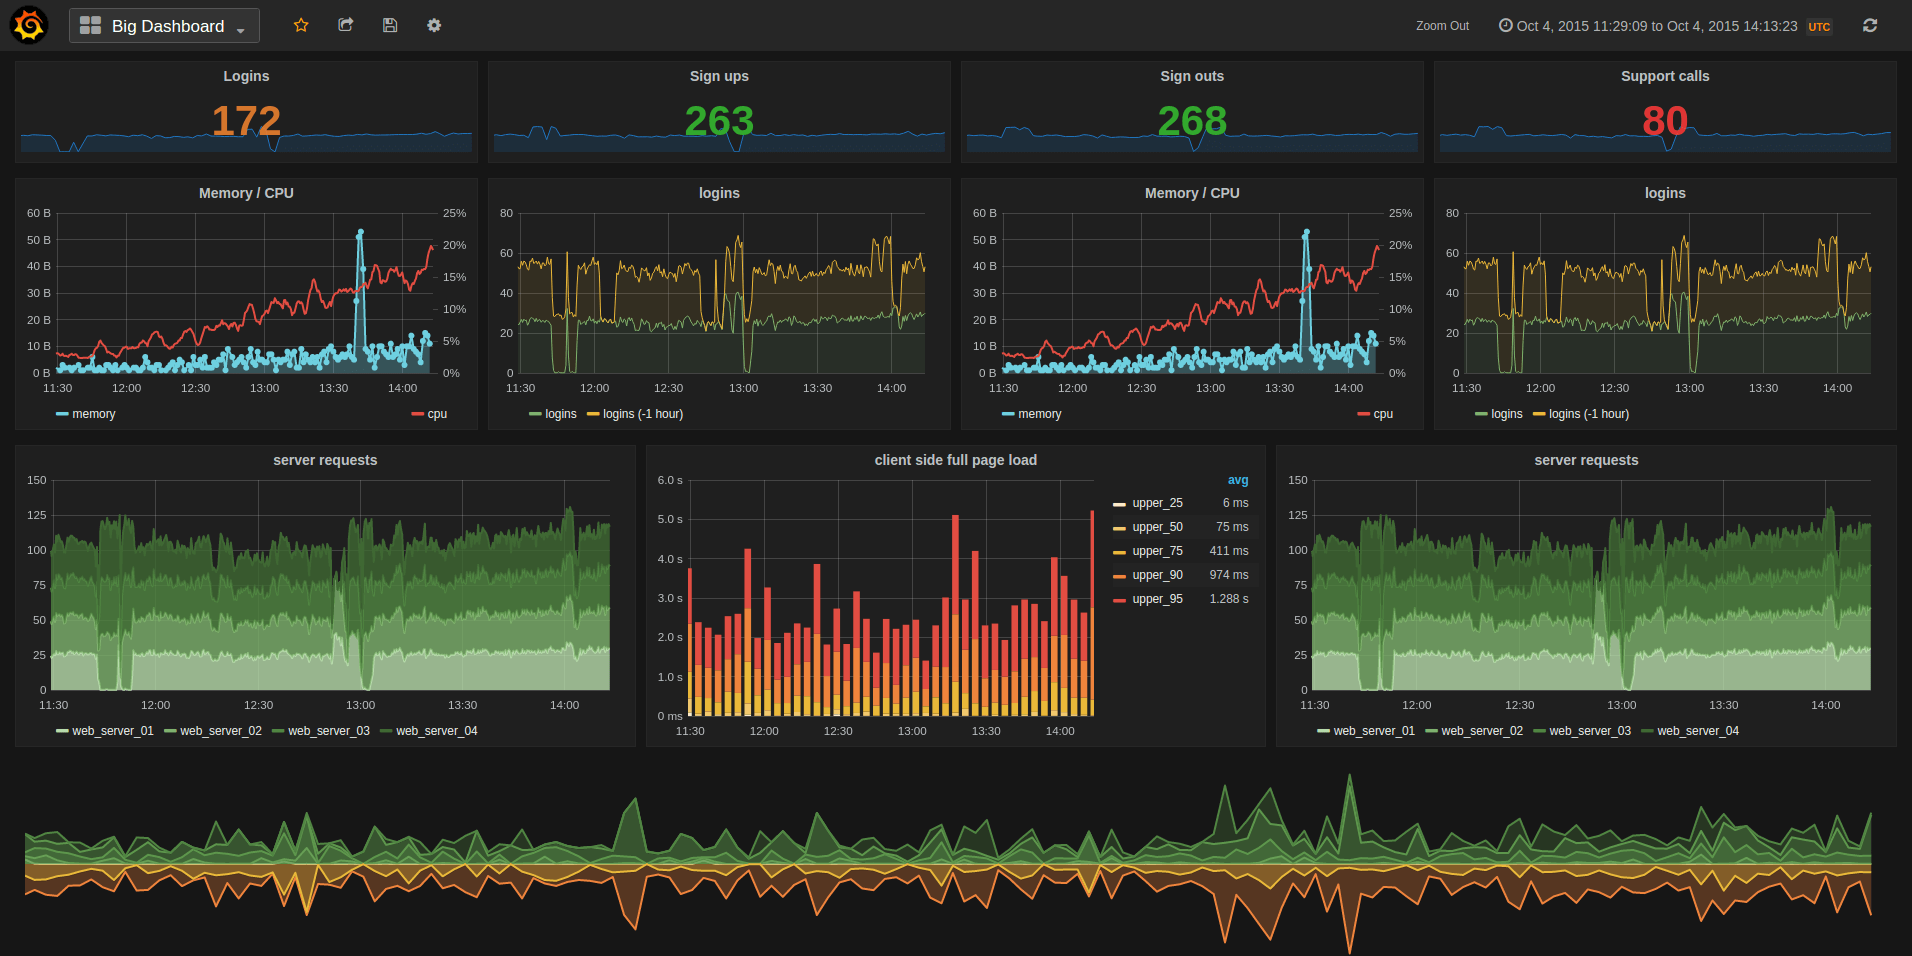
Graphana
# HELP node_boot_time Node boot time, in unixtime.
# TYPE node_boot_time gauge
node_boot_time 1.517351403e+09
# HELP node_context_switches Total number of context switches.
# TYPE node_context_switches counter
node_context_switches 6.44731676e+08
# HELP node_cpu Seconds the cpus spent in each mode.
# TYPE node_cpu counter
node_cpu{cpu="cpu0",mode="guest"} 0
node_cpu{cpu="cpu0",mode="guest_nice"} 0
node_cpu{cpu="cpu0",mode="idle"} 144085.39
node_cpu{cpu="cpu0",mode="iowait"} 328.38
node_cpu{cpu="cpu0",mode="irq"} 0
node_cpu{cpu="cpu0",mode="nice"} 37.05
node_cpu{cpu="cpu0",mode="softirq"} 217.95
node_cpu{cpu="cpu0",mode="steal"} 0
node_cpu{cpu="cpu0",mode="system"} 2921.34
node_cpu{cpu="cpu0",mode="user"} 10239.39
# HELP node_disk_bytes_read The total number of bytes read successfully.
# TYPE node_disk_bytes_read counter
node_disk_bytes_read{device="sda"} 1.23858432e+09
# HELP node_disk_bytes_written The total number of bytes written successfully.
# TYPE node_disk_bytes_written counter
node_disk_bytes_written{device="sda"} 6.442708992e+09
# HELP node_filesystem_avail Filesystem space available to non-root users in bytes.
# TYPE node_filesystem_avail gauge
node_filesystem_avail{device="/dev/sda1",fstype="ext4",mountpoint="/"} 1.94086912e+09
node_filesystem_avail{device="/dev/sdb1",fstype="ext4",mountpoint="/home"} 5.123076096e+09
node_filesystem_avail{device="/dev/sdc1",fstype="ext4",mountpoint="/usr"} 8.573468672e+09
# HELP node_filesystem_free Filesystem free space in bytes.
# TYPE node_filesystem_free gauge
node_filesystem_free{device="/dev/sda1",fstype="ext4",mountpoint="/"} 2.513129472e+09
node_filesystem_free{device="/dev/sdb1",fstype="ext4",mountpoint="/home"} 8.264261632e+09
node_filesystem_free{device="/dev/sdc1",fstype="ext4",mountpoint="/usr"} 9.663934464e+09
# HELP node_filesystem_size Filesystem size in bytes.
# TYPE node_filesystem_size gauge
node_filesystem_size{device="/dev/sda1",fstype="ext4",mountpoint="/"} 1.0800959488e+10
node_filesystem_size{device="/dev/sdb1",fstype="ext4",mountpoint="/home"} 6.7506008064e+10
node_filesystem_size{device="/dev/sdc1",fstype="ext4",mountpoint="/usr"} 2.1002579968e+10
node_cpu{cpu="cpu0",mode="idle"} 144085.39node_cpu{cpu="cpu0",instance="adlg3960:9100",job="node:prod-bhod",mode="idle"} 144085.39name
labels
numerical
value
QUERYING
METRIC TYPES
Counter
Gauge
Histogram
Summary
# HELP Request latency in seconds.
# TYPE summary
requests_latency_seconds_count{path="/metrics/",status="200",} 5767.0
requests_latency_seconds_sum{path="/metrics/",status="200",} 16.473172025
# HELP The time taken fulfilling servlet requests
# TYPE histogram
servlet_request_seconds_bucket{context="/metrics",le="0.01",} 5756.0
servlet_request_seconds_bucket{context="/metrics",le="0.1",} 5767.0
servlet_request_seconds_bucket{context="/metrics",le="1.0",} 5767.0
servlet_request_seconds_bucket{context="/metrics",le="10.0",} 5767.0
servlet_request_seconds_bucket{context="/metrics",le="+Inf",} 5767.0
servlet_request_seconds_count{context="/metrics",} 5767.0
servlet_request_seconds_sum{context="/metrics",} 16.43492092899999# HELP Current thread count of a JVM
# TYPE gauge
jvm_threads_current 71.0# HELP Started thread count of a JVM
# TYPE counter
jvm_threads_started_total 162.0prometheus.yml
global:
  scrape_interval:     15s # Set the scrape interval to every 15 seconds. Default is every 1 minute.
  evaluation_interval: 15s # Evaluate rules every 15 seconds. The default is every 1 minute.
  scrape_timeout:      10s # is set to the global default (10s).

alerting:
  alertmanagers:
  - static_configs:
    - targets:
      - 127.0.0.1:9093

rule_files:
  - "rules/*.yml"

scrape_configs:
  - job_name: "node:prod"
    static_configs:
      - targets: [ 'adlg3959:9100', 'adlg3960:9100' ]
        labels:
          stage: prod

  - job_name: "spring:app1"
    metrics_path: /app1/mgmt/prometheus              # default metrics_path is '/metrics'
    basic_auth:
      username: metrics
      password: <secret>
    static_configs:
      - targets:
        - adlg3944:9001 # dev
        - adlg3944:8001 # uat

  - job_name: "docker"
    static_configs:
      - targets: [ '198.168.0.100:9323' ]
rules/critical.yml
groups:
- name: critical
rules:
- alert: instance-down
expr: up == 0
for: 1m
annotations:
description: '{{ $labels.instance }} of job {{ $labels.job }}
has been down for more than 5 minutes.'
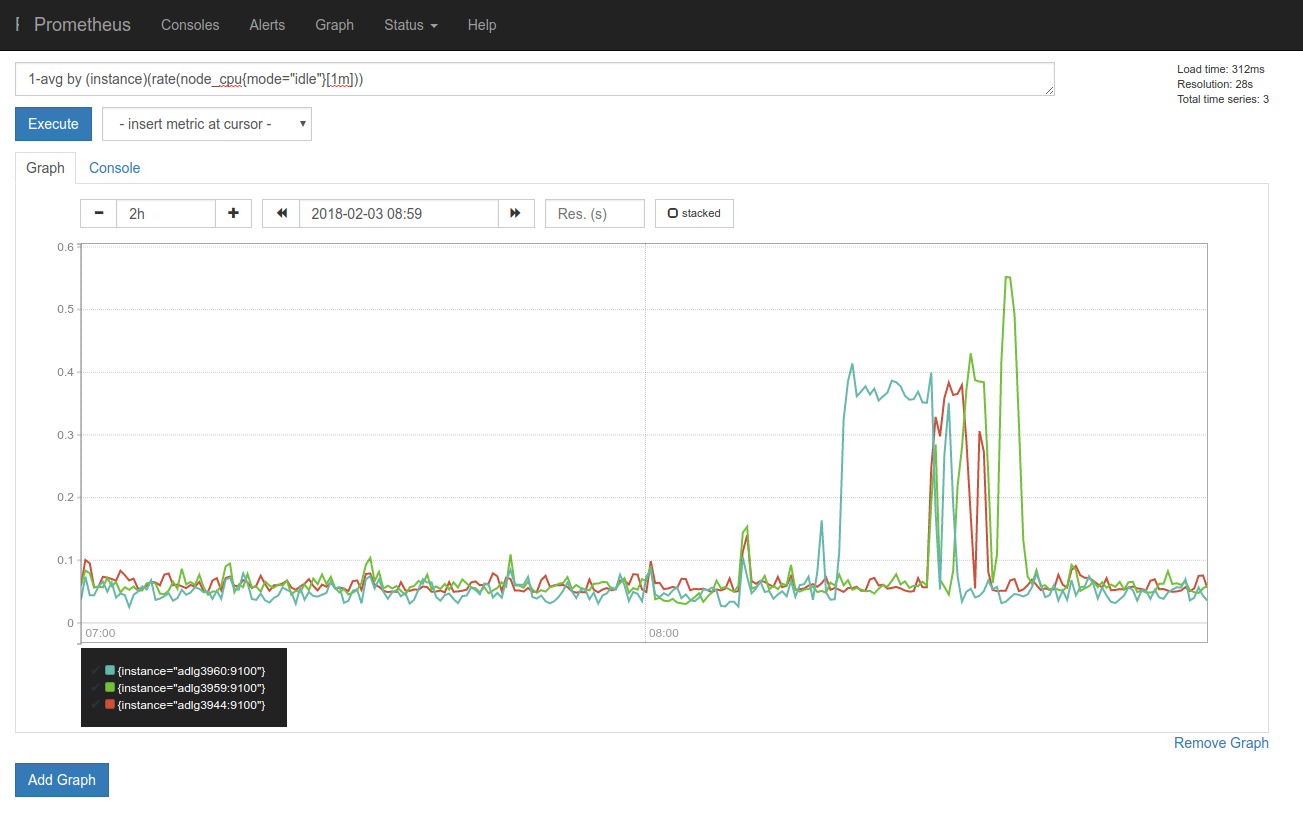
- alert: cpu-usage
expr: 1 - avg by (instance) (rate(node_cpu{mode="idle"}[5m])) > 0.75
for: 2m
annotations:
description: '{{$labels.instance}}: CPU usage is above 75%
(current value is: {{ $value }})'
- alert: ssl-expires-month
expr: probe_ssl_earliest_cert_expiry - time() < 30 * 60 * 60 * 24
annotations:
description: 'SSL certificate for {{ $labels.instance }}
expires in {{ $value | humanizeDurationl }}'
installation
$ wget -c 'https://github.com/prometheus/prometheus/releases/
    download/v2.1.0/prometheus-2.1.0.linux-amd64.tar.gz'
$ tar zxvf prometheus-2.1.0.linux-amd64.tar.gz
$ ls -l
total 106604
drwxr-xr-x 2     4096 sty 19 12:59 console_libraries
drwxr-xr-x 2     4096 sty 19 12:59 consoles
drwxr-xr-x 3     4096 lut  4 14:20 data
-rw-r--r-- 1    11357 sty 19 12:59 LICENSE
-rw-r--r-- 1     2769 sty 19 12:59 NOTICE
-rwxr-xr-x 1 65537120 sty 19 13:02 prometheus
-rw-r--r-- 1      928 sty 19 12:59 prometheus.yml
-rwxr-xr-x 1 43578134 sty 19 13:04 promtool
$ cd prometheus-2.1.0.linux-amd64
$ ./prometheus
... msg="Loading configuration file" filename=prometheus.yml
... msg="Start listening for connections" address=0.0.0.0:9090
... msg="Server is ready to receive web requests."
[Unit]
Description=prometheus
[Service]
ExecStart=/opt/prometheus/prometheus/prometheus
[Install]
WantedBy=multi-user.target
/etc/systemd/system/prometheus.service
# Start at boot
$ systemctl enable prometheus

# Start now
$ systemctl start prometheus
instrumenting you app
class YourClass {
  static final Counter requests = Counter.build()
     .name("my_library_requests_total").help("Total requests.")
     .labelNames("method").register();

  void processGetRequest() {
    requests.labels("get").inc();
    // Your code here.
  }
}
instrumenting you app
@Controller
public class MyController {
  @RequestMapping("/")
  @PrometheusTimeMethod(
    name = "my_controller_path_duration_seconds",
    help = "Some helpful info here"
  )
  public Object handleMain() {
    // Do something
  }
}
Prometheus
By Krzysztof Rzymkowski


