ANALYSIS PLAYGROUND
1
0
2
3
Excluding the data from 5 cm away or closer to the checkpoints do not change the significance of the factors.
| Factor (0) | F-Value | p-value |
|---|---|---|
| Group | 4.88 | 0.035 |
| OF | 1.97 | 0.171 |
| Interaction | 3.69 | 0.065 |
| Factor (1) | F-Value | p-value |
|---|---|---|
| Group | 6.31 | 0.018 |
| OF | 21.06 | < 0.000 |
| Interaction | 4.66 | 0.040 |
| Factor (2) | F-Value | p-value |
|---|---|---|
| Group | 9.91 | 0.003 |
| OF | 0.79 | 0.383 |
| Interaction | 0.18 | 0.671 |
| Factor (3) | F-Value | p-value |
|---|---|---|
| Group | 10.45 | 0.003 |
| OF | 0.311 | 0.582 |
| Interaction | 1.48 | 0.23 |
1
0
2
3
| Factor (0) | F-Value | p-value |
|---|---|---|
| Group | 4.88 | 0.130 |
| OF | 1.97 | 0.431 |
| Interaction | 3.69 | 0.190 |
| Factor (1) | F-Value | p-value |
|---|---|---|
| Group | 6.31 | 0.050 |
| OF | 21.06 | < 0.000 |
| Interaction | 4.66 | 0.10 |
| Factor (2) | F-Value | p-value |
|---|---|---|
| Group | 9.91 | 0.026 |
| OF | 0.79 | 0.373 |
| Interaction | 0.18 | 0.729 |
| Factor (3) | F-Value | p-value |
|---|---|---|
| Group | 10.45 | 0.019 |
| OF | 0.311 | 0.546 |
| Interaction | 1.48 | 0.617 |
Excluding
BD01
LC01
BH02
| Factor (full) | F-Value | p-value |
|---|---|---|
| Group | 10.54 | 0.003 |
| OF | 6.77 | 0.015 |
| Interaction | 5.15 | 0.031 |
| Factor (travel) | F-Value | p-value |
|---|---|---|
| Group | 11.99 | 0.002 |
| OF | 5.25 | 0.030 |
| Interaction | 2.23 | 0.14 |
| Factor (trial) | F-Value | p-value |
|---|---|---|
| Group | 11.56 | 0.002 |
| OF | 0.58 | 0.452 |
| Interaction | 0.84 | 0.369 |
| Factor (full) | F-Value | p-value |
|---|---|---|
| Group | 10.54 | 0.021 |
| OF | 6.77 | 0.036 |
| Interaction | 5.15 | 0.088 |
| Factor (travel) | F-Value | p-value |
|---|---|---|
| Group | 11.99 | 0.016 |
| OF | 5.25 | 0.020 |
| Interaction | 2.23 | 0.227 |
| Factor (trial) | F-Value | p-value |
|---|---|---|
| Group | 11.56 | 0.021 |
| OF | 0.58 | 0.808 |
| Interaction | 0.84 | 0.639 |
Excluding
BD01
LC01
BH02
RESULTS
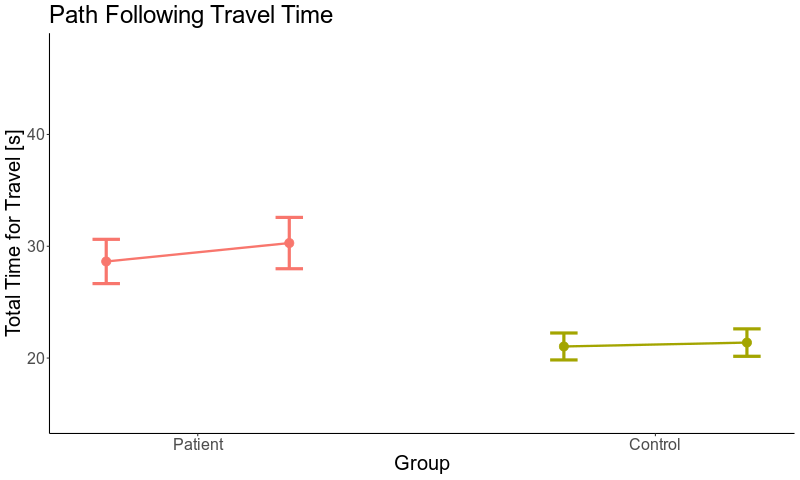
w/o OF
OF
| Factor | p |
|---|---|
| Group | < 0.01 |
| Optic Flow | 0.03 |
| Group x Optic Flow | 0.14 |
w/o OF
OF


- Control Group is faster
- Groups are slow in the environment with optic flow
| Factor | p |
|---|---|
| Group | 0.02 |
| Optic Flow | < 0.01 |
| Group x Optic Flow | 0.58 |
RESULTS
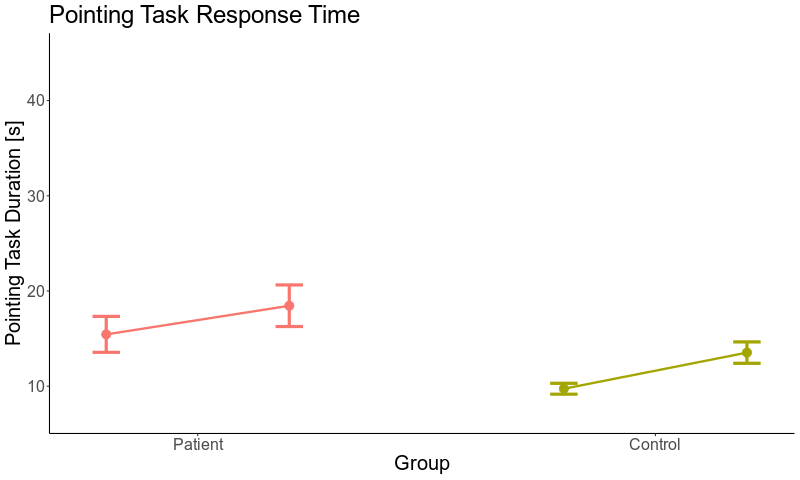
w/o OF
OF
w/o OF
OF
- Control Group is faster
- Groups are slow in the environment with optic flow
| Factor | p |
|---|---|
| Group | 0.09 |
| Optic Flow | < 0.01 |
| Group x Optic Flow | 0.10 |
RESULTS
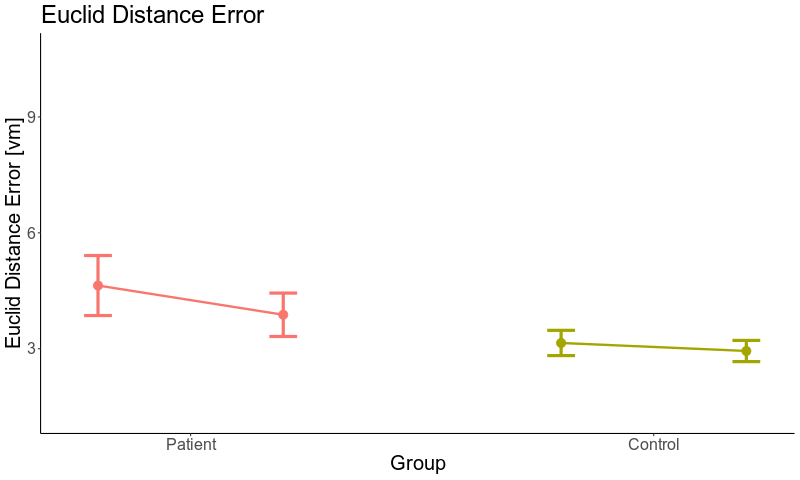
w/o OF
OF
w/o OF
OF
- No difference between groups
- Accuracy improves in the environment with optic flow
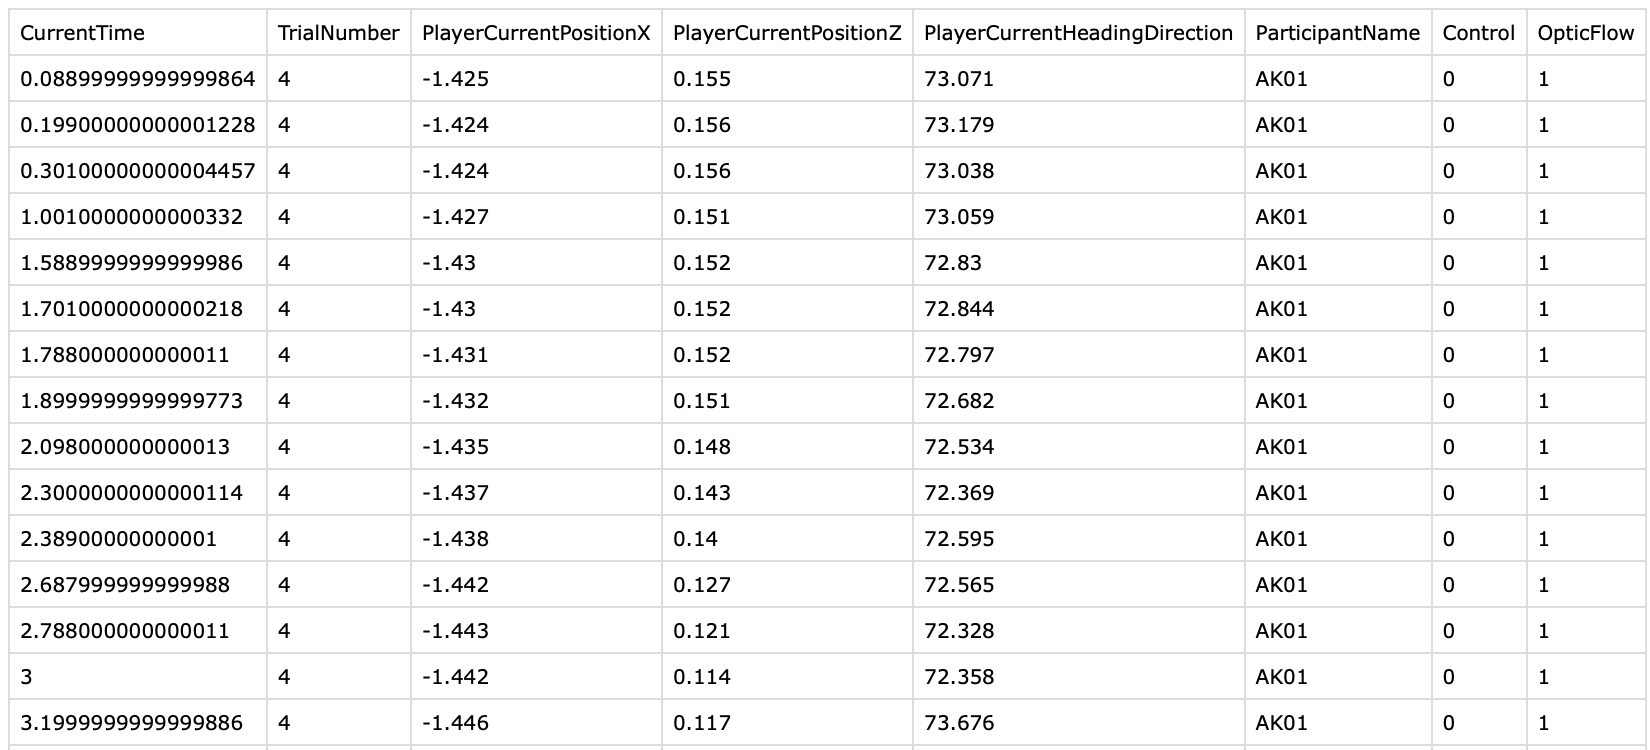
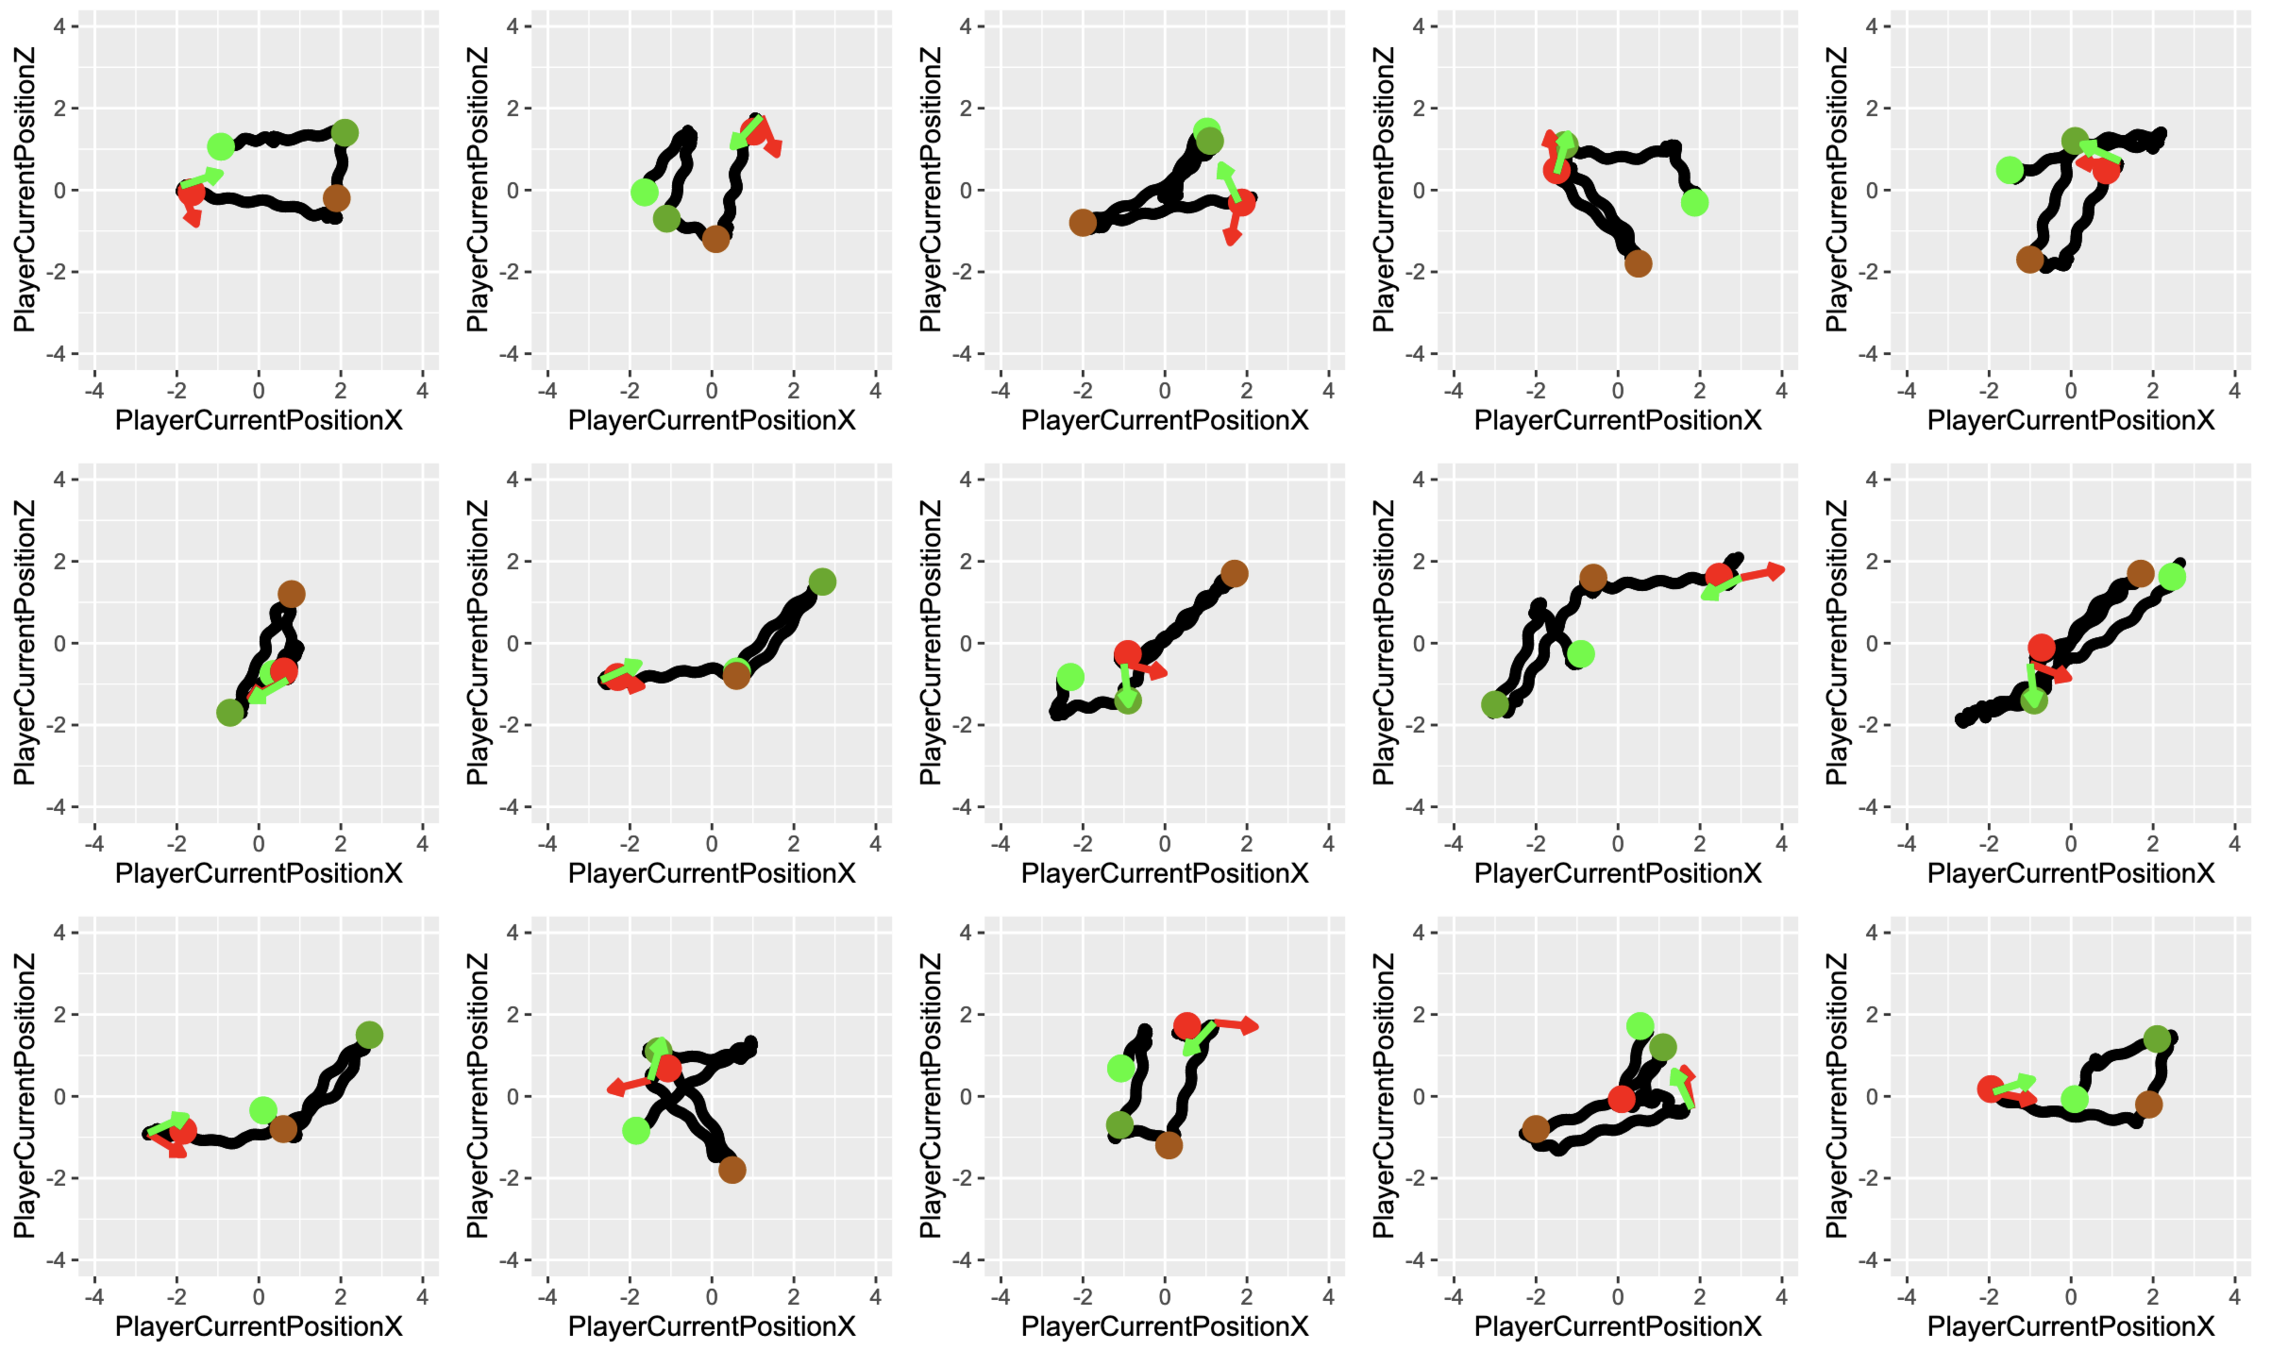
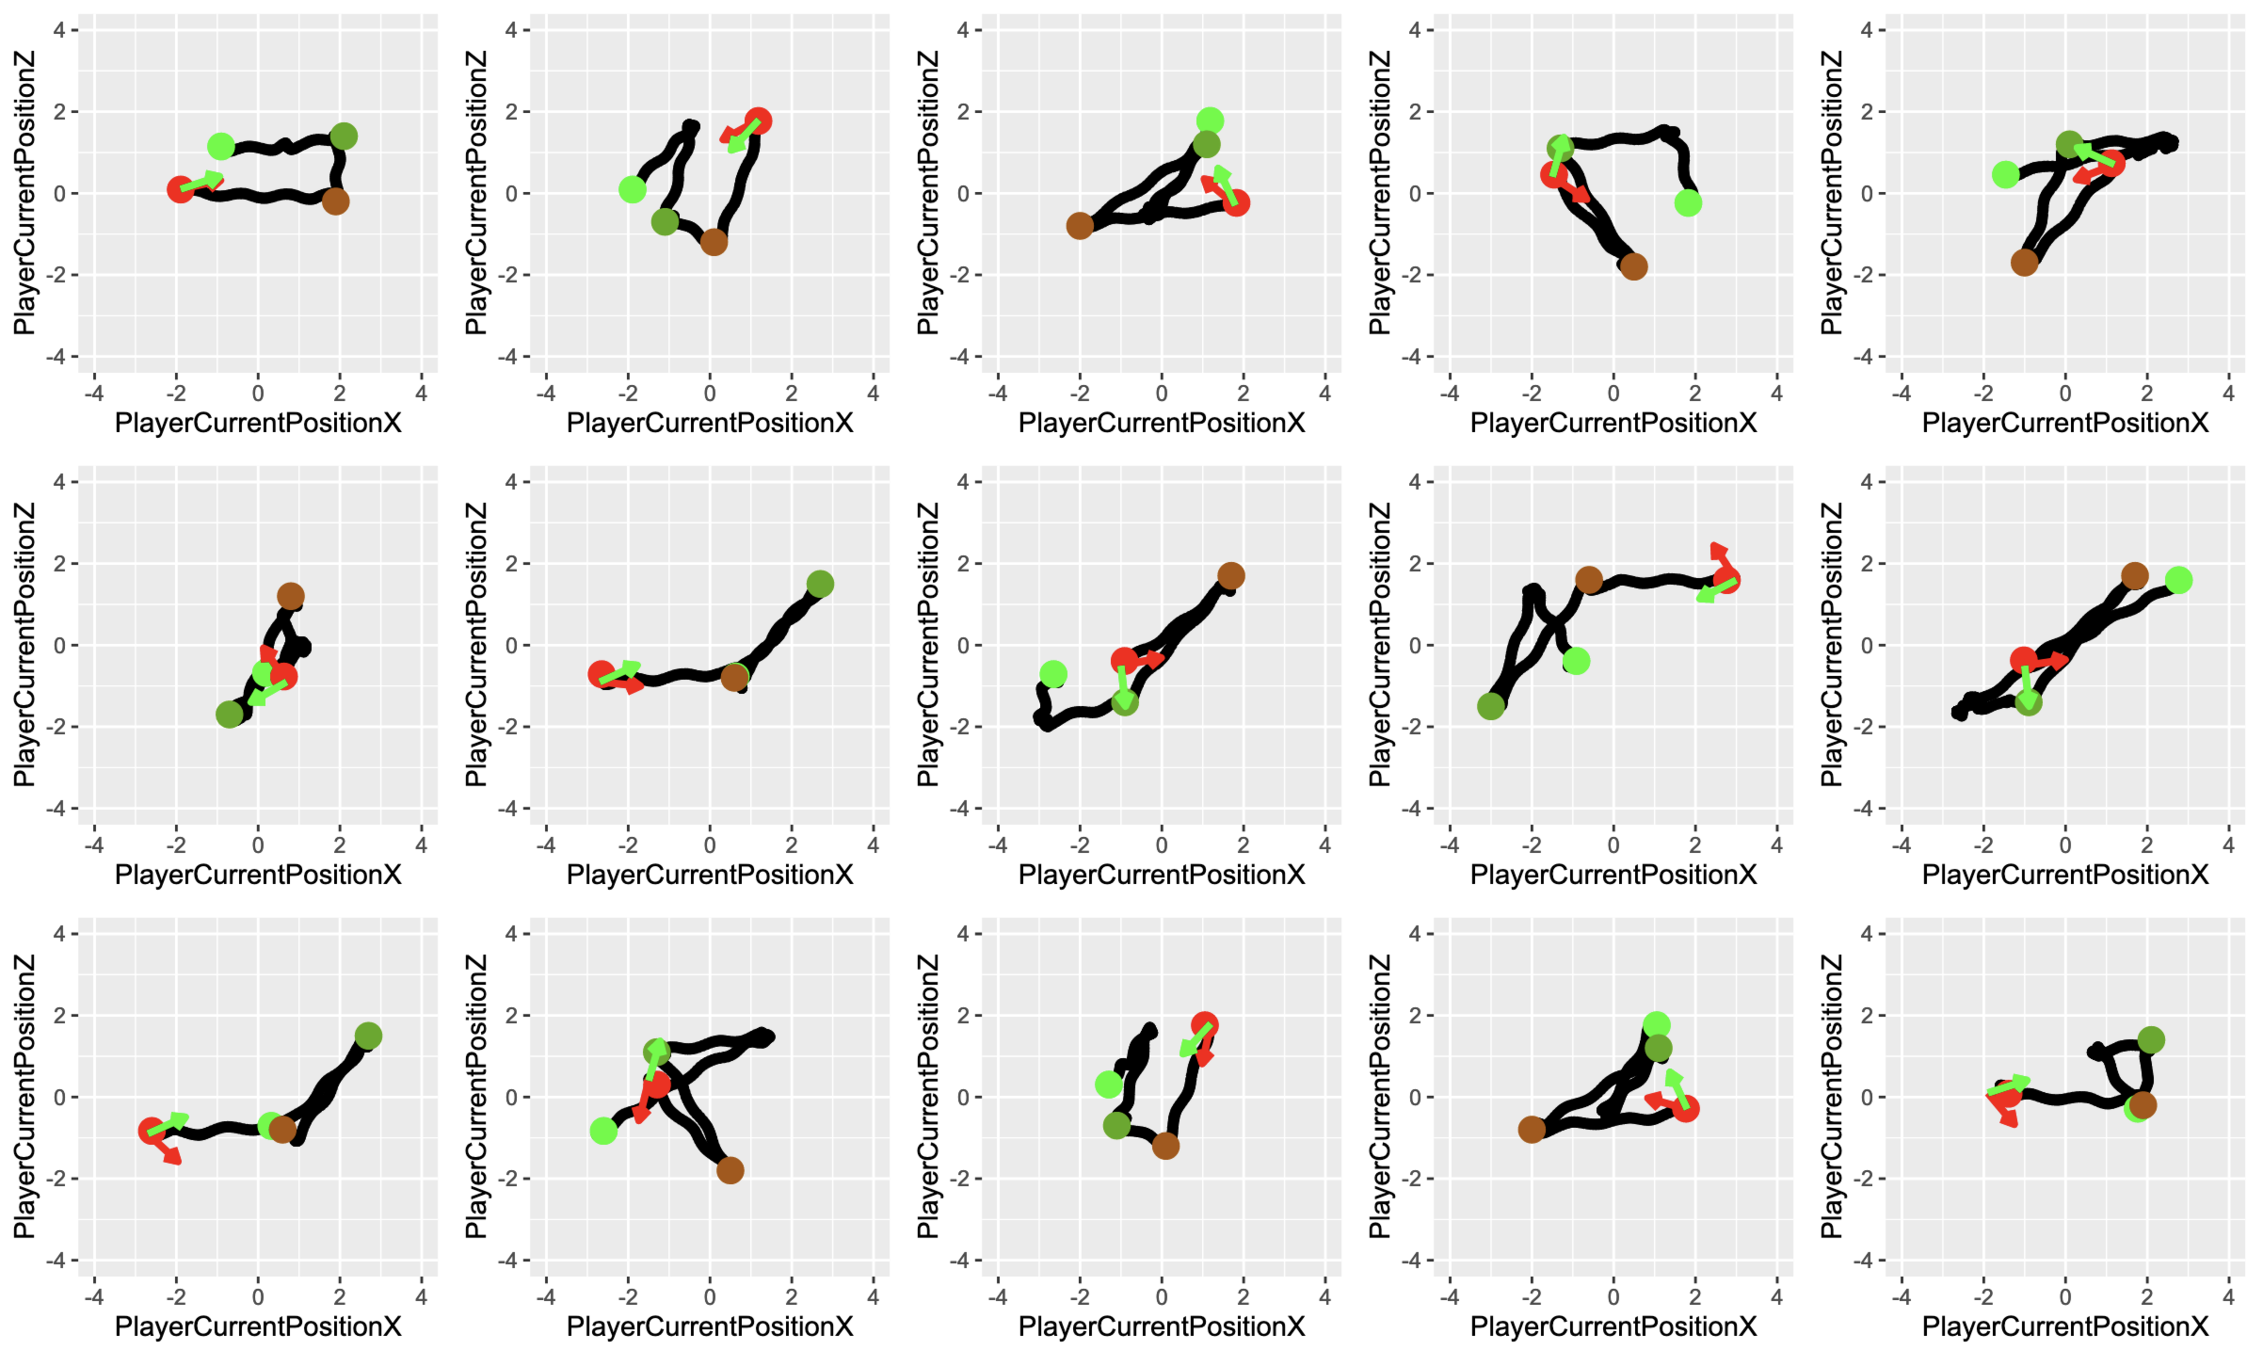
DATASET
Time Series Data
- Position of the Participant
- Heading Direction
- Time
- Group
- Optic Flow
DATASET
Glaucoma
Control
DATASET
Model Concerns
- Time to complete one trajectory is different across participants.
- Trajectory is similar but the way participants walk is different.
- Different trajectories
- Each trajectory consists of 4 trials for each participant
- Classification of participants using navigation data
PRELIMINARY RESULTS
200 data points sampled from each trials
1392 trials in total (29 participants * 48 trials)
Model : ResNet 18
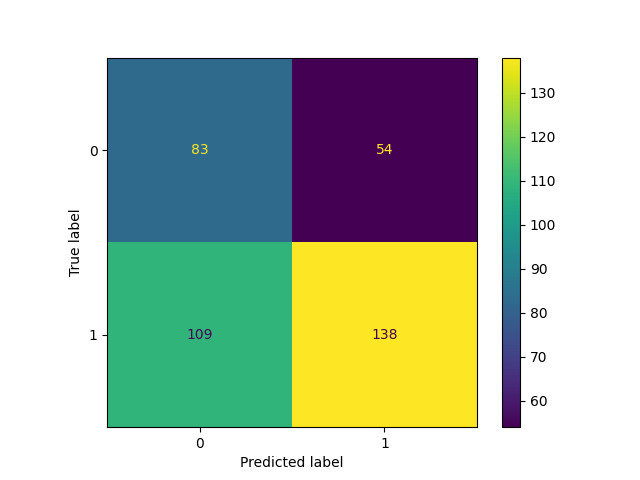
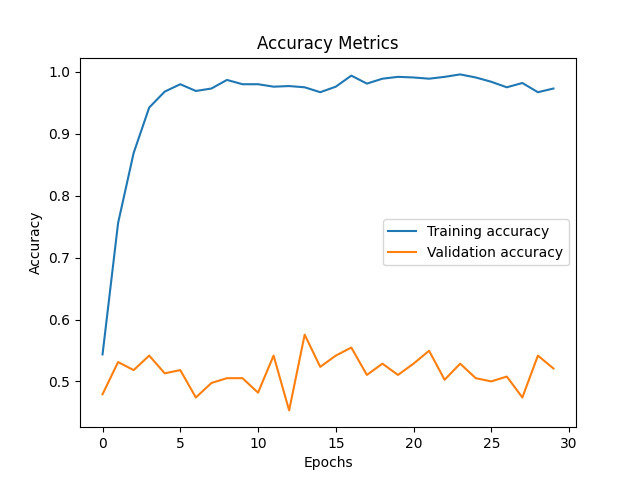
Predictors : Location X, Location Y and Heading Direction
Analysis Playground
By Safa Andac


