Azure Monitor
-
What is Azure Monitor?
-
What data does Azure Monitor collect?
-
Types of Data Collected By Azure Monitor?
-
Log Analytics?
-
Log Analytics sample queries Demo?
-
Application Insight?
-
What does Application Insights monitor?
-
Questation and Answers About Azure Monitor?
Agenda
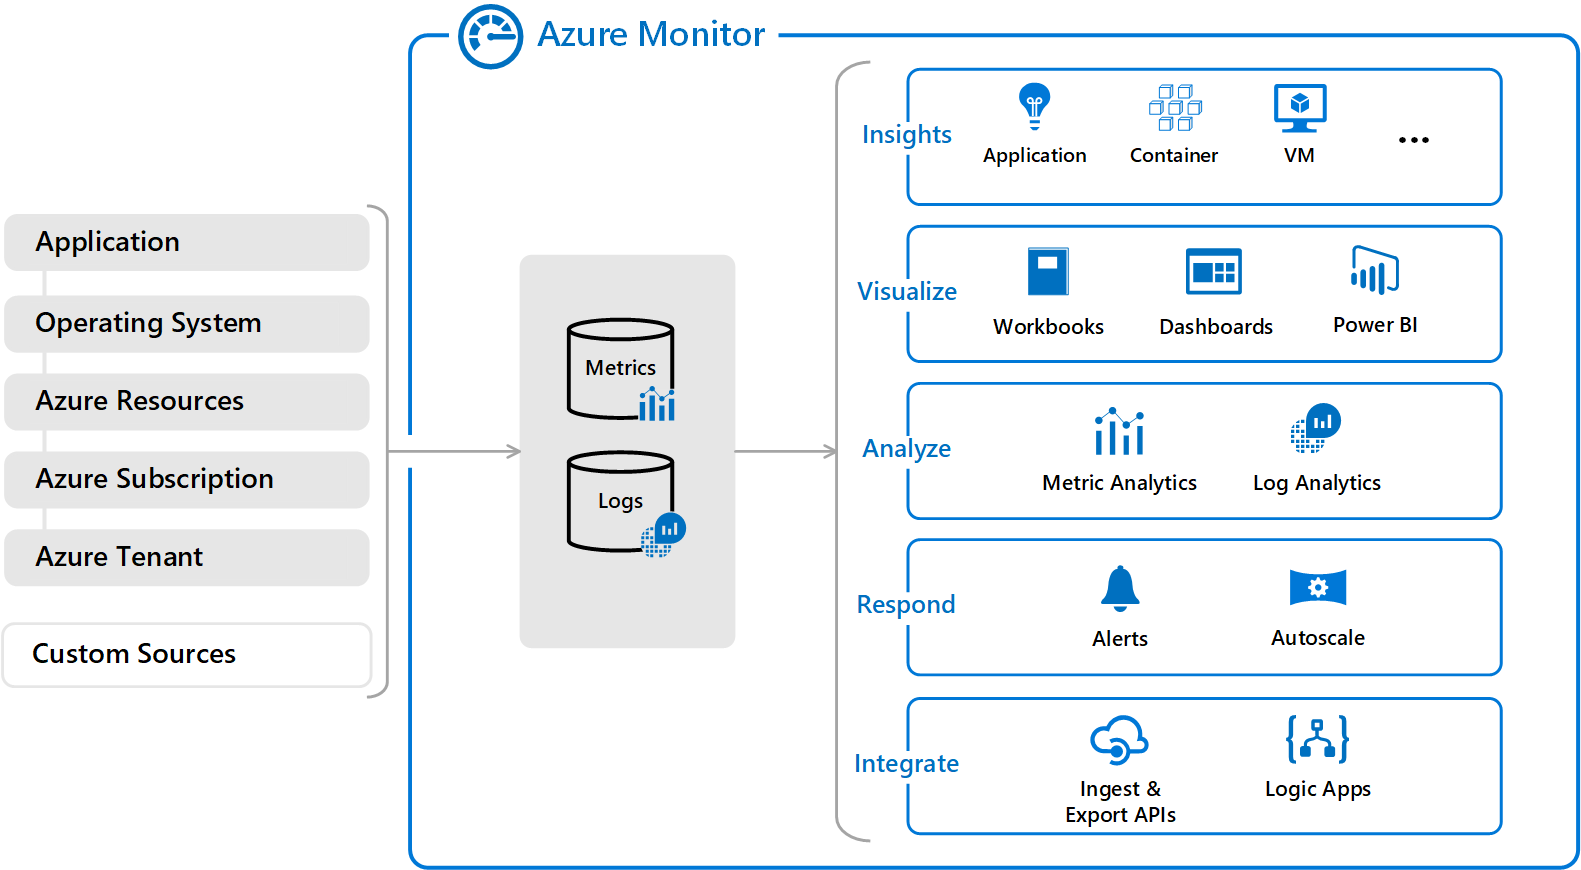
Azure Monitor is a service in Azure that provides performance and availability monitoring for applications and services in Azure, other cloud environments, or on-premises.
Azure Monitor collects data from multiple sources into a common data platform where it can be analyzed for trends and anomalies.
-
Application monitoring data: Data about the performance and functionality of the code you have written, regardless of its platform.
-
Guest OS monitoring data: Data about the operating system on which your application is running. This could be running in Azure, another cloud, or on-premises.
-
Azure resource monitoring data: Data about the operation of an Azure resource.
-
Azure subscription monitoring data: Data about the operation and management of an Azure subscription, as well as data about the health and operation of Azure itself.
-
Azure tenant monitoring data: Data about the operation of tenant-level Azure services, such as Azure Active Directory.
What data does Azure Monitor collect?
Types of Data Collected By Azure Monitor
Metrics are numerical values that describe some aspect of a system at a particular point in time. They are lightweight and capable of supporting near real-time scenarios.

Logs contain different kinds of data organized into records with different sets of properties for each type. Telemetry such as events and traces are stored as logs in addition to performance data so that it can all be combined for analysis.
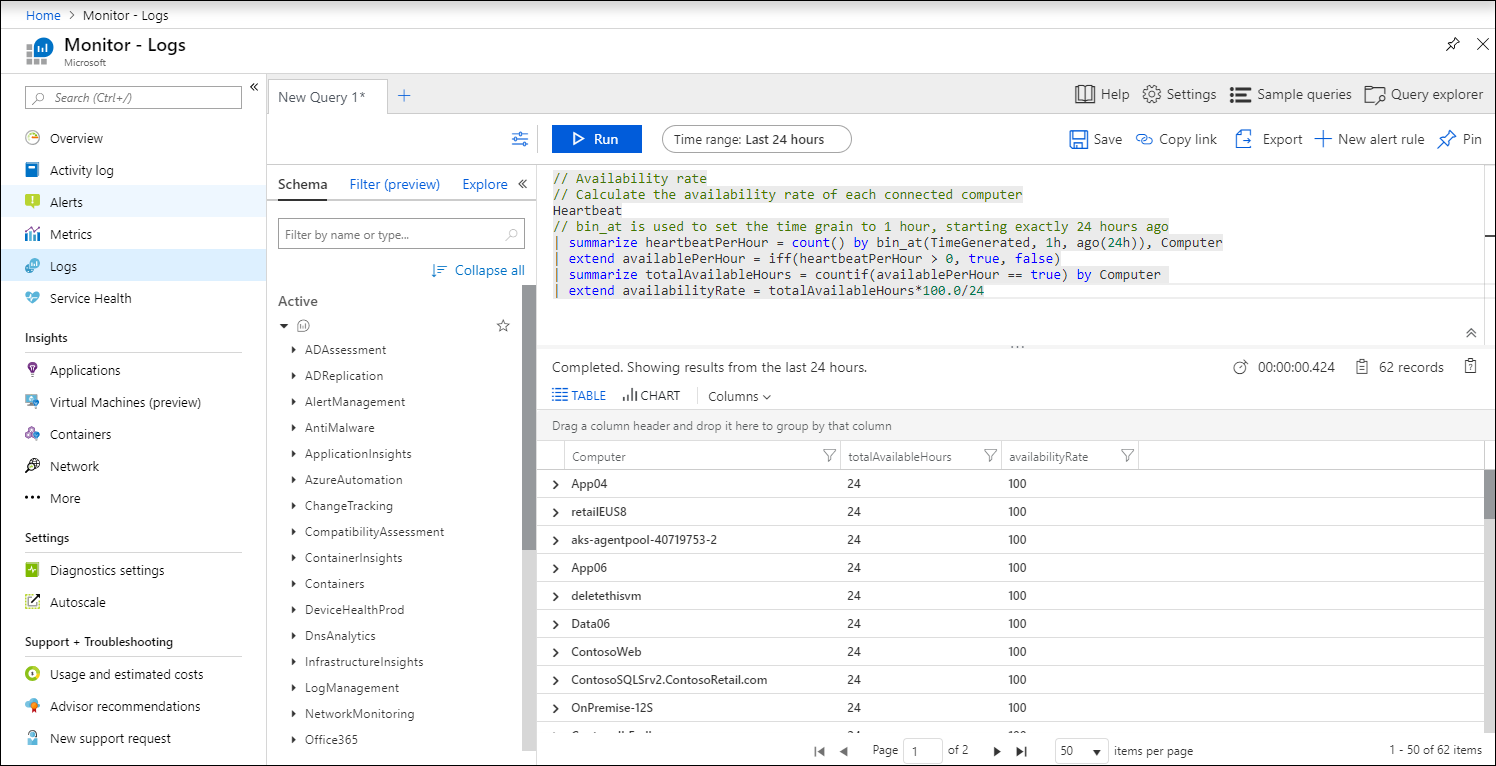
All log data collected by Azure Monitor is stored in a Log Analytics workspace.

A workspace is essentially a container where log data is collected from a variety of sources.

You may have a single Log Analytics workspace for all your monitoring data or may have requirements for multiple workspaces.

All data is retrieved from a Log Analytics workspace using a log query written using Kusto Query Language (KQL)
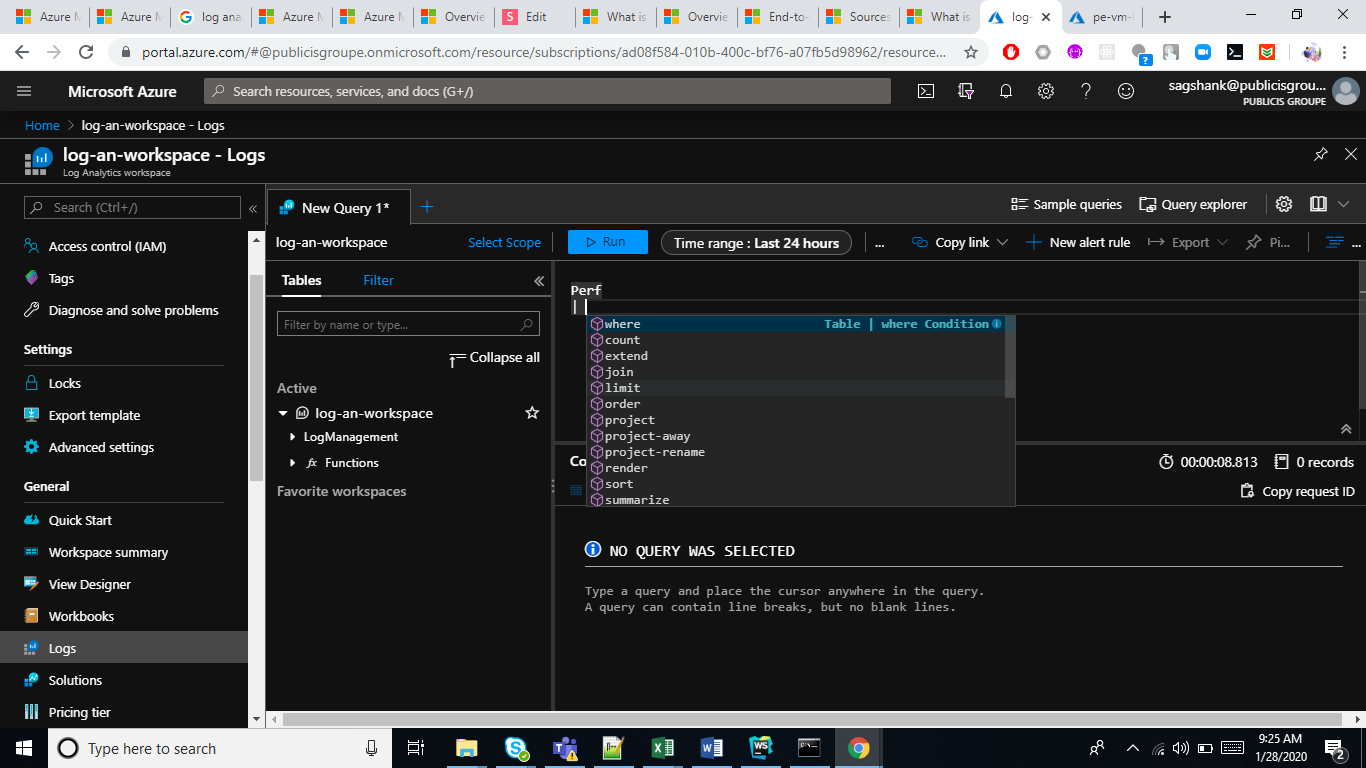
Log Analytics sample queries Demo
Heartbeat
| where TimeGenerated >= startofweek(ago(21d))
| summarize dcount(Computer) by endofweek(TimeGenerated) | render barchart kind=default
Query to Charts the number of distinct computers that sent heartbeats, each week
Heartbeat
| summarize arg_max(TimeGenerated, *) by ComputerIP
Query to Get the latest heartbeat record per computer IP
Query to Calculate server availability rate based on heartbeat records.
let start_time=startofday(datetime("2018-03-01"));
let end_time=now();
Heartbeat
| where TimeGenerated > start_time and TimeGenerated < end_time
| summarize heartbeat_per_hour=count() by bin_at(TimeGenerated, 1h, start_time), Computer
| extend available_per_hour=iff(heartbeat_per_hour>0, true, false)
| summarize total_available_hours=countif(available_per_hour==true) by Computer
| extend total_number_of_buckets=round((end_time-start_time)/1h)+1
| extend availability_rate=total_available_hours*100/total_number_of_buckets
union withsource=sourceTable *
| where TimeGenerated > ago(5h)
| summarize count() by bin(TimeGenerated,10m), sourceTable
| render timechart
Query to Chart the record-count per table
Query to Count all logs collected over the last hour by type
search *
| where TimeGenerated > ago(1h)
| summarize CountOfRecords = count() by Type
| render barchartApplication Insight
Application Insights is an application performance management (APM) service for web applications that enables you to do all the monitoring of your website performance in Azure.

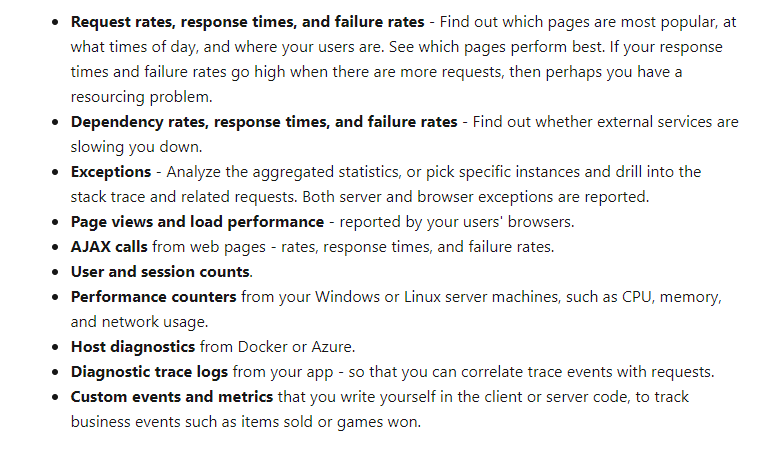
What does Application Insights monitor?
QA session about Azure Monitor
Azure Monitor
By Sagar Mal Shankhala


