D3
Transition
d3.select('body')
  .transition()
  .style('background-color', 'red')
Transition
Start
End
White
Red
Initial DOM state
Specified attribute
Transition
d3.select('body')
  .style('background-color', 'green')
  .transition()
  .style('background-color', 'red')
Transition
Start
End
Green
Red
Set Initial State
Specified attribute
Transition
Start
End
Green
Red
Set Initial State
Specified attribute
Transition
Start
End
~Tween~
0
1
}
Intervals
Transition
d3.select("body").transition()
  .styleTween("background-color", function() {
    return d3.interpolateRgb("green", "red");
  });
Transition
d3.select("body").transition()
  .styleTween("background-color", function() {
    return function(t) {
      return "hsl(" + t * 300 + ",100%,50%)"
    }
  });
Transition Life Cycle
Start
End
Schedule
Run
selection()
.transition()
selection()
.transition()
.style()
selection()
.delay()
selection()
.styleTween()
selection()
.styleTween('color',  function() {
  return function(t){
    //t
  }
 })
selection()
.duration()
selection()
.easeLinear()
Transitions Exercise
bit.ly/d3AnimateBars
Scale
Scale
If visualization is constructing “visual representations of abstract data to amplify cognition ”, then perhaps the most important concept in D3 is the scale, which maps a dimension of abstract data to a visual variable.
-- Mike Bostock, Creator of D3
Scale
Scale
Scale: Domain v Range
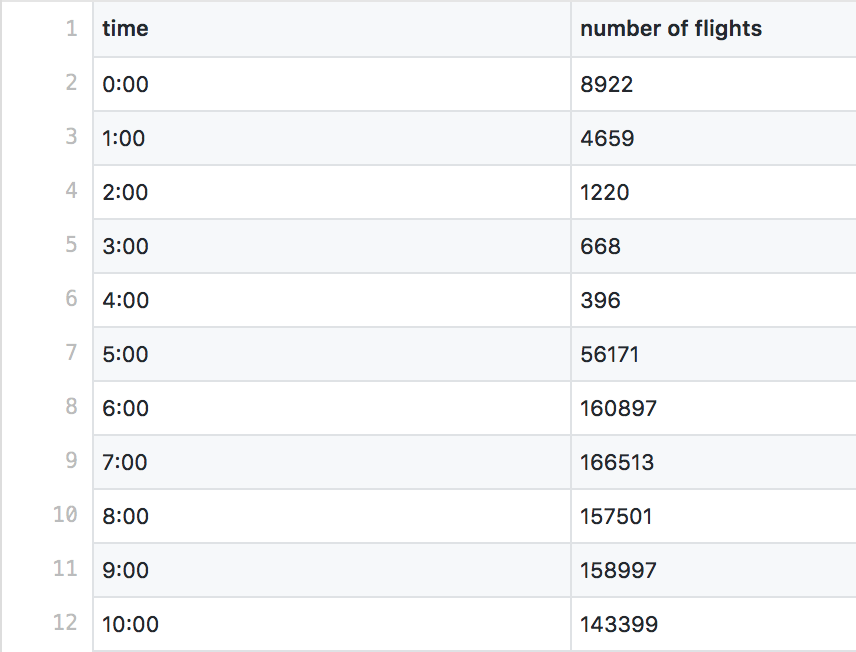
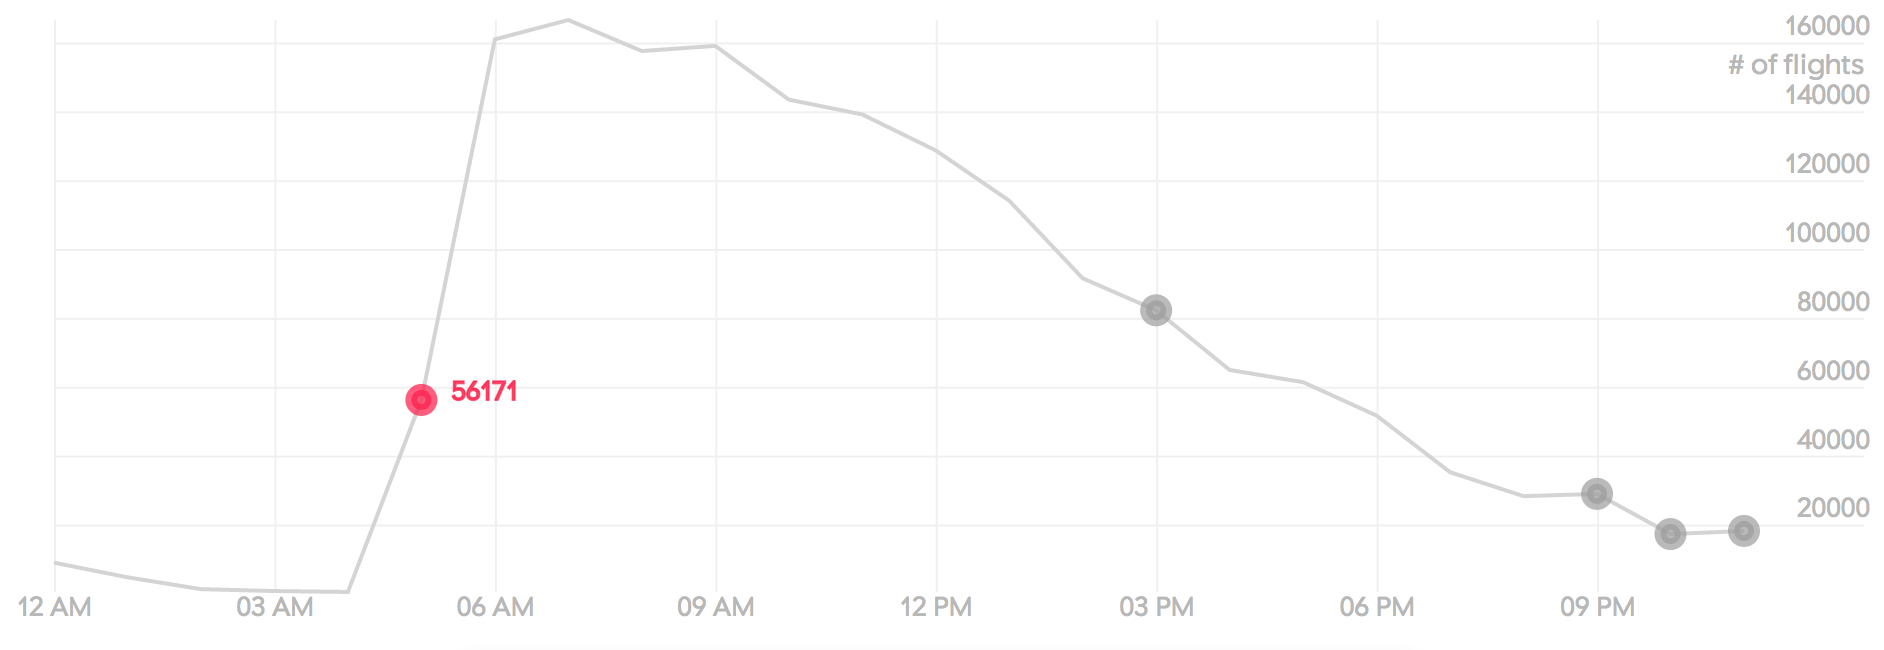
396
166513
10
300
Input Domain
Output Range
Scale: Normalization
396
166513
0
1
56171
~0.338
Scale: Calculations
(166513 - 396)
56171
________________
(Max - Min)
Datapoint
________________
x
available space
(height/width)
300
x
D3 Scale
var scale = d3.scaleLinear()
              .domain([396, 166513])
              .range([10, 300])
scale(396) // 10
scale(56171) // 107.36962502332692
scale(166513) // 300Hands on time!
bit.ly/d3ScalesStarter
Hands on time!
bit.ly/d3ScalesFin
Axes
Axes
d3.axisTop(scale)
d3.axisBottom(scale)
d3.axisLeft(scale)
d3.axisRight(scale)
Axes
svg.append('g')
   .call(xAxis)
Formatting Tick Labels
svg.axisLeft(scale)
   .tickFormat(d3.format(".1%"))
svg.axisLeft(scale)
.tickFormat(d3.timeFormat("%H:%M"))Formatting # Ticks
svg.axisLeft(scale)
   .ticks(5)
Hands On Time!
bit.ly/d3ScalesAxes
D3 Continued
By shortdiv


