Business Analytics for Startups
Analyzing data and using the information to make business decisions can be an invaluable tool for your company. The techniques outlined can help any small business or startup and doesn't require indepth quantitative skills.
Correlation
Having a visual of your data will help with this concept. When you plot the graphs for a set of metrics, you can see the relationship between the data sets more easily. For more analytical results, use the coefficient of correlation to measure the relationships.
Cause and Effect
Using the least squares regression analysis, you can understand the quantitative relationship between two sets of data. This metric is especially useful for planning future activity, and for looking deeper into data sets.
Forecasting and Planning
Startups and small business may not have the budget or capacity to formally prepare a plan of action. However, using the data and simple analysis, one can develop a simple plan that can be the used as a helpful reference or knowledge base for decision makers.
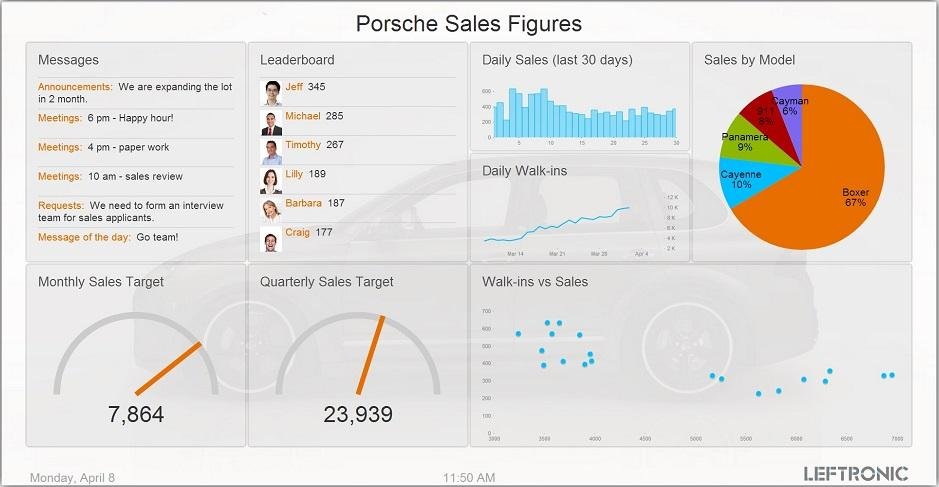
Try analytics dashboards for you business. Leftronic, Inc. is an innovative web-based real time dashboard and data visualization platform developed to monitor a company's most important metrics in a simple and elegant manner.
Business Analytics for Startups
By shows
Business Analytics for Startups
Using real time analytics can help you make better decisions for your business. These simple techniques can all be mastered by those without in-depth technical skills.


