Ames Housing Data Insights
Jake Okinow, Dan Toledano and Simon Yates
June 2020

House Price Data Provides Insights to Multiple Groups
For a potential purchaser or realtor
Given a list of requirements, what should I expect to pay?
What neighborhoods give me the best value for my criteria?
How much could I save if I relaxed some of my requirements?
For a homeowner
What changes can I make to my home to maximally increase its value?
For the Ames department of Finance
What model best predicts house sale prices, to be used as a basis for property tax?
Is that model one which I could explain if my assessment was challenged in court?
The Dataset and Our Analysis
The Dataset
- 1,460 observations of 78 features, including sale price
- Taken from home sales in Ames, Iowa between 2006 and 2010
Our Analysis
- First, we pre-processed the data to remove missing values and encoded categorical variables
- Second, we conducted exploratory data analysis to understand the dataset
- As a result of this stage we opted to focus on log(Sale Price) and exclude houses > 4,000 sq ft
- Then, we trained and analysed the following models for predicting log(sale price) from the other variables:
Forward stepwise multilinear regression
Lasso and Ridge penalized linear regressions
Tree-based models: Random Forests and Gradient Boosting (including an experimental XGBoost implementation)
A Support Vector Machine Regression
- This presentation focuses on the business insights. Full technical details are provided in an appendix
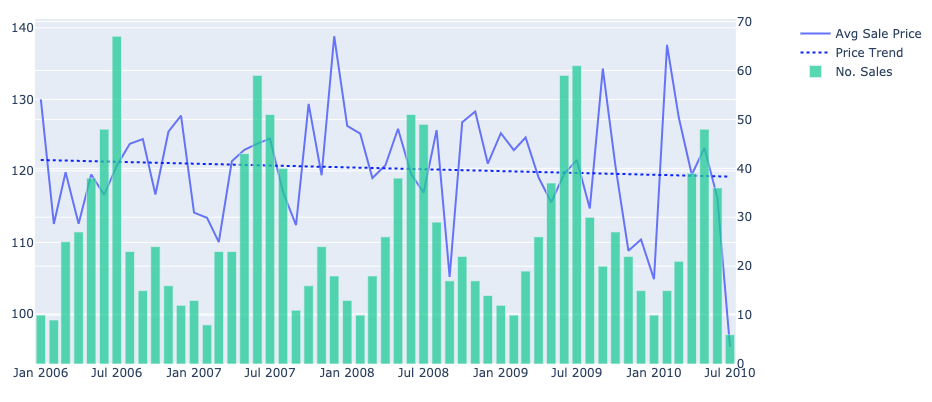
Exploratory Data Analysis: Stationarity
Despite the financial crisis of 2008 occurring in the midst of the period covered by the data, house price per square foot remained remarkably constant
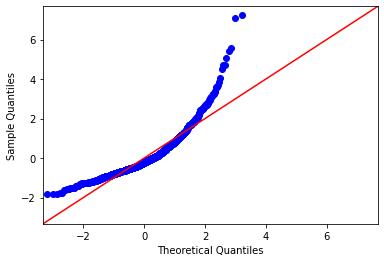
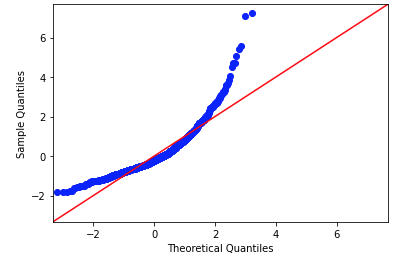
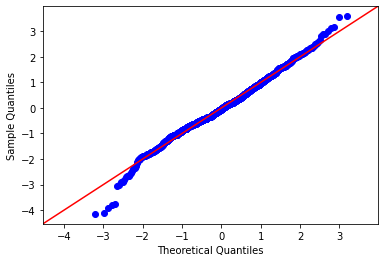
Exploratory Data Analysis: Normality
A Q-Q plot revealed that the Sale Price data was not normally distributed. However, log(Sale Price) was much closer.
Forward Stepwise Linear Regression
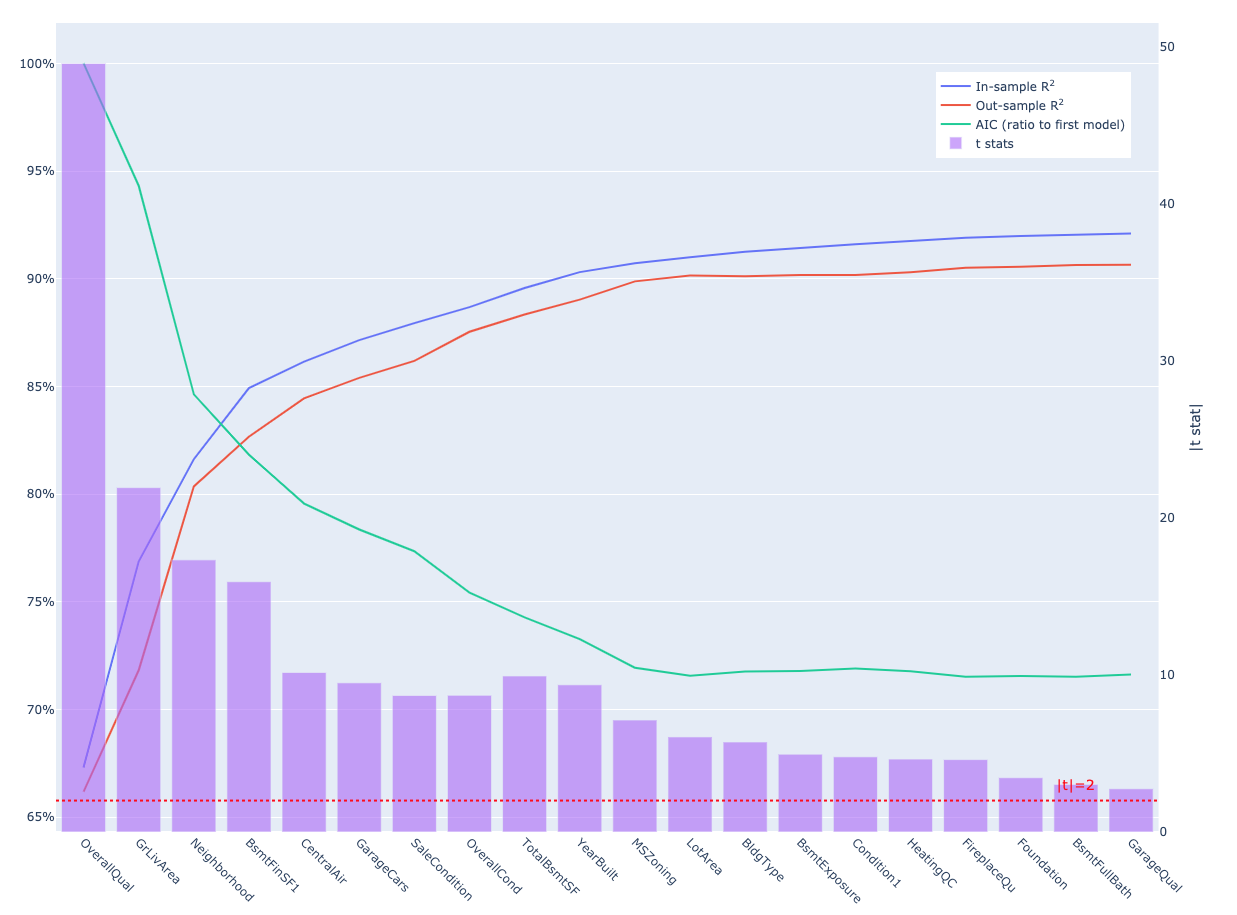
AIC suggests limited value beyond variable number 12
OOS Model Scores Summary
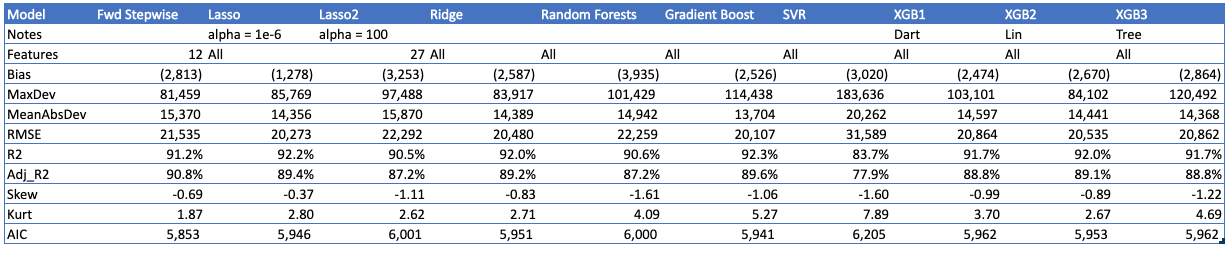
- Out-of-sample R2 scores were very high. This dataset is almost too good!
- Automated parameter searches recommended very complex models (~76 features)
- This risks overfit (although it is not evident here), and reduces interpretability
- We included a 'manual override' of Lasso to force a more parsimonious model
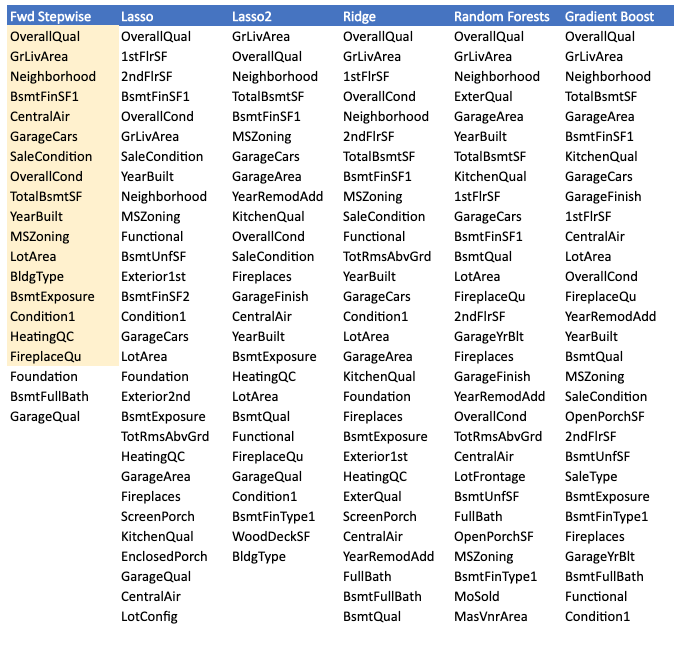
Model Feature Selection
- There was widespread agreement among models on the most important features
- 16 features appeared in all of the models run
Results Analysis
- Measured by AIC or adjusted R2, the 12-feature forward-stepwise linear model performed the best
- The highest unadjusted R2 came from Gradient Boosting, followed by the very low alpha Lasso
- The linear models benefit from interpretability: Coefficients show the marginal value of a feature
- The lowest performing model was the Support Vector Machine
- This was also one of the more computationally intensive models, with complex interpretability
- Overall, linear models offered the best balance of accuracy and interpretability
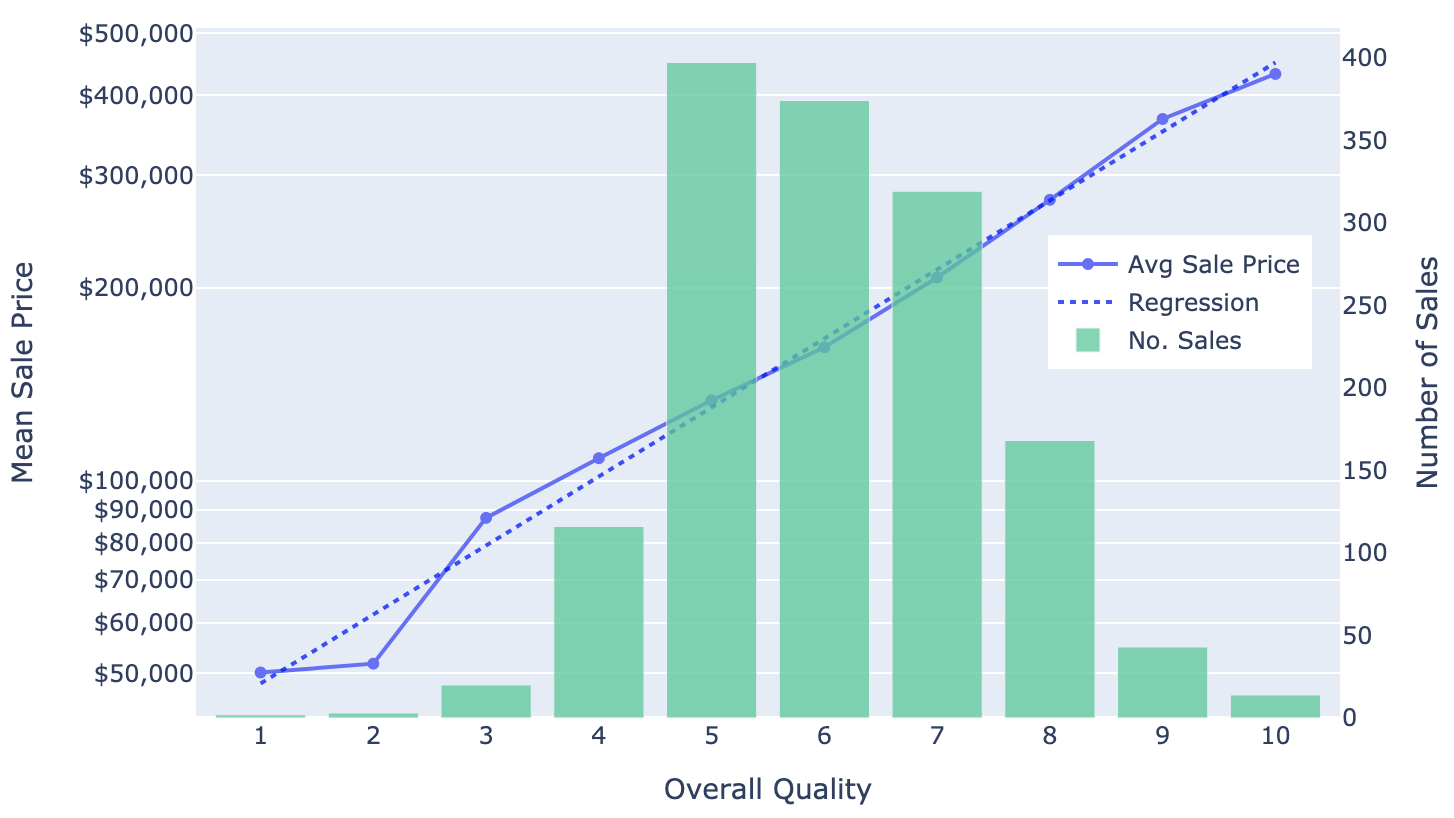
Owner Action Step 1: Improve Quality Score
- The feature 'Overall Quality' (a 10-point scale) dominates the prediction with a univariate R2 of 68%
- The MV regression coefficient implies that a 1-point change in score correlates to a 28% increase in sale price
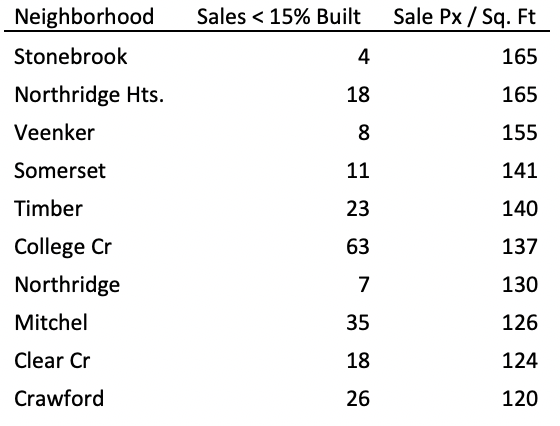
Buyer Action 1: Is Neighborhood Worth It?
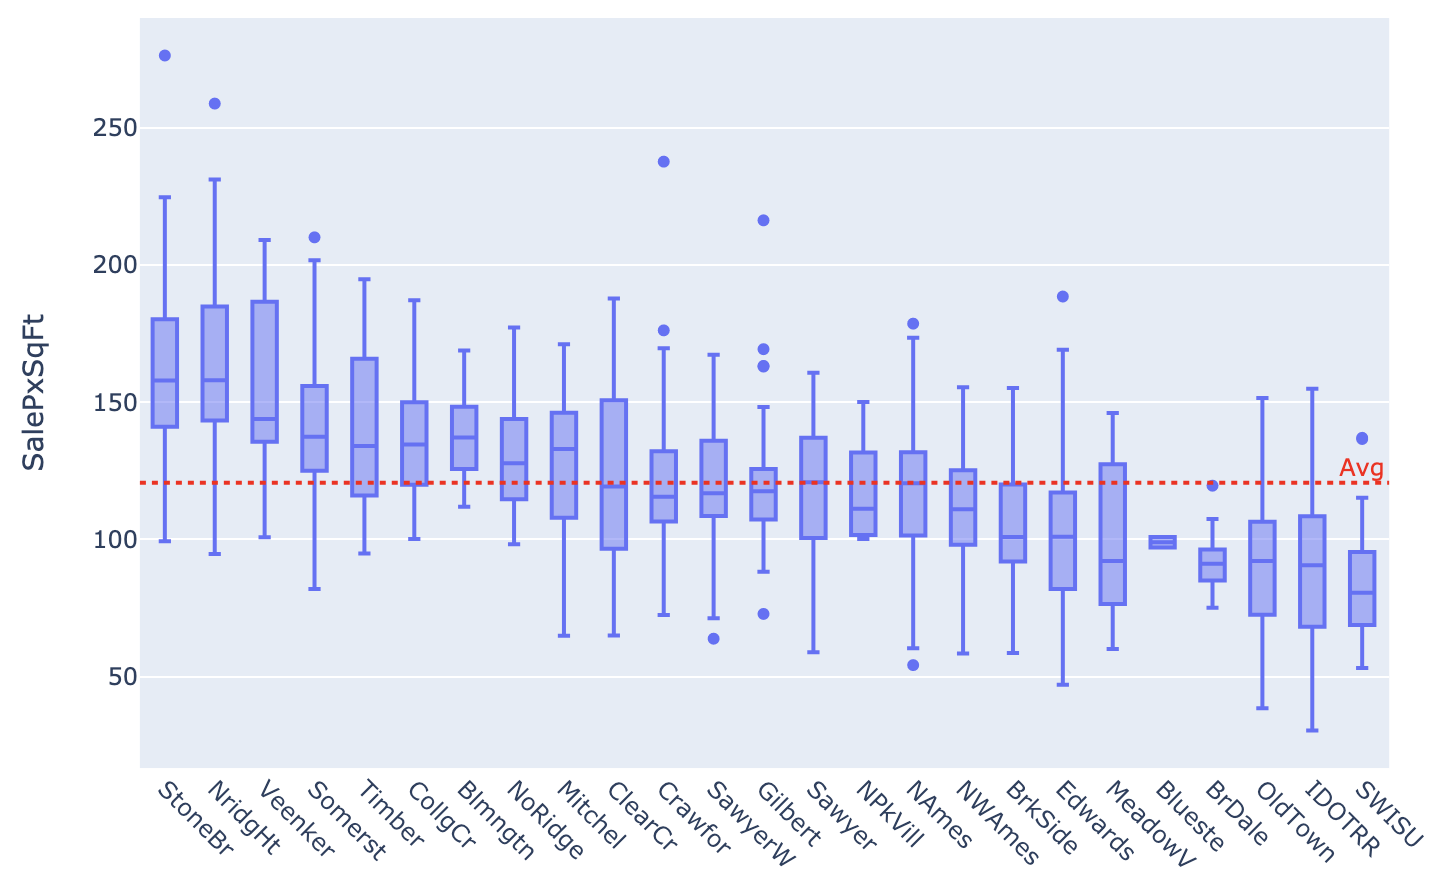
Buyer Action 2: Find Large Lots
Above Grade Square Footage
- The next most important driver of price is square footage above ground level
- Houses that are small compared to their lot size may be profitable to extend
- Time since last remodel date also features as a driver of sale price
Average cost of construction in Iowa:
$103 / sq ft
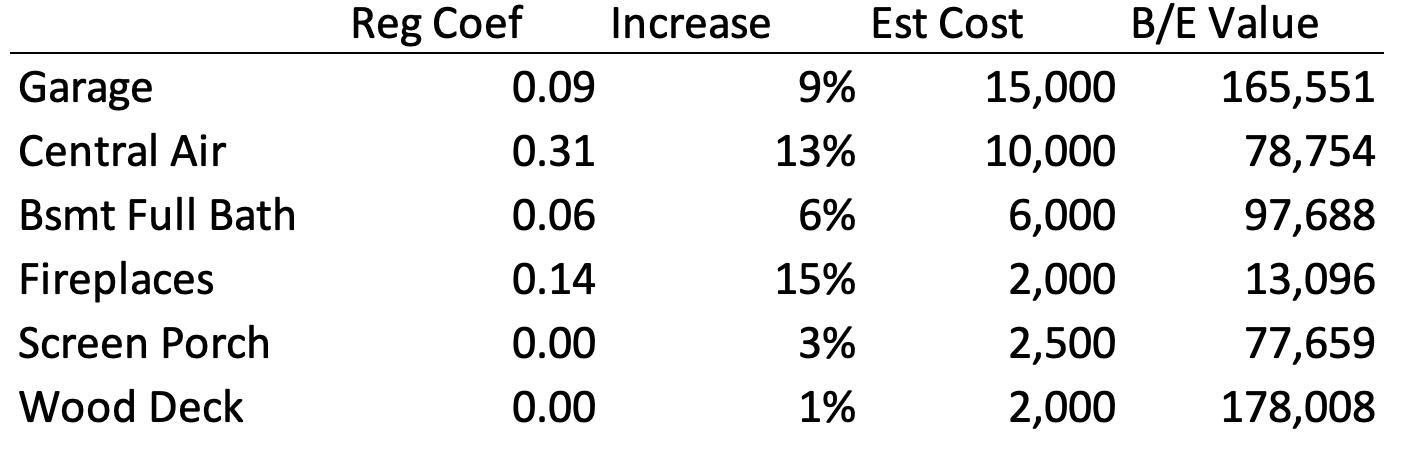
Owner Action Steps 2 - 7
- Multivariate regression coefficients predict the value add from the following actions:
- Increase garage capacity
- Install central a/c
- Finish the basement and add a full bathroom
- Fireplaces are a no-brainer
- Consider a screen porch and/or wood deck
Challenges and Ideas for Future Work
- One challenge was that the dataset contained only 1,460 observations
- This is not particularly high given the richness of the 79 features
- Additional observations covering a longer time period would increase confidence in lower-ranked features
- We experimented with the XGBoost model, but need to delve much more deeply into it to be confident
- It would be interesting to consider other cities to see if the Ames data generalizes nationally
Summary Conclusions
The dataset and models applied were able to provide solid insights for multiple groups
For a potential purchaser or realtor
- Regression coefficients indicate how expensive a particular criteria will be
- Which neighborhoods offer the best development opportunities
For a homeowner
- 7 action items to increase home value
For the Ames department of Finance
- A simple linear model with 12 inputs that could form the basis for an accurate property tax investment
- A model with high interpretability which will be feasible to defend if challenged
- A variety of modelling approaches validating the conclusions reached by the first
Questions?
Ames Housing Data
By simondyates