From structure to function: leveraging embedded multimodal imaging to explore brain connectivity

| smoia | |
| @SteMoia | |
| s.moia.research@gmail.com |
AIRMM 2025, Lecco, 26.03.2025
Stefano Moia, 2024

Faculty of Psychology and Neuroscience, Maastricht University, Maastricht, The Netherlands; Open Science Special Interest Group (OHBM); physiopy (https://github.com/physiopy)
I have nothing to disclose.
This is a new chapter
This is a new chapter
Take home #0
This is a take home message
Connectivity across modalities
BOLD signal: "Functional Networks"
Biswal et al., 1995 (Magn. Reson. Med.)
r(X, Y) = \frac{\text{cov}(X, Y)}{\sigma_X \sigma_Y}
Pearson correlation:
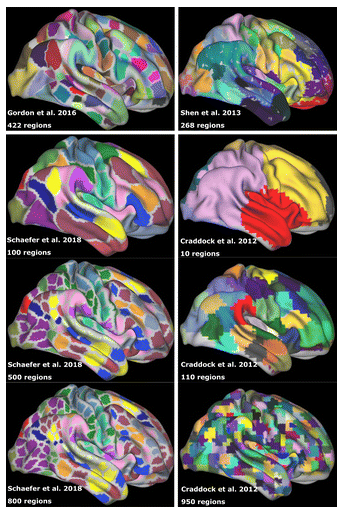
Whole brain functional connectivity
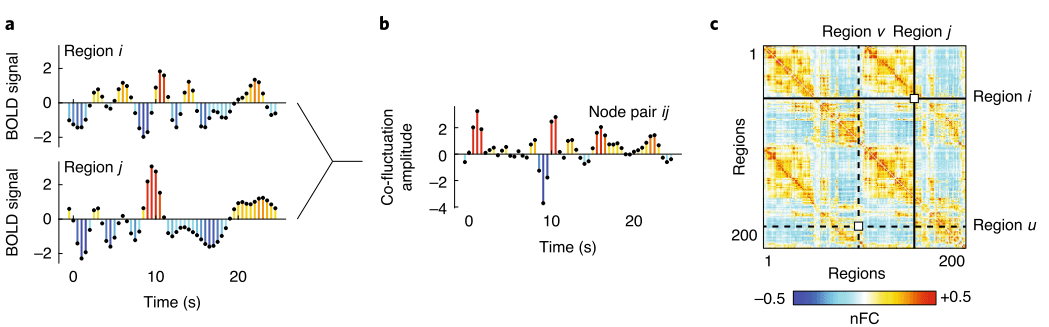
r(X, Y) = \frac{\text{cov}(X, Y)}{\sigma_X \sigma_Y}
Images adapted from Moghimi et al., 2022 (J. Neurophysiol.) and Faskowitz et al., 2020 (Nat. Neurosci.)
Whole brain structural connectivity
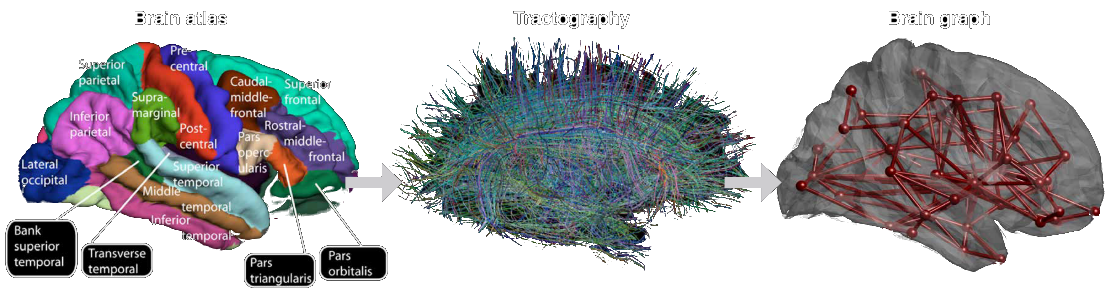
Huang et al., 2018 (Proc. IEEE)
(i)EEG connectivity
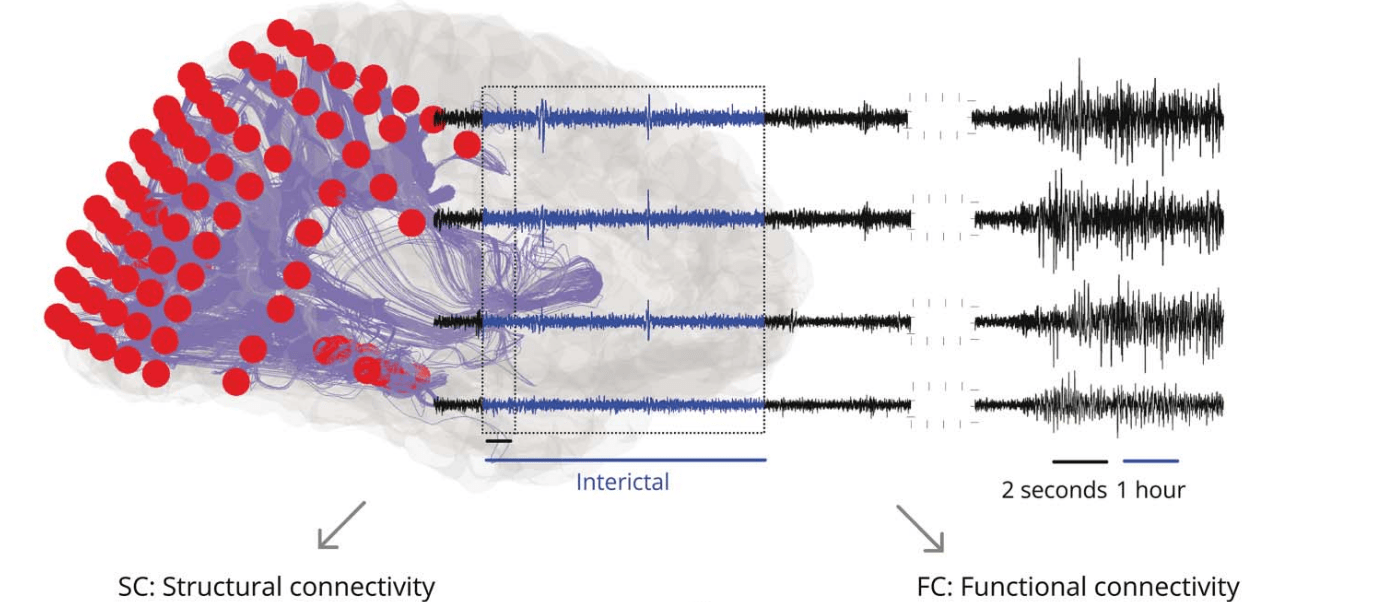
Images adapted from Sinha et al., 2023 (Neurol.)
(i)EEG connectivity
Images adapted from Sinha et al., 2023 (Neurol.)
Comparing Structural and Functional Connectivity
Baum et al., 2020 (Proc. Natl. Acad. Sci.)
Easy-peasy Structure-Function Coupling (SFC)
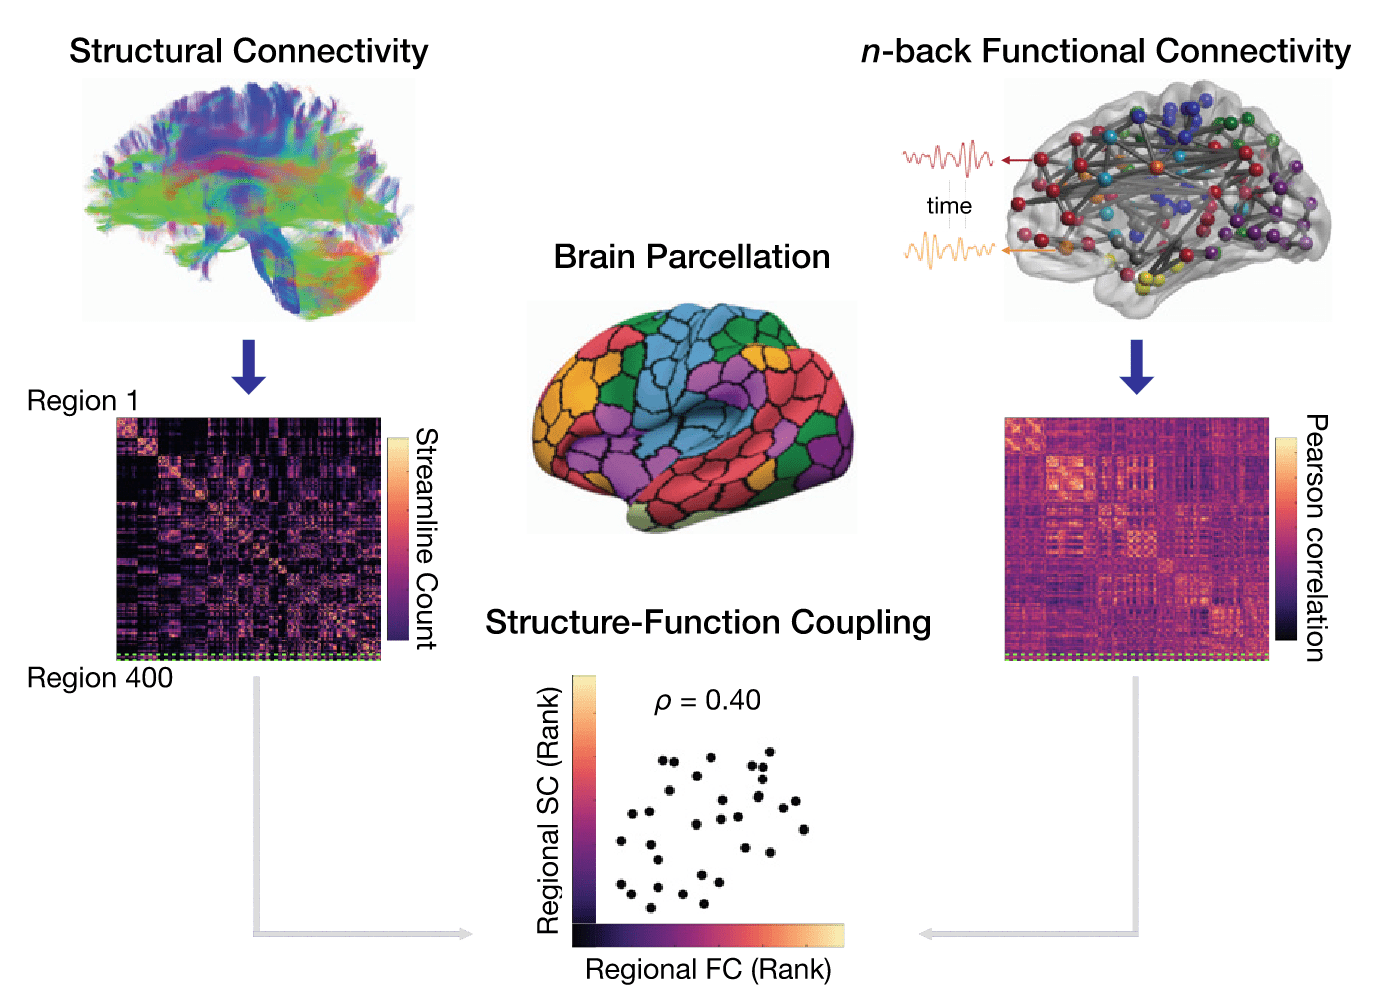
Baum et al., 2020 (Proc. Natl. Acad. Sci.)
SFC over the life span
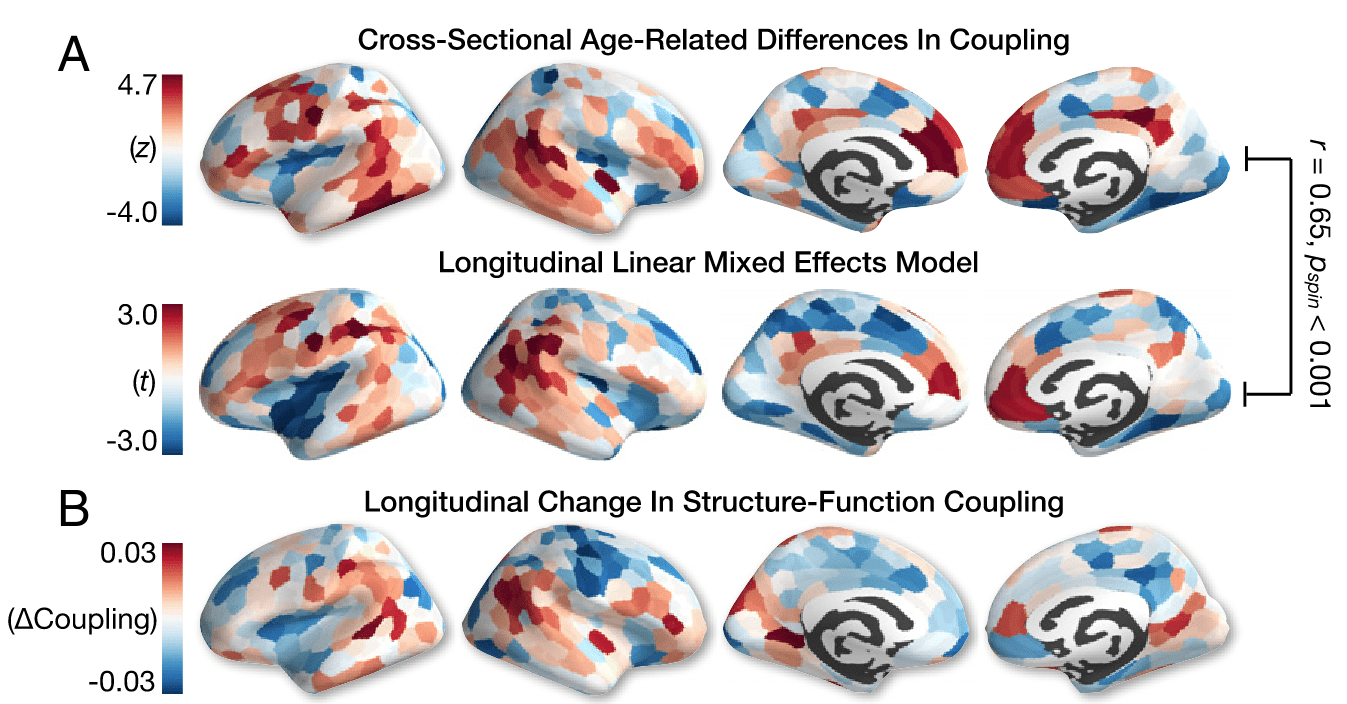
727 participants (420 F), 8 to 23 y.o., BOLD FC & dMRI
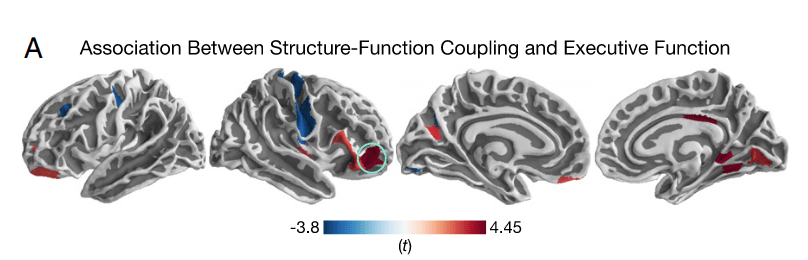
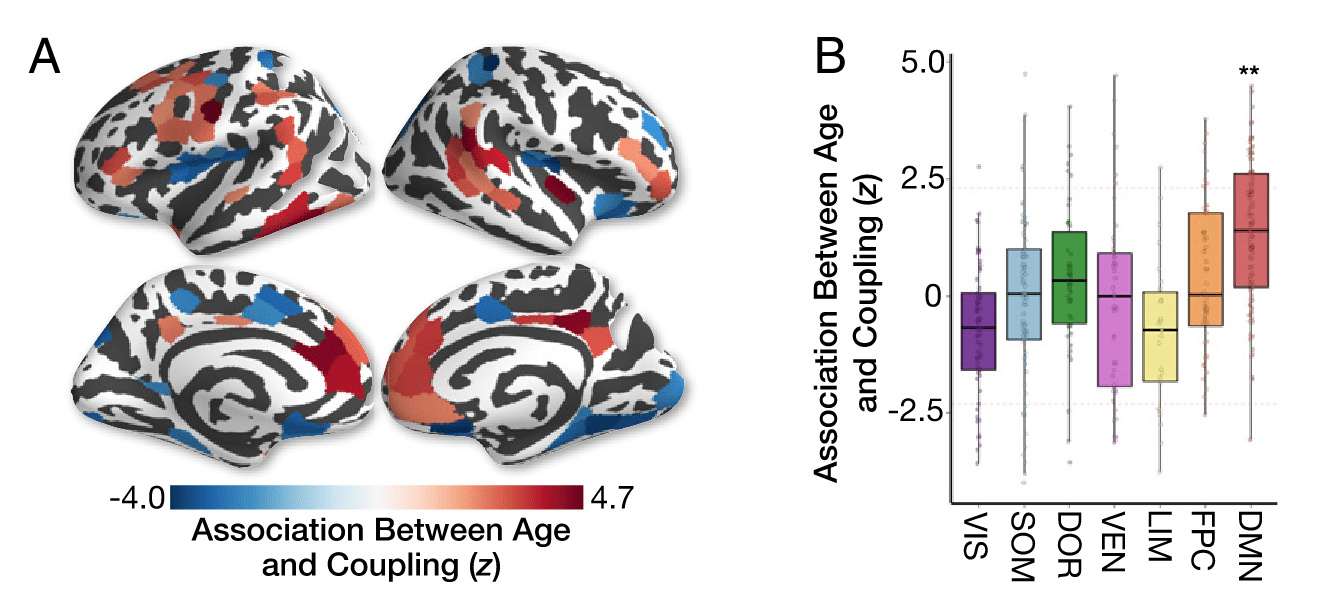
Sinha et al., 2023 (Neurol.)
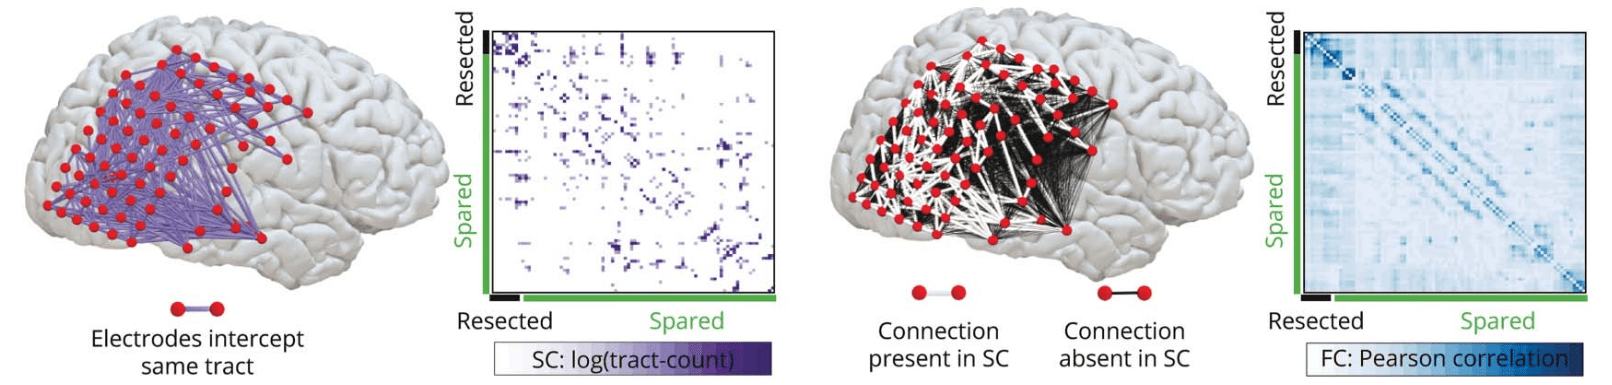
SFC and post-surgery seizure outcome
15 SF (7F) 24 nSF (16)
iEEG-FC (1h) & dMRI
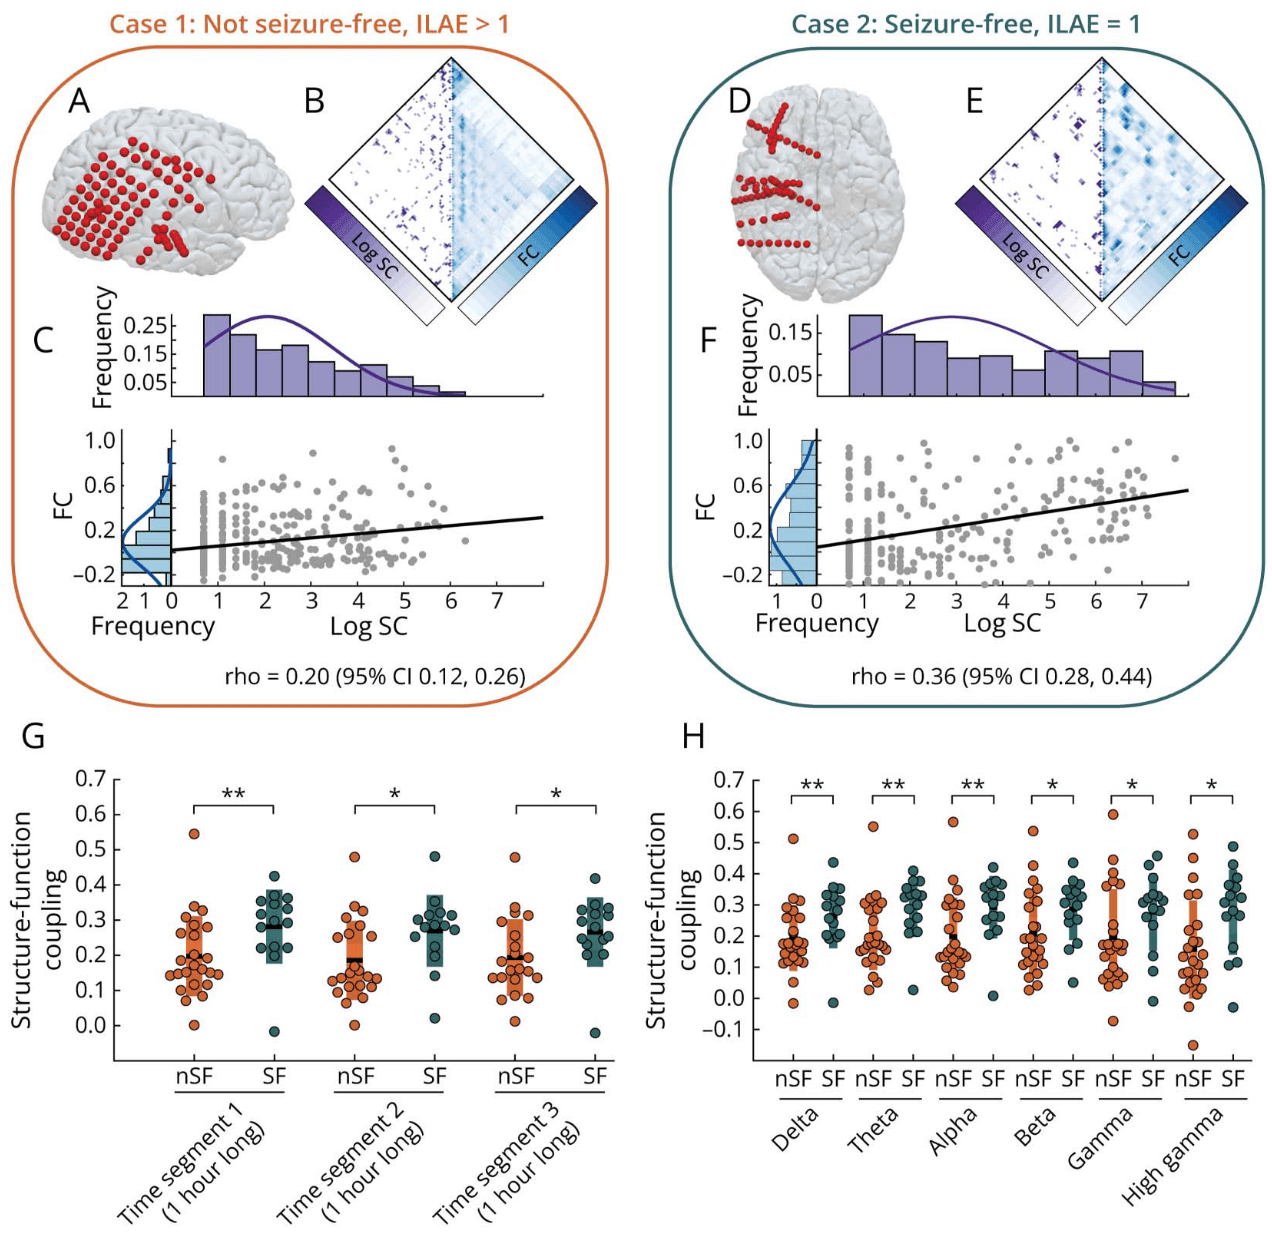
SF = Seizure Free nSF = non-Seizure Free
Structure-function coupling in EEG/dMRI
Caveat
Images adapted from Sinha et al., 2023 (Neurol.)
Sparse
\( [0,+∞) \)
Highly skewed distribution
Non-Euclidean
Dense
\( [-1,+1] \)
Somewhat normal distribution
Euclidean
Take home #1
Observing Multimodal Connectivity can be
as easy as computing a correlation.
HOWEVER,
there are a few caveats you should be aware of when doing so.
Graph Signal Processing
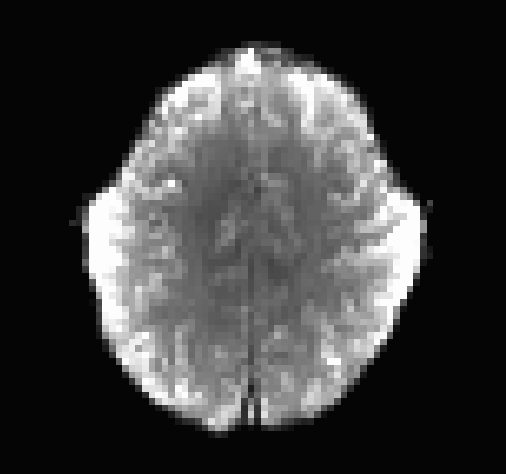
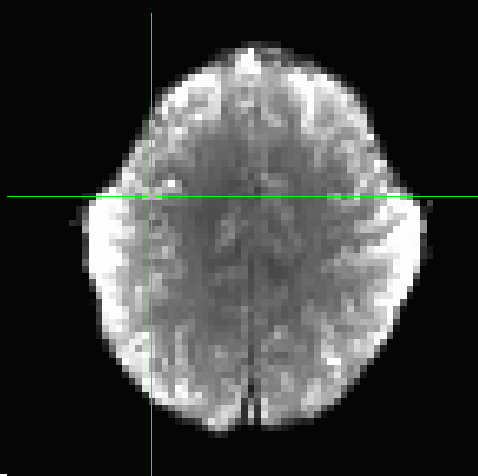
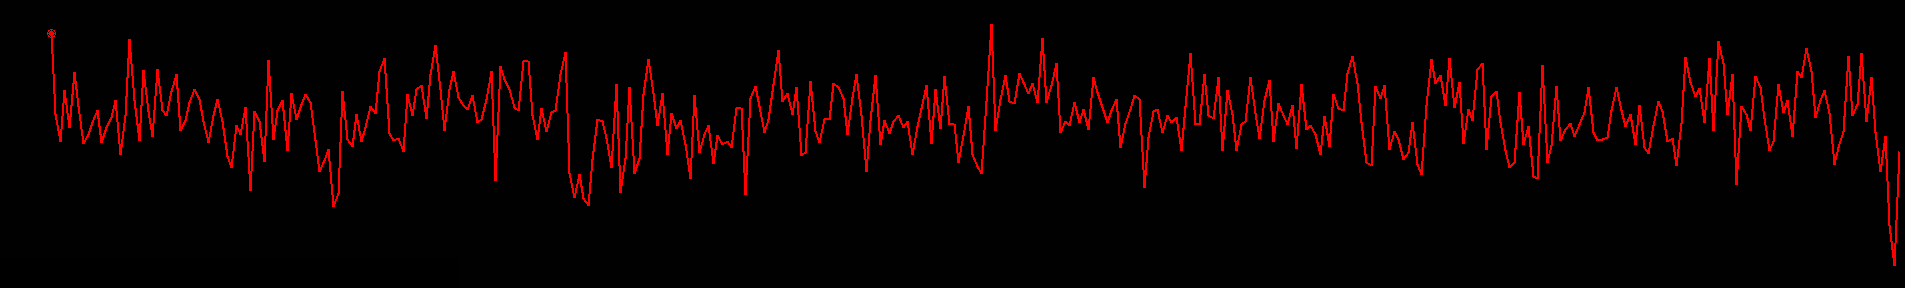
From timeseries to graphs
x1
x2
x3
x8
...
t
y
t=1
x1=y1
From timeseries to graphs
x1
x2
x3
x8
...
t
y
t=2
x2=y1
From timeseries to graphs
x1
x2
x3
x8
...
t
y
t=3
x3=y1
From timeseries to graphs
x1
x2
x3
x8
...
x1
x2
x3
x8
...
x1
x2
x3
x8
...
From timeseries to graphs
x1
x2
x3
x8
...
x1
x2
x3
x8
...
x1
x2
x3
...
x8
t=1
x1=y1
From timeseries to graphs
x1
x2
x3
x8
...
x1
x2
x3
x8
...
x1
x2
x3
...
x8
t=2
x2=y1=x1_{t1}
From timeseries to graphs
x1
x2
x3
x8
...
x1
x2
x3
x8
...
x1
x2
x3
...
x8
t=3
x3=y1=x2_{t2}
x_{k_{t}}=\sum x_{j_{t-1}}

From timeseries to graphs
x1
x2
x3
x8
...
x1
x2
x3
x8
...
x1
x2
x3
...
x8
t=3
x3=y1=x2_{t2}
From timeseries to graphs
x1
x2
x3
x8
...
x1
x2
x3
x8
...
x1
x2
x3
...
x8
t=4
x_{k_{t}}=\sum \frac {x_{j_{t-1}}} {l_{x_j}}
Graph Signal Processing
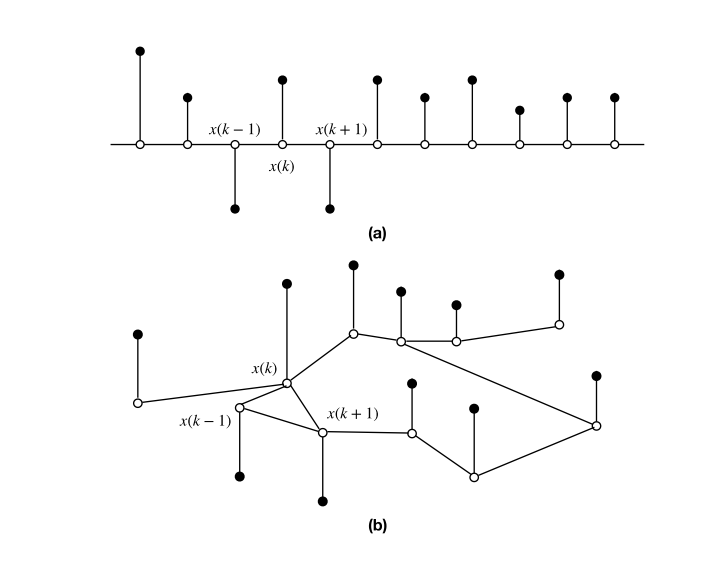
Ortega 2022 (Introduction to Graph signal Processing)
White dots = nodes
Black dots = timeseries value
Embedding brain function
into the brain structure
Image courtesy of Maria Giulia Preti; Preti et al., 2019 (Nat. Commun.)
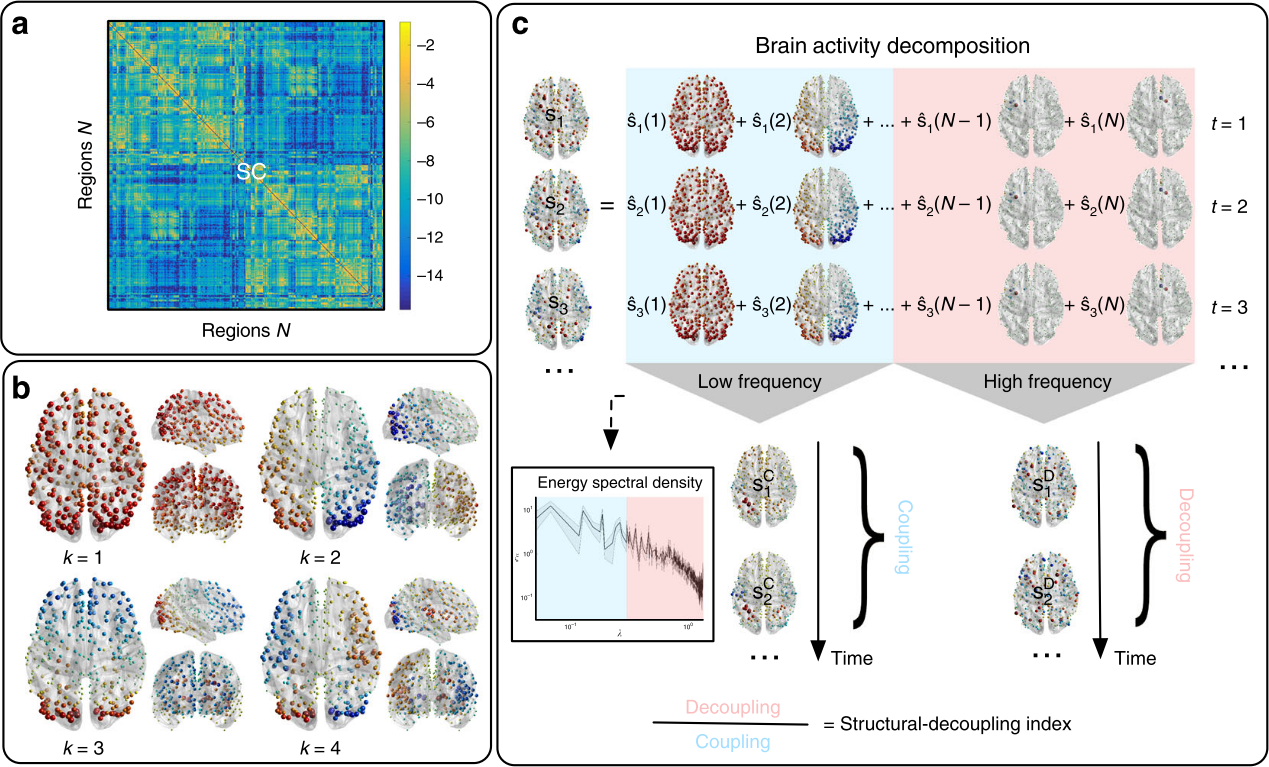
Graph Signal Processing: Decomposition
Decomposition
to access
"graph" spectral domain
(e.g. Principal Components)
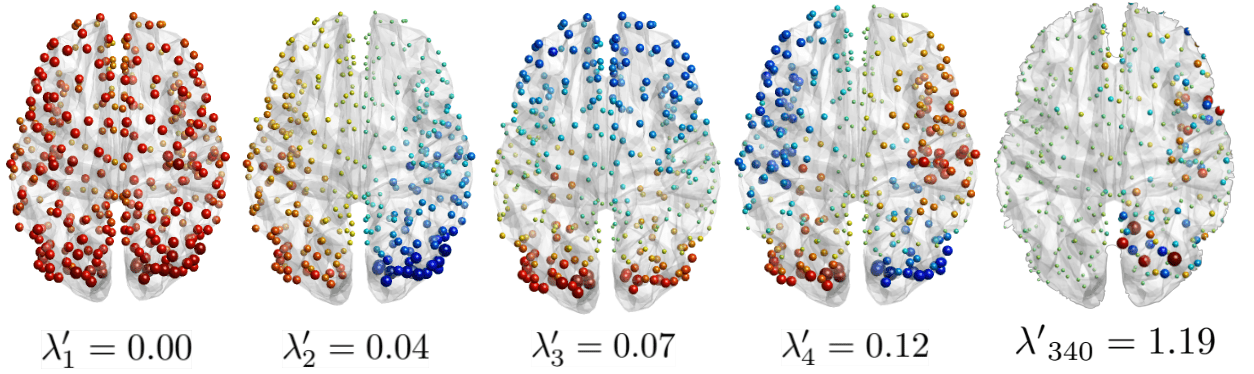
Huang et al., 2018 (Proc. IEEE)
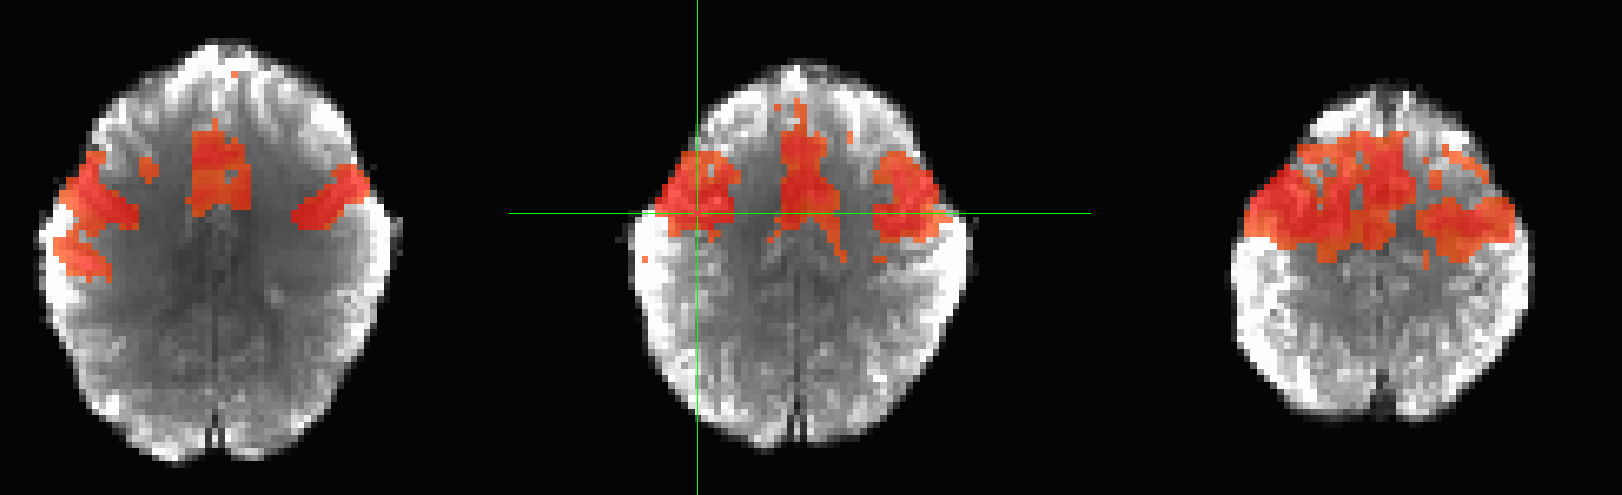
Graph Signal Processing: Filtering
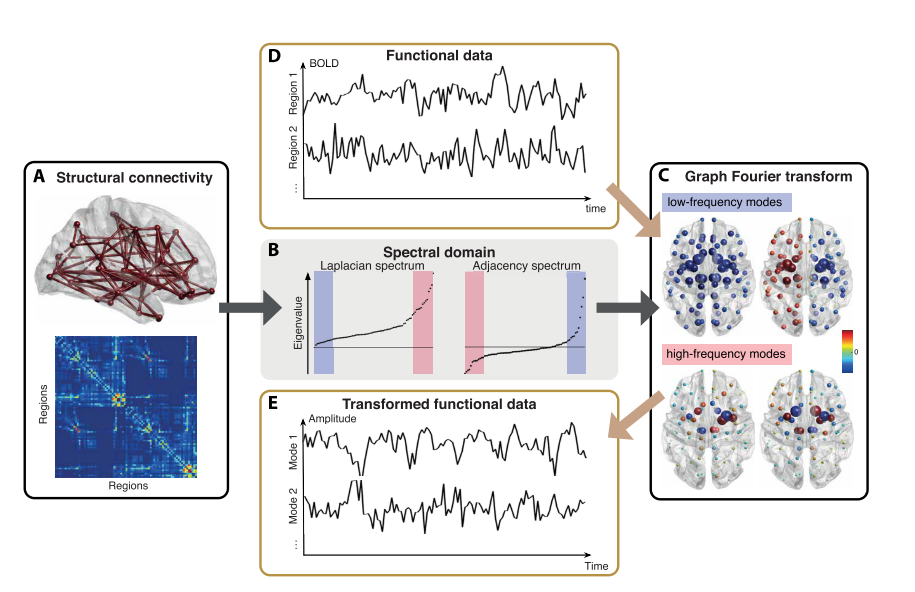
Preti et al., 2019 (Nat. Commun.)
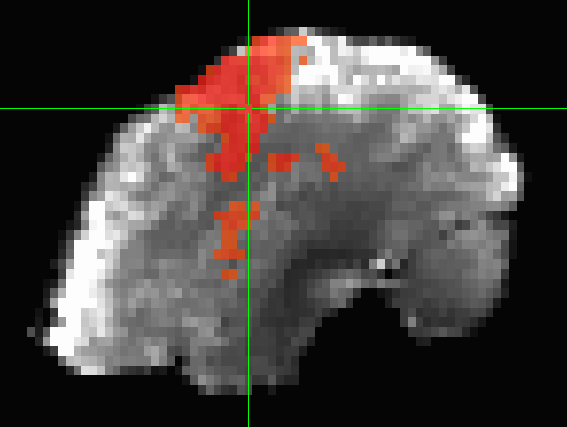
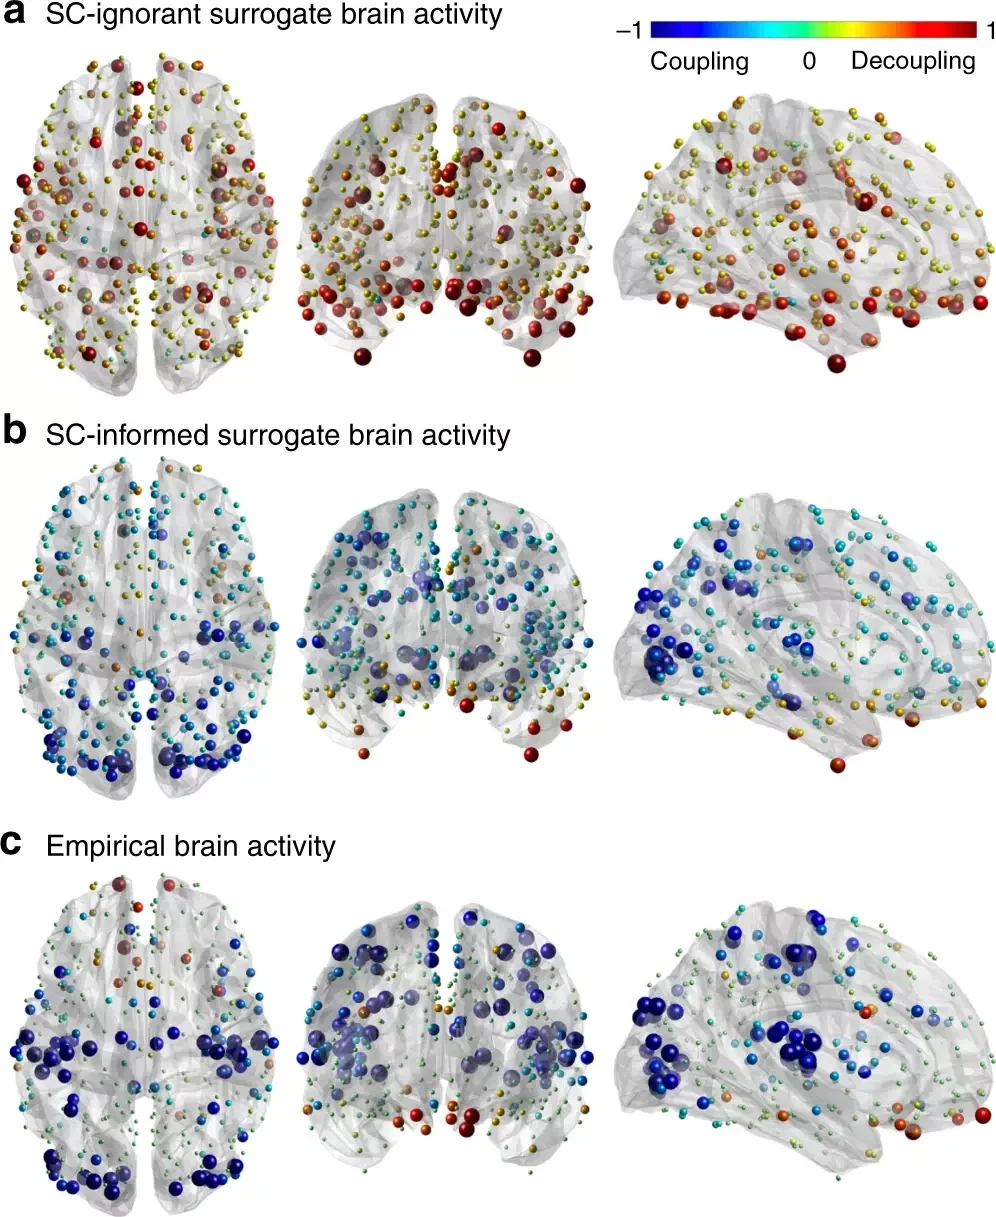
Graph Signal Processing: Structural decoupling index (SDI)
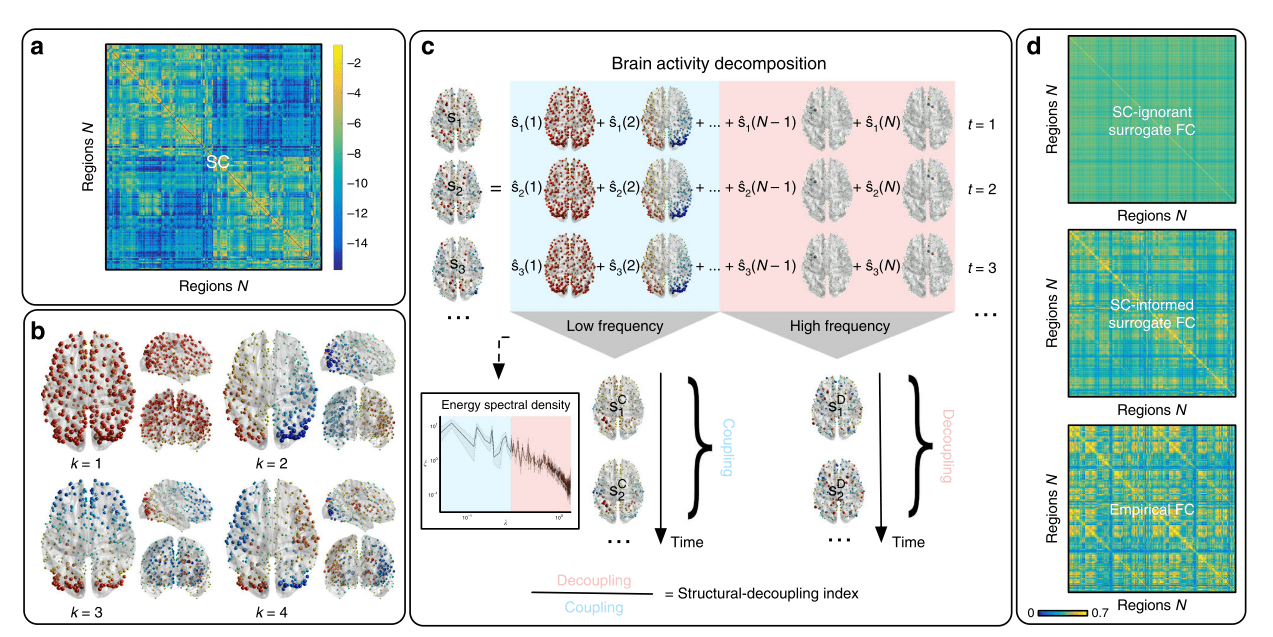
1. Cioli et al., 2014 (PLoS One), Mesmoudi et al. 2013 (PLoS One); Preti et al., 2019 (Nat. Commun.)
Graph Signal Processing: Structural decoupling index (SDI)
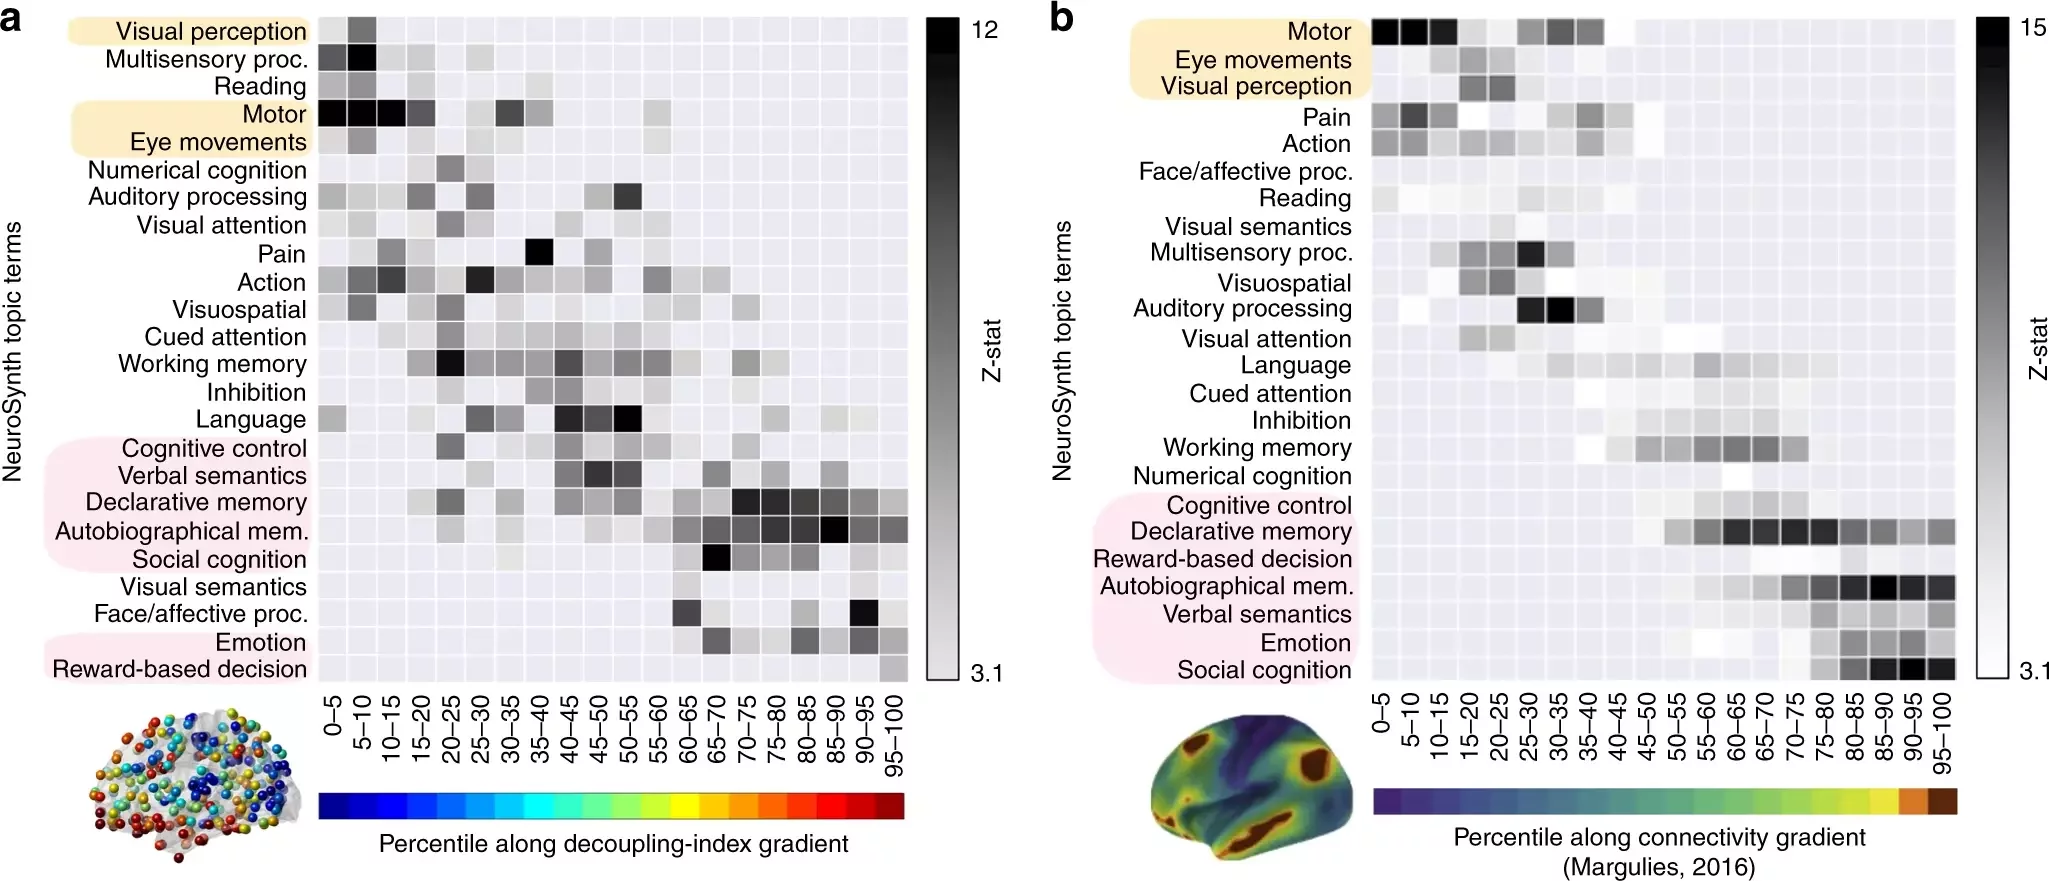
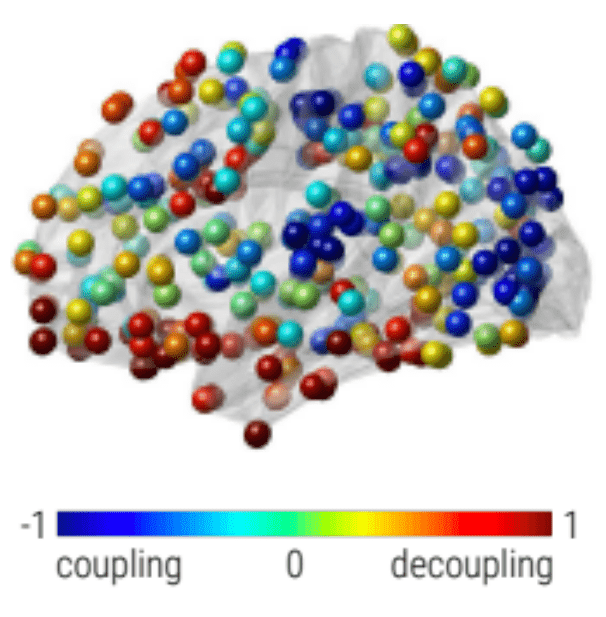
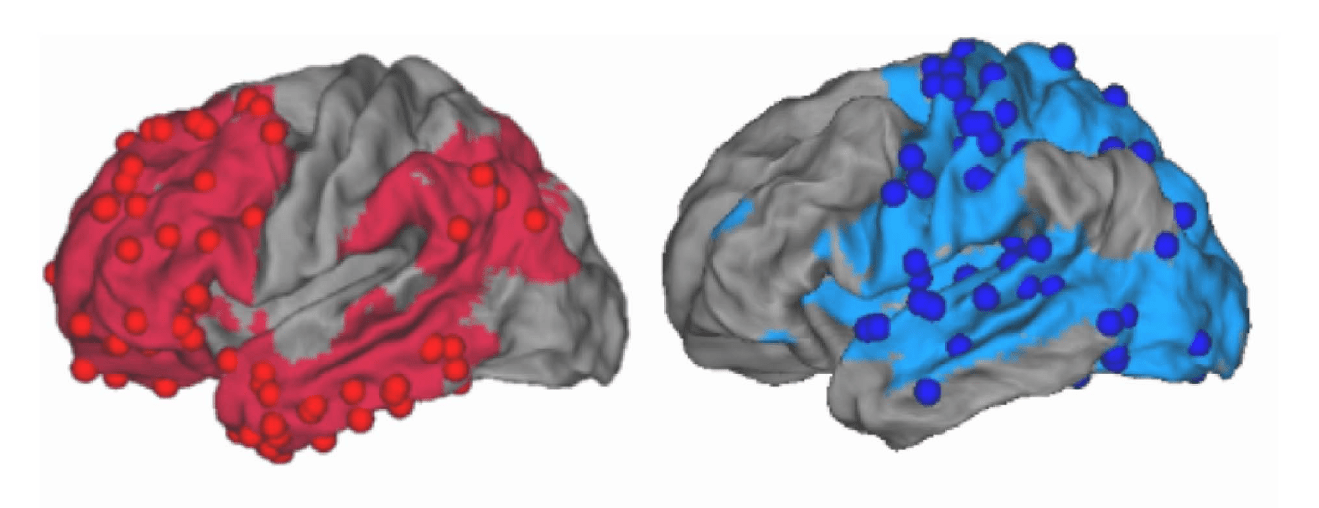
Gene expression¹
SDI²
Rapid responses Slow (sustained) responses
High functions Low functions
Cioli et al., 2014 (PLoS One); Preti et al., 2019 (Nat. Commun.)
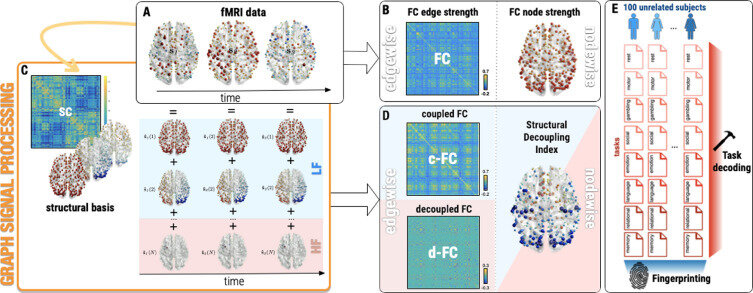
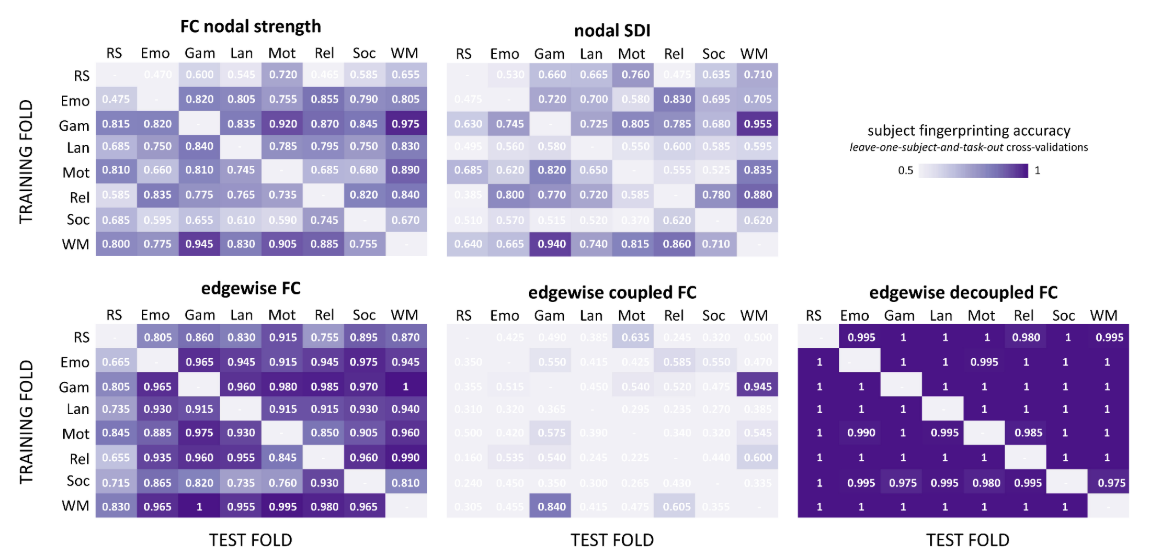
Graph Signal Processing: Subject-Task Identification
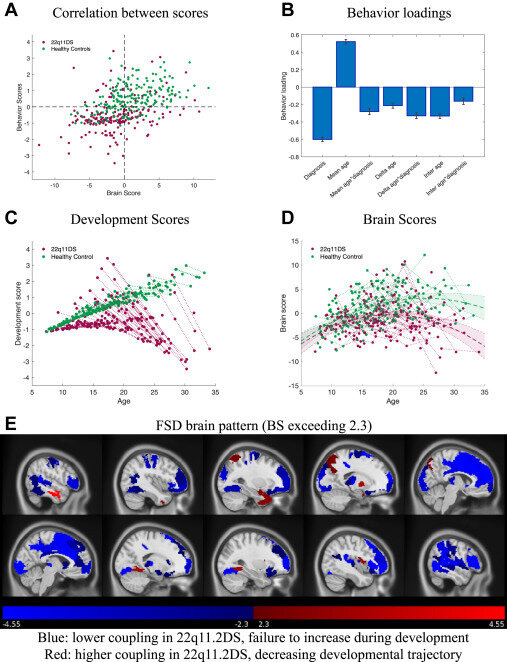
SDI in 22q11.2 deletion syndrome
Forrer et al., 2024 (Biol. Psychiatry)
233 subjects (118F), 108 22q11.2DS (50F), 7-34 y.o.
BOLD fMRI & DWI
SDI in Parkinson
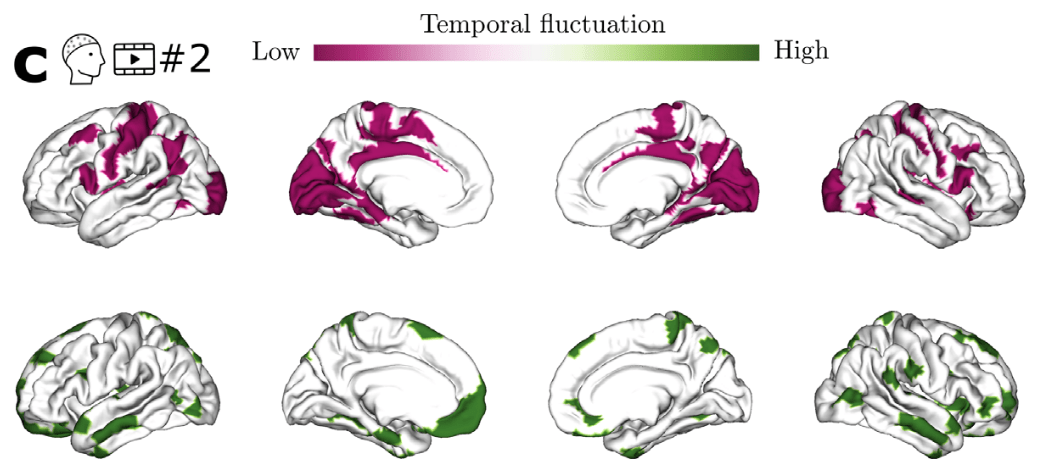
Time-resolved SDI in movies and rest¹
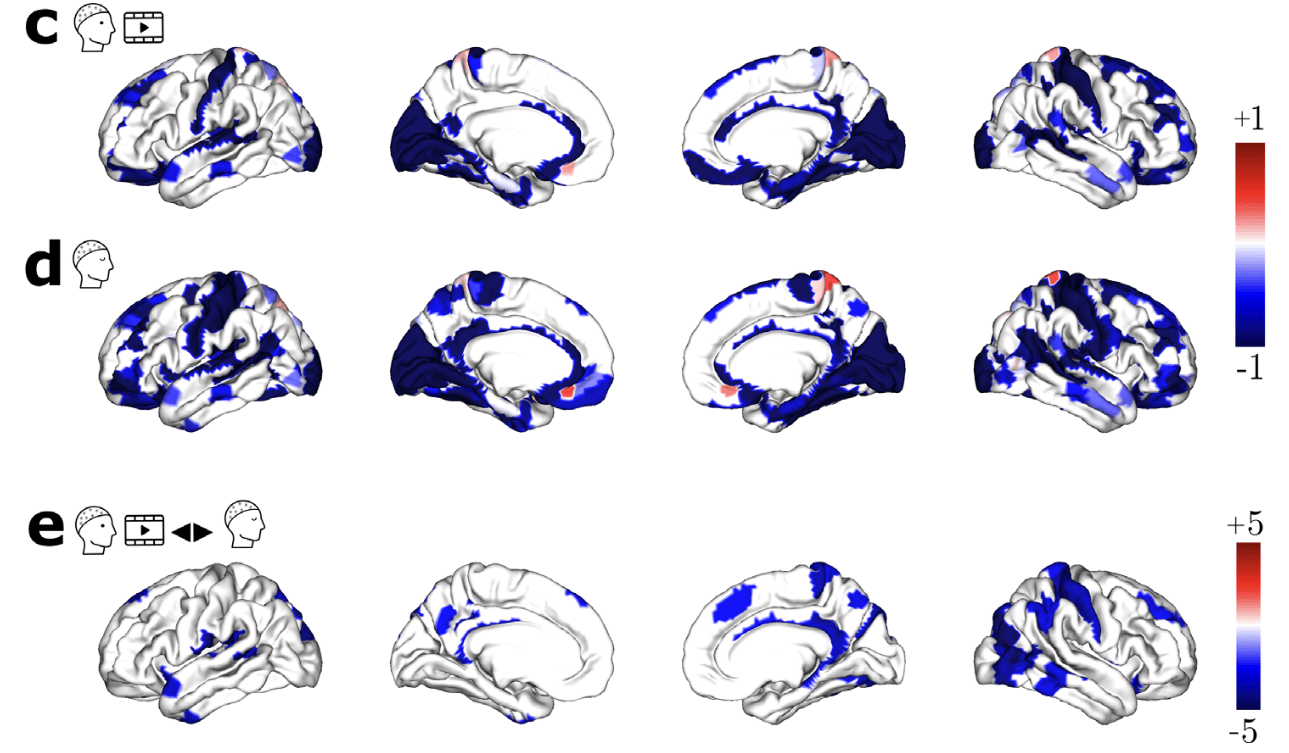
1. Subramani et al., 2025 (Imaging Neurosci.); 2. Langer et al., 2017 (Sci. Data)
Healthy Brain
Network² data
EEG & DWI
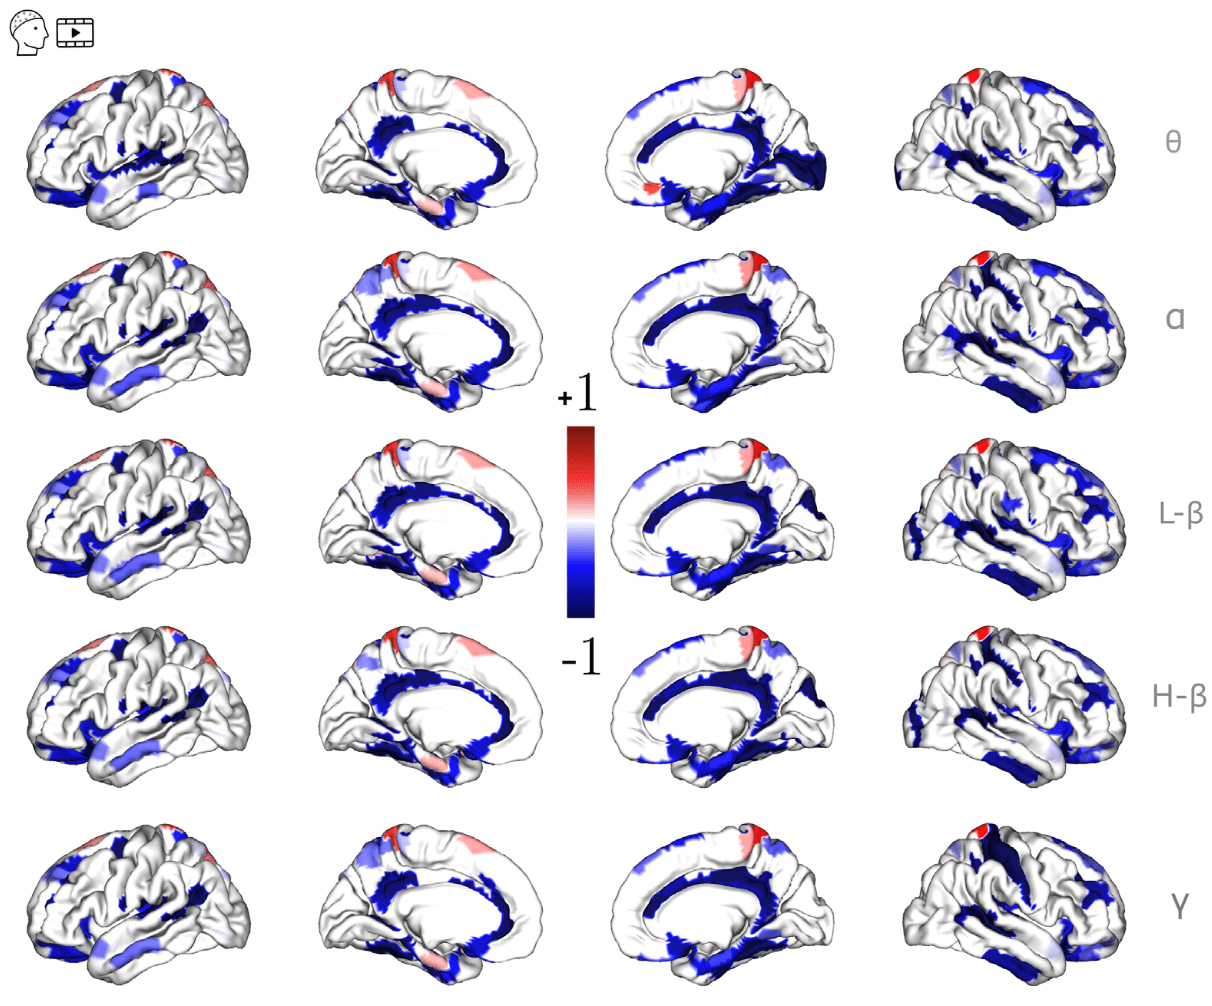
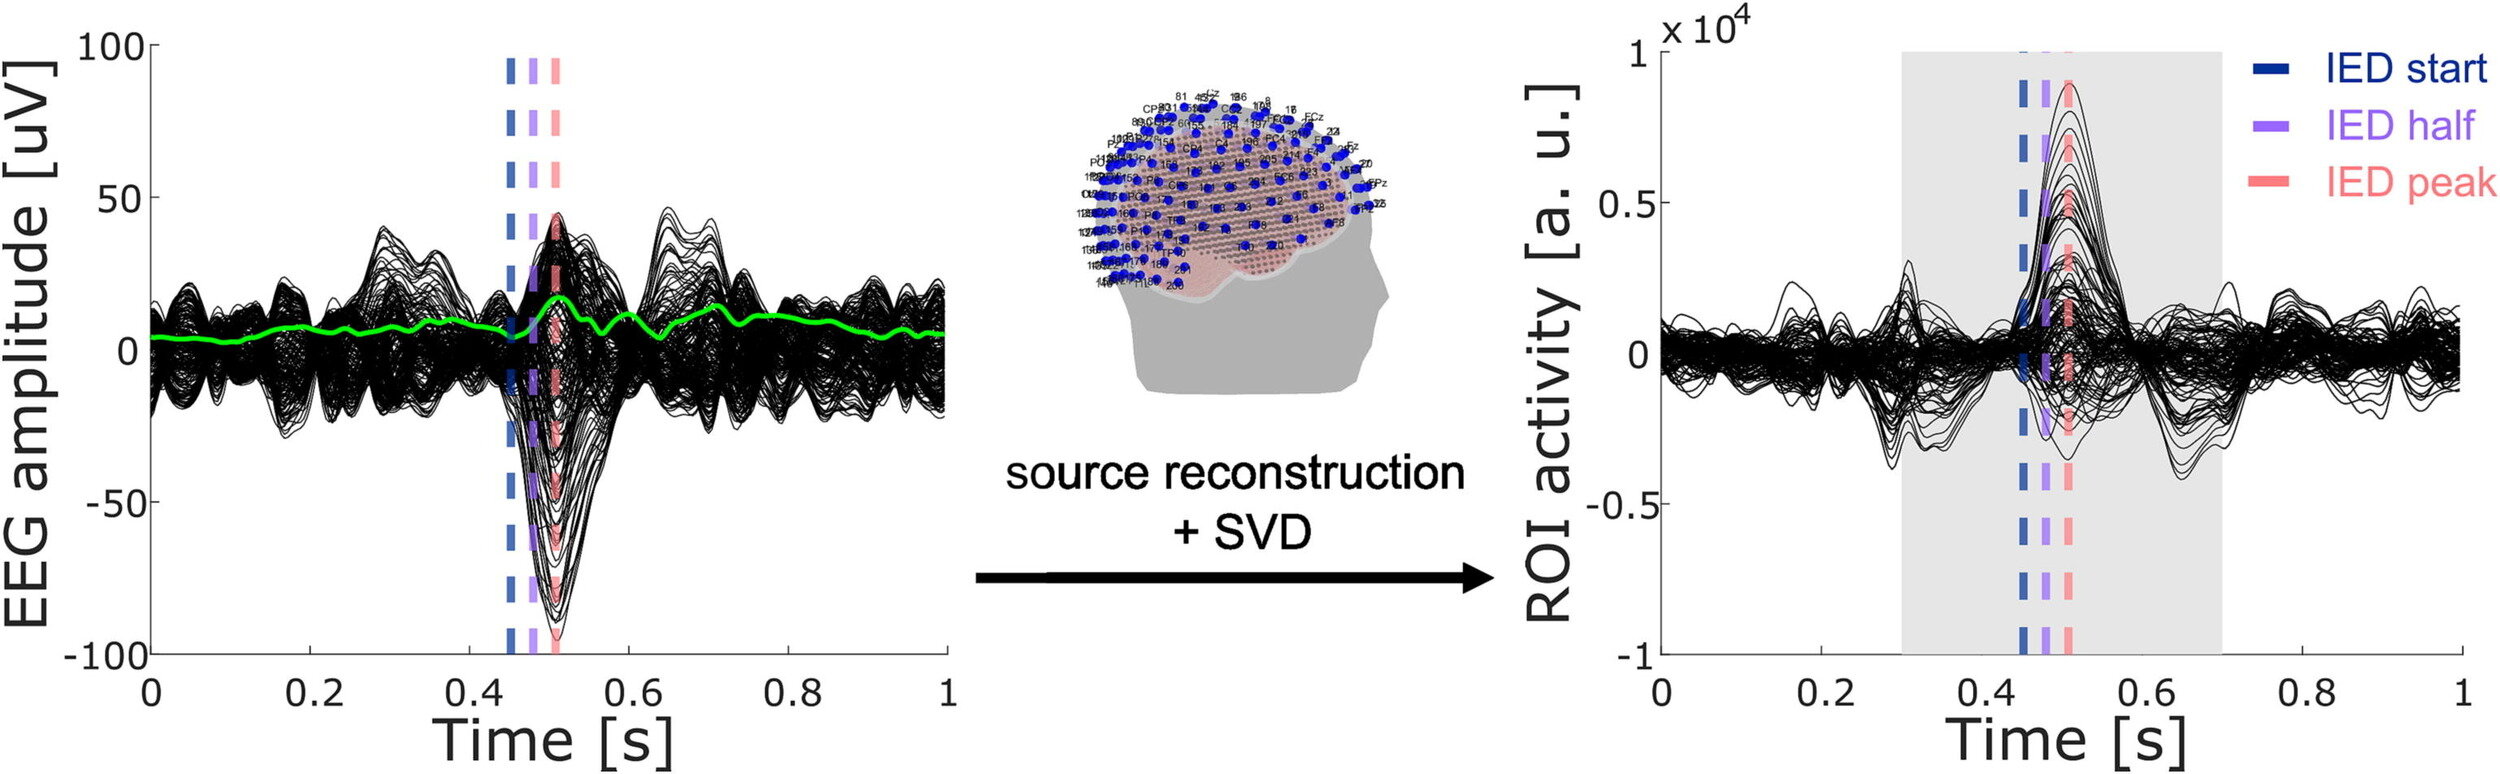
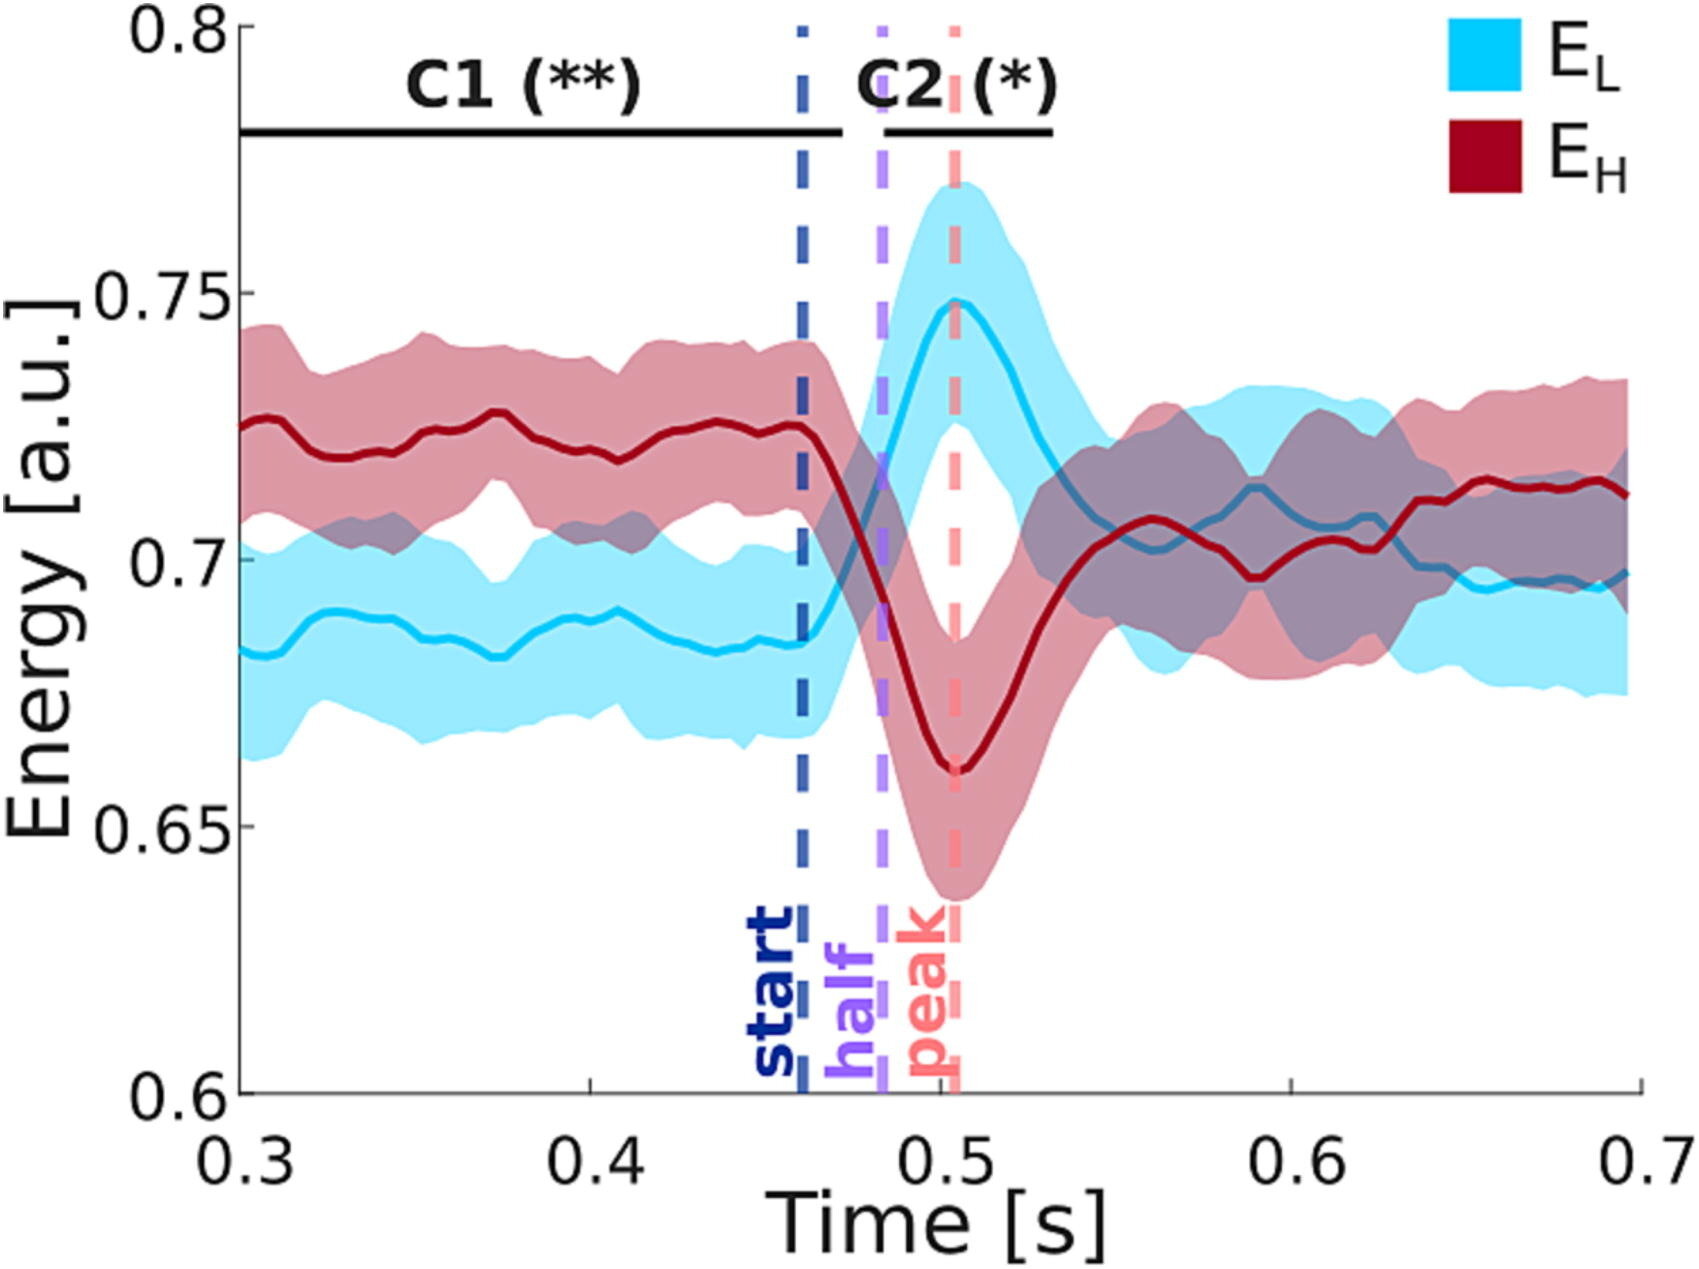
SDI in temporal lobe epilepsy (TLE)
Rigoni et al., 2023 (Clin. Neurophysiol.)
17 patients (5F),
8 left TLE,
15–56 y.o.
EEG & DWI
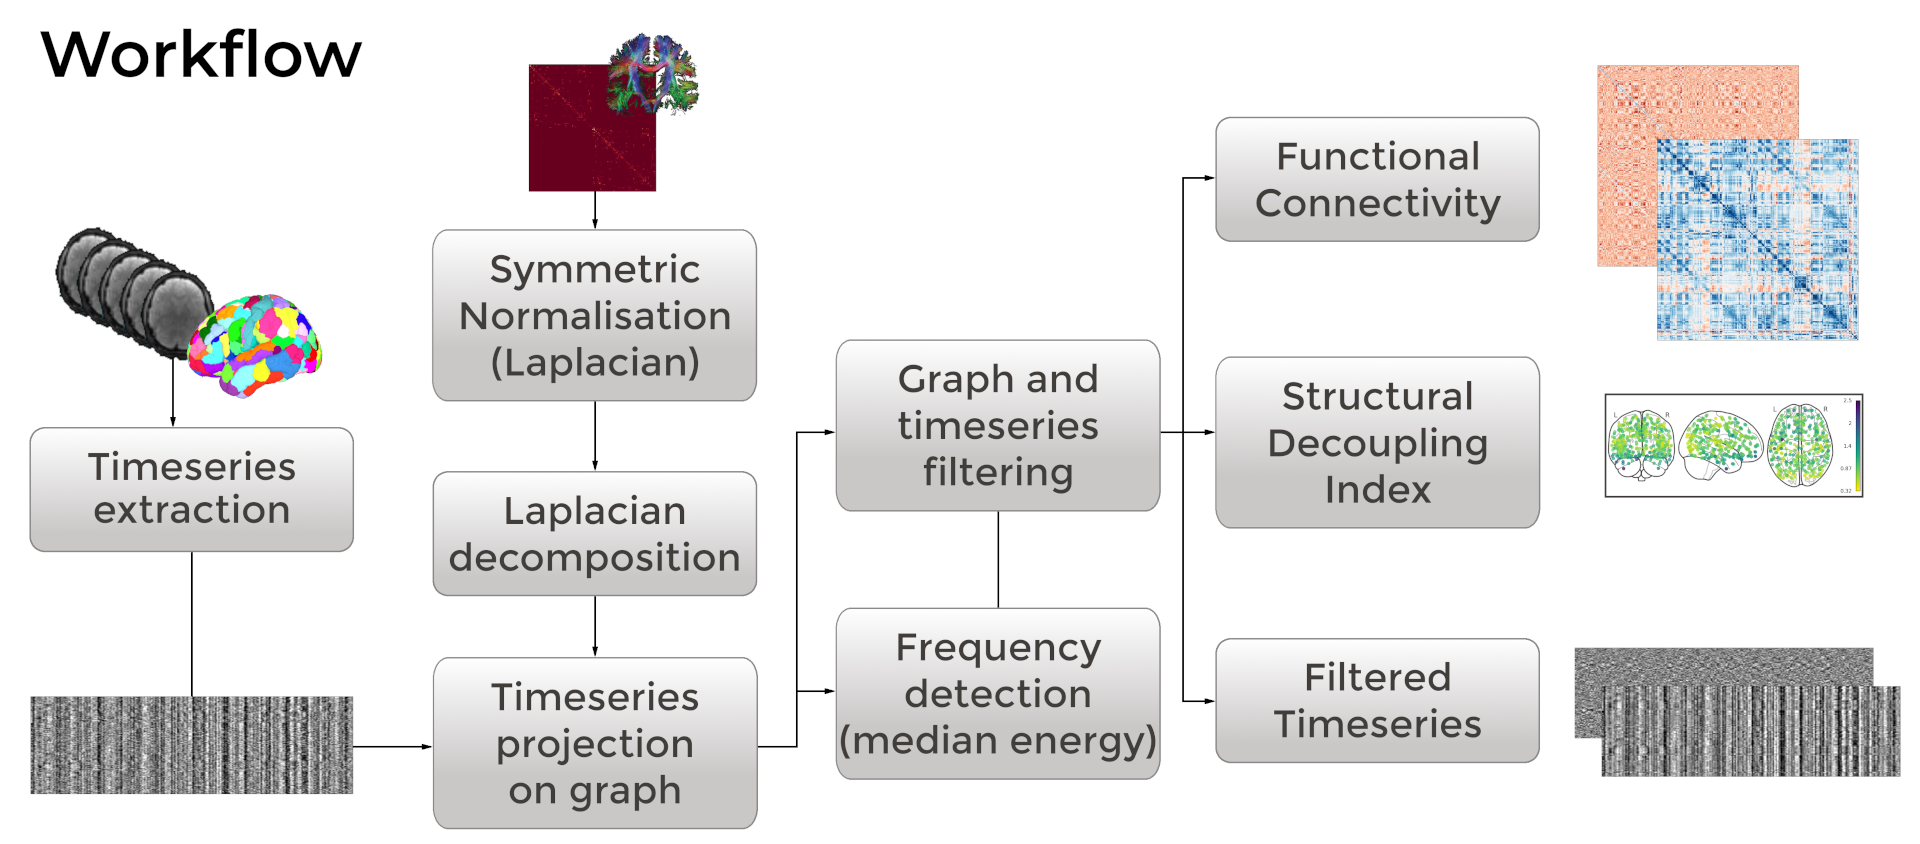
pip install nigsp[all]

nigsp -f timeseries.nii.gz -s sc_mtx.tsv \
-a atlas.nii.gz --informed-surrogates -n 1000
Moia et al. (2023) Zenodo; based on Preti, Van De Ville (2019) Nat. Commun. and Griffa et al. (2022) Neuroimage
Applying Graph Signal Processing: NiGSP
Take home #2
We can leverage Graph Signal Processing
to better explore more complex spatio-temporal features of timeseries embedded in graphs.*
BOLD fMRI
M/EEG
fNIRS
Tractography
EEG caps
Anatomy
*And it's still as easy as installing a python package
Thanks to...
That's all folks!
| smoia | |
| @SteMoia | |
| s.moia.research@gmail.com |
...you for the (sustained) attention!
...the MR-methods group @UM

...the MIP:Lab @ EPFL
Stefano Moia, 2025
Find the presentation at:
slides.com/smoia/
airmm2025/scroll

Any question [/opinions/objections/...]?
Stefano Moia, 2025
Find the presentation at:
slides.com/smoia/
airmm2025/scroll
1. Multimodal Connectivity analysis is as easy as a correlation of two matrices, with important caveats.
2. Graph Signal Processing is a better approach to model multimodal relationships.
Take home messages
Multimodal Imaging across structure and function [AIRMM2025]]
By Stefano Moia
Multimodal Imaging across structure and function [AIRMM2025]]
CC-BY 4.0 Stefano Moia, 2025. Images are property of the original authors and should be shared following their respective licences. This presentation is otherwise licensed under CC BY 4.0. To view a copy of this license, visit https://creativecommons.org/licenses/by/4.0/