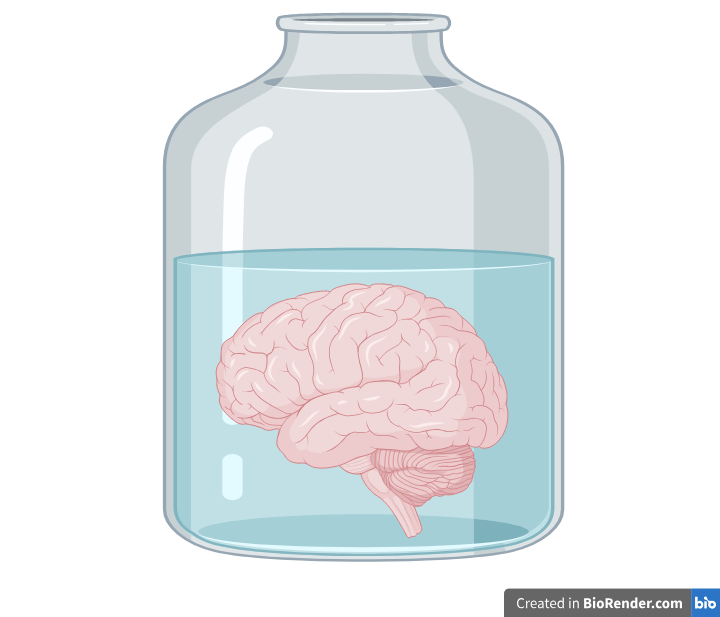
You're not a brain in a vat.
You're a brain in a body.

| smoia | |
| @SteMoia | |
| s.moia.research@gmail.com |
Tainan, 15.06.2025
Stefano Moia, 2025
The impact of dynamic and static
physiological sources on brain data.

Faculty of Psychology and Neuroscience, Maastricht University, Maastricht, The Netherlands; Open Science Special Interest Group (OHBM); physiopy (https://github.com/physiopy)
This is a new chapter
This is a new chapter
Take home #0
This is a take home message
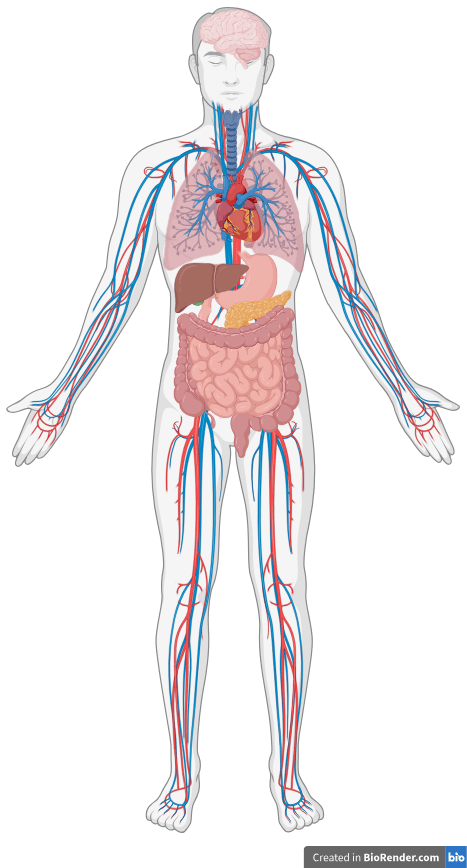
Brains in vats?
No, brains in bodies
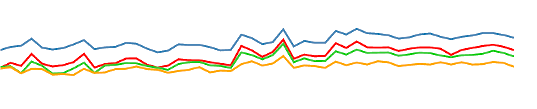
Impact of physiology on data variance
1. Bianciardi et al., 2009 (Magn. Reson. Imaging.); 2. Triantafyllou et al., 2005 (NeuroImage);
3. jorge et al., 2013 (Magn. Reson. Imaging.), Reynaud et al., 2017 (Magn. Reson. Med.)
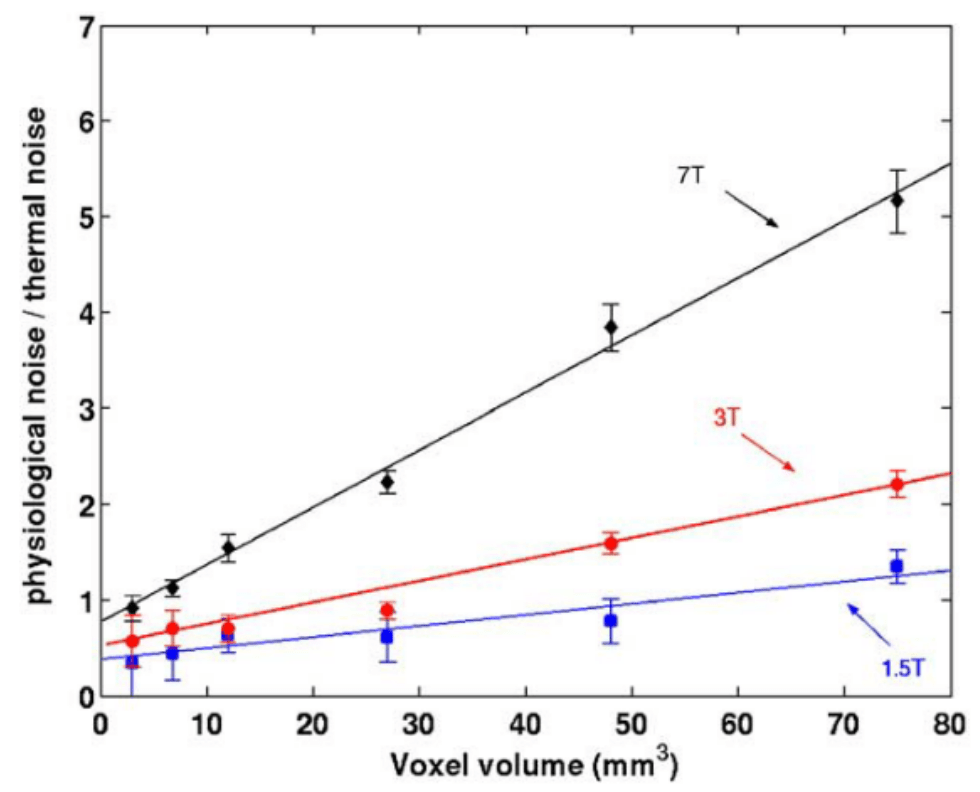
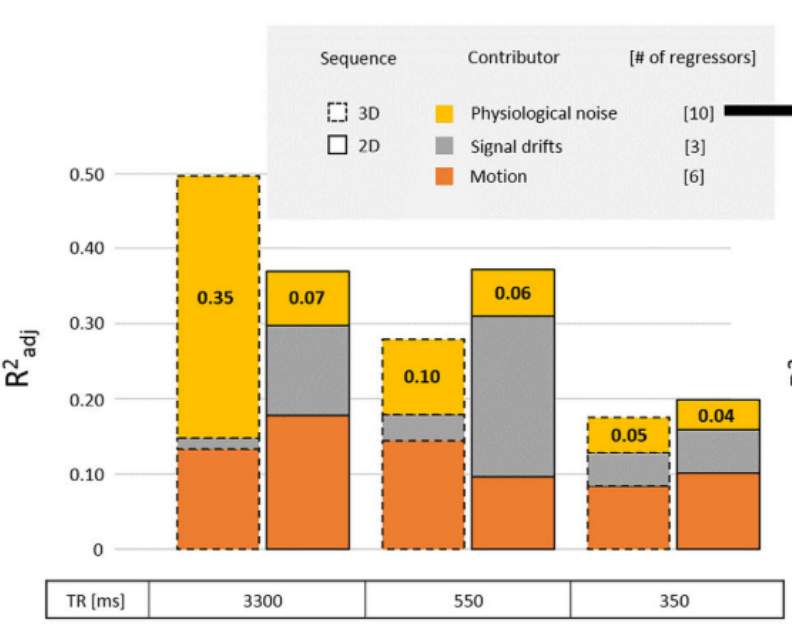
Physiology-related variance varies:
- By voxel size¹ ² and position¹
- By field strength²
- By sequence type and TR³
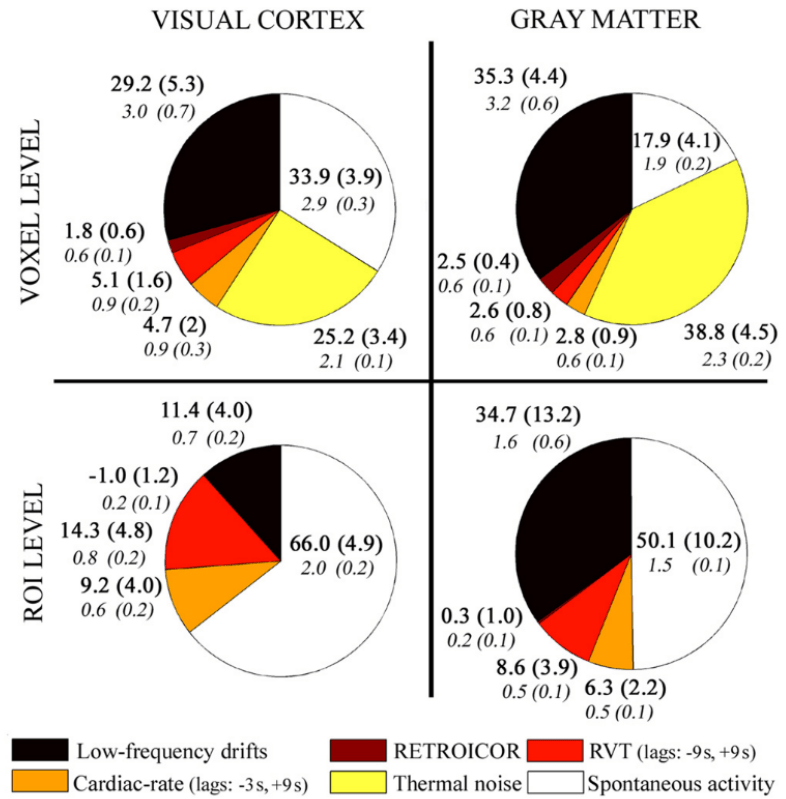
Impact of physiology on data variance
1. Krentz et al., 2023 (bioRxiv), Carlton et al., 2024 (bioRxiv), Moia et al., 2024 (bioRxiv);
2. Birn et al., 2009 (NeuroImage), image courtesy of Jingyuan Chen; 3. Lee et al., 2023 (HBM)
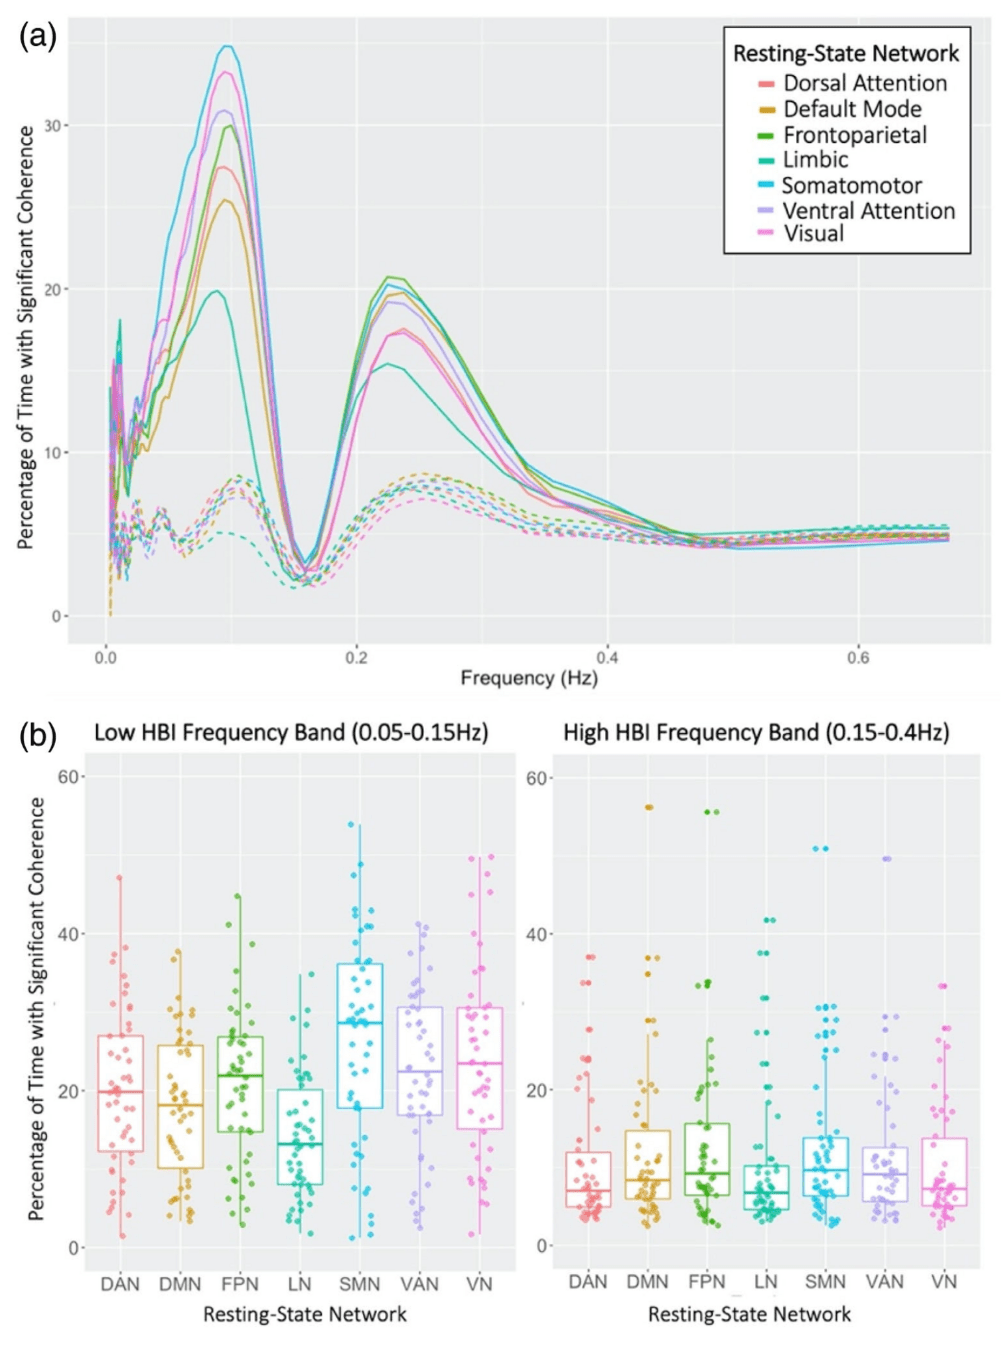
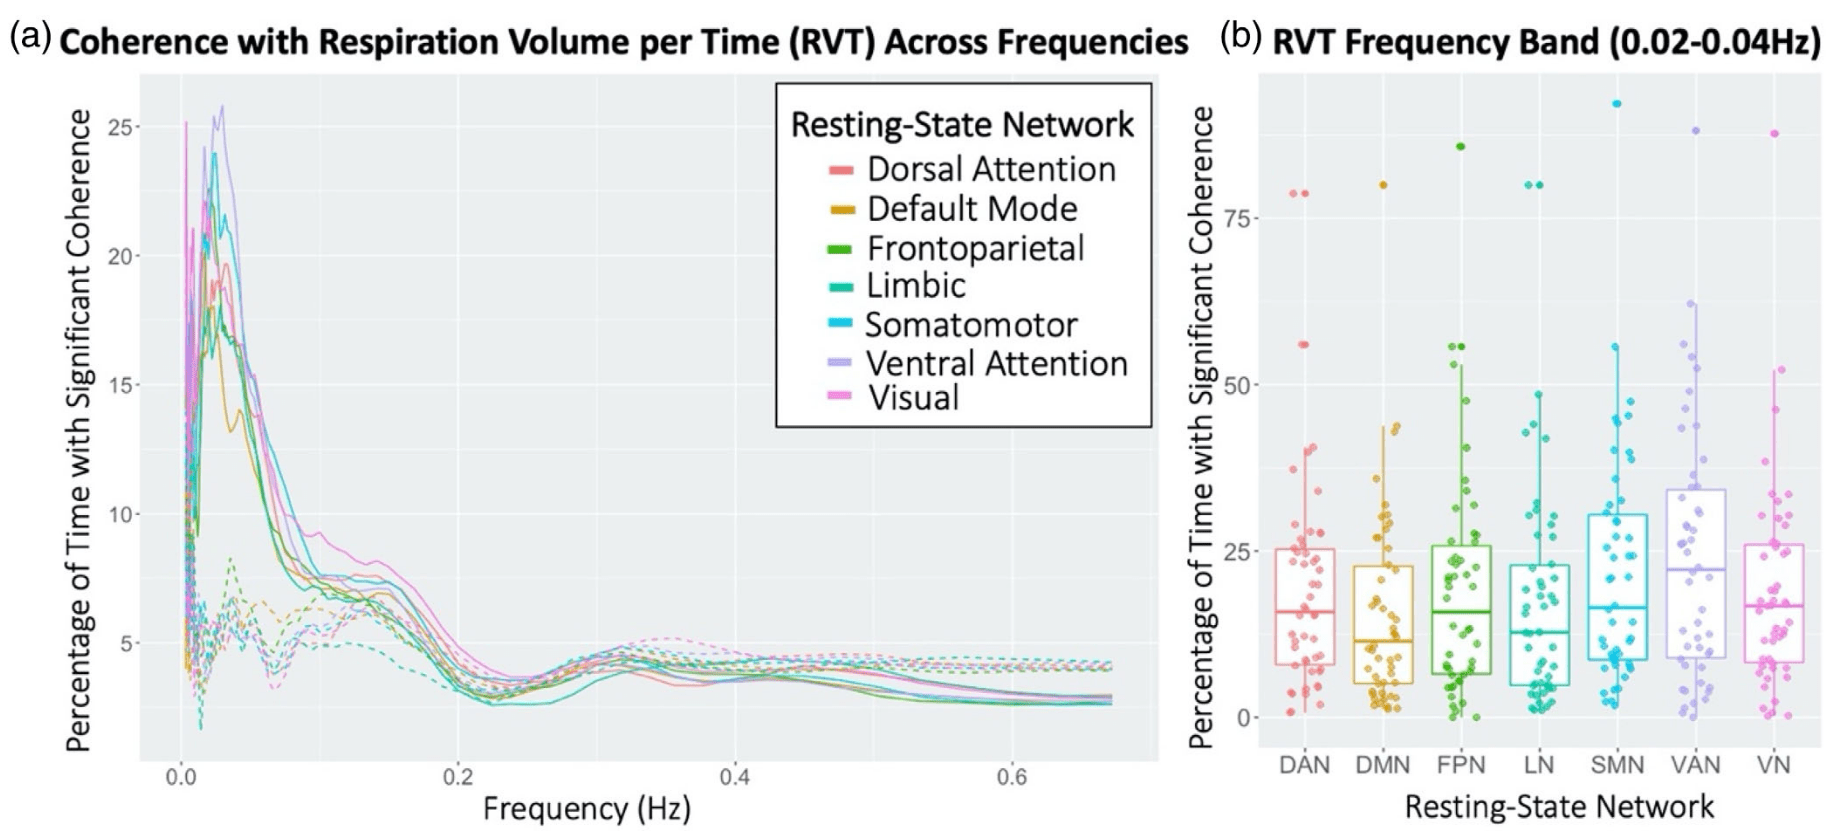
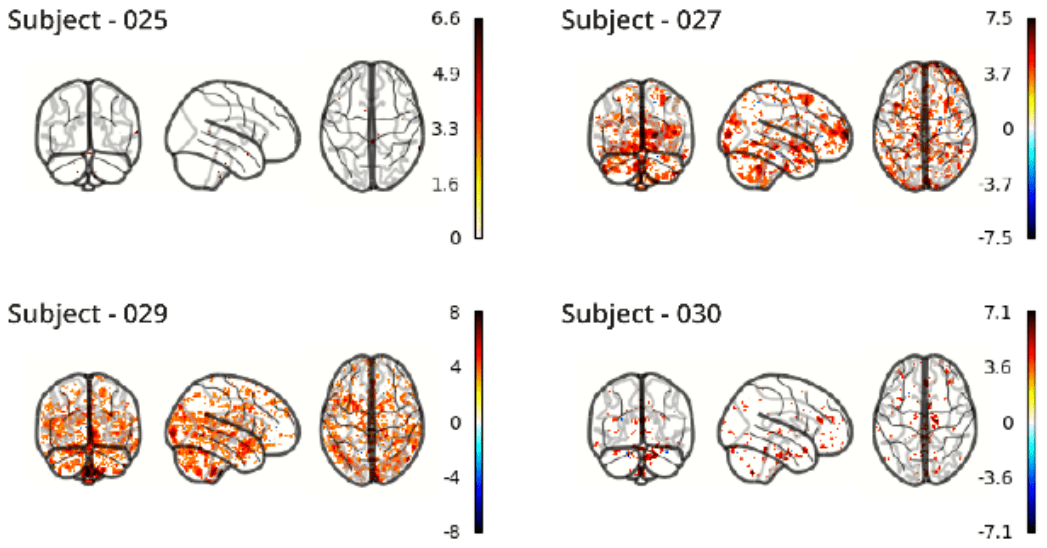
Physiology-related variance varies:
- By individual & session¹
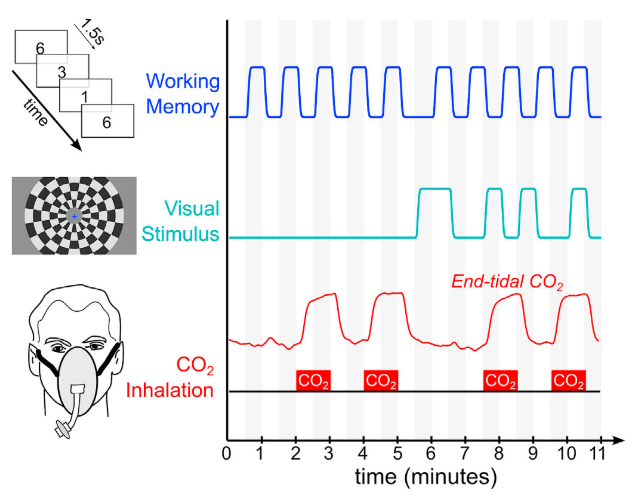
- By task (task-locked)²
- By Resting State Network³
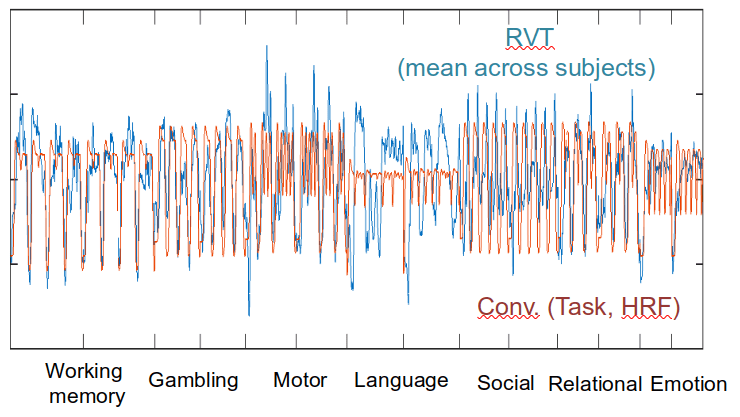
Ventilation
Task (convolved)
RETROICOR variability
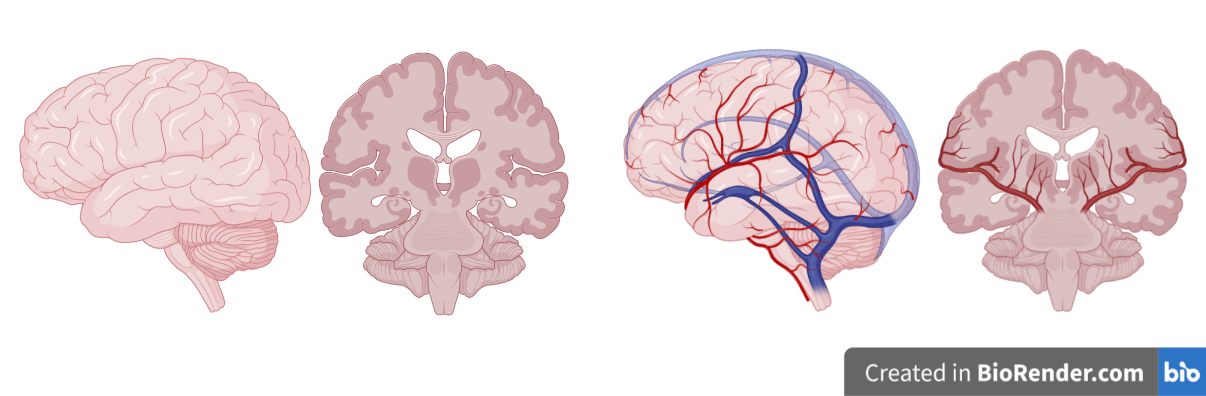
Neurovascular Coupling
and
Cerebrovascular Reactivity
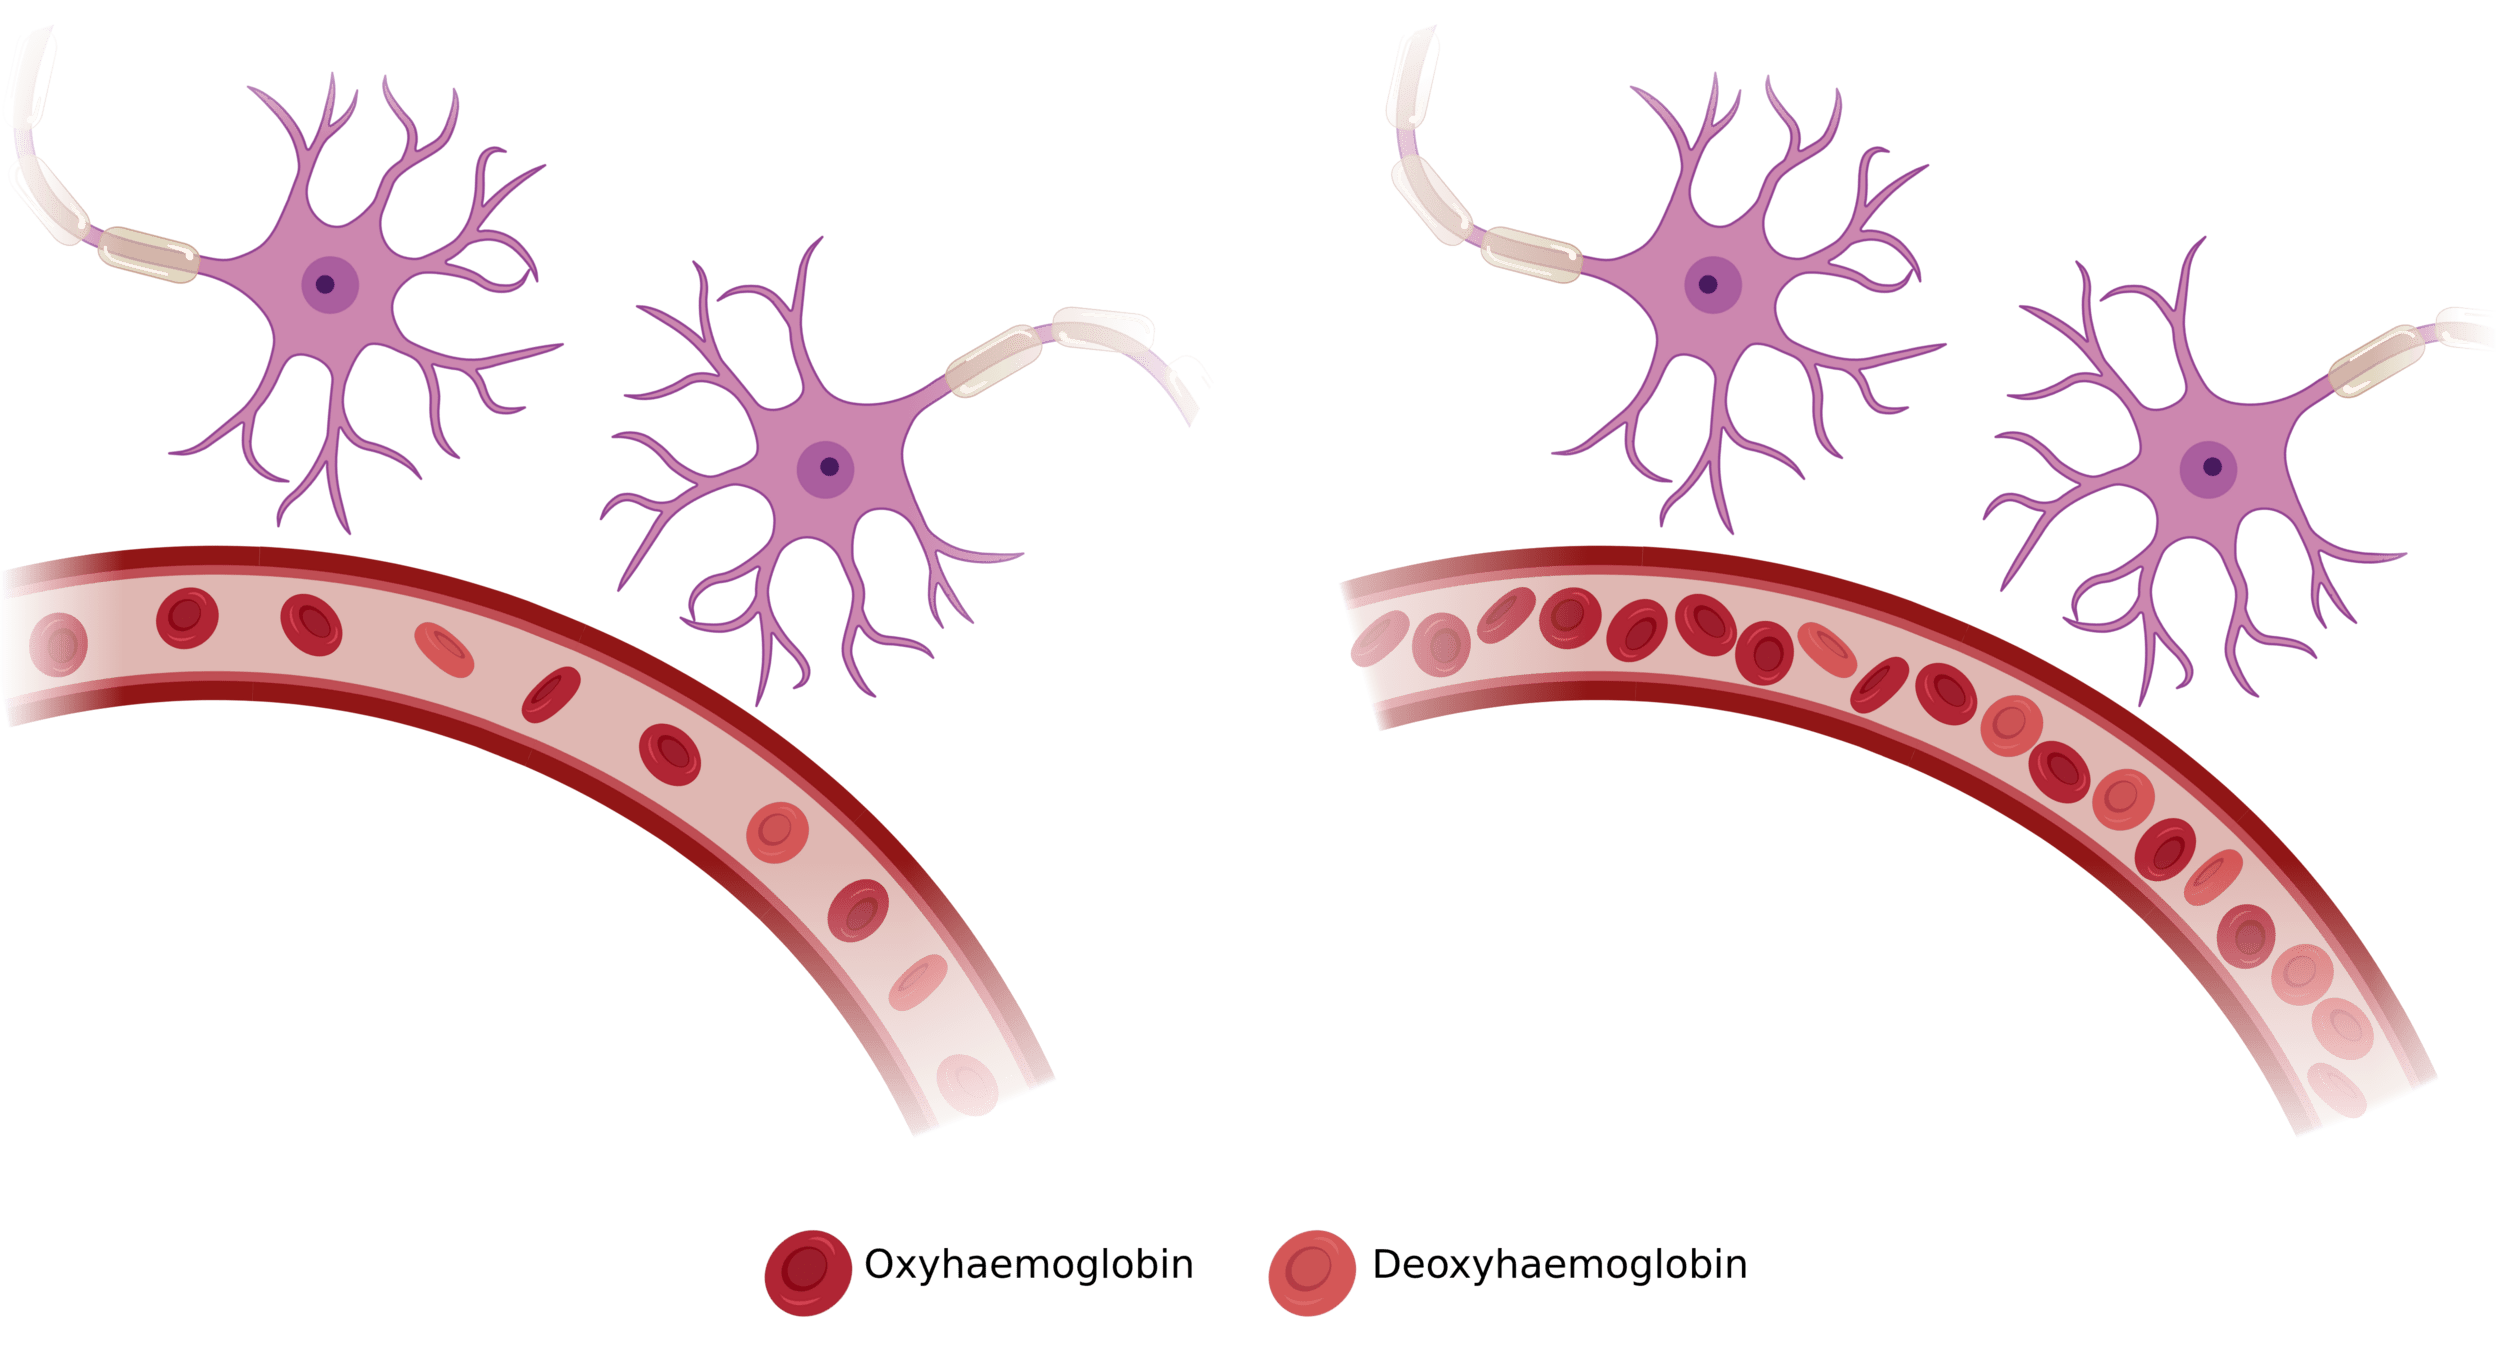
Neurovascular Coupling
Neurovascular Coupling
Image courtesy of Dimo Ivanov


Changes in
Haemodynamics
Neurovascular
Coupling
Changes in Oxygen Metabolism
Changes in
BOLD signal
(Venous) Vasculature
Arrows indicate causal influence
Neurovascular Coupling
Image courtesy of Dimo Ivanov
Changes in
Haemodynamics
Neurovascular
Coupling
Changes in Oxygen Metabolism
Changes in
BOLD signal
(Venous) Vasculature
Arrows indicate causal influence
Cerebrovascular regulatory mechanisms, e.g. cerebrovascular reactivity
Cerebrovascular Reactivity and cognitive performance
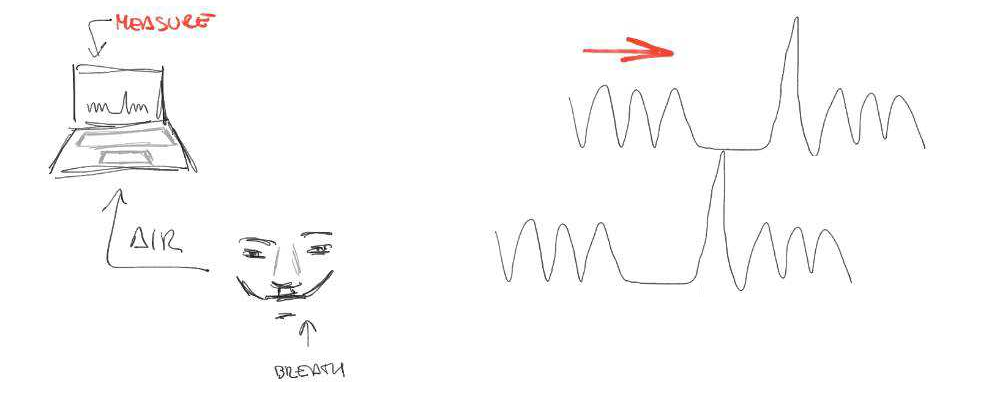
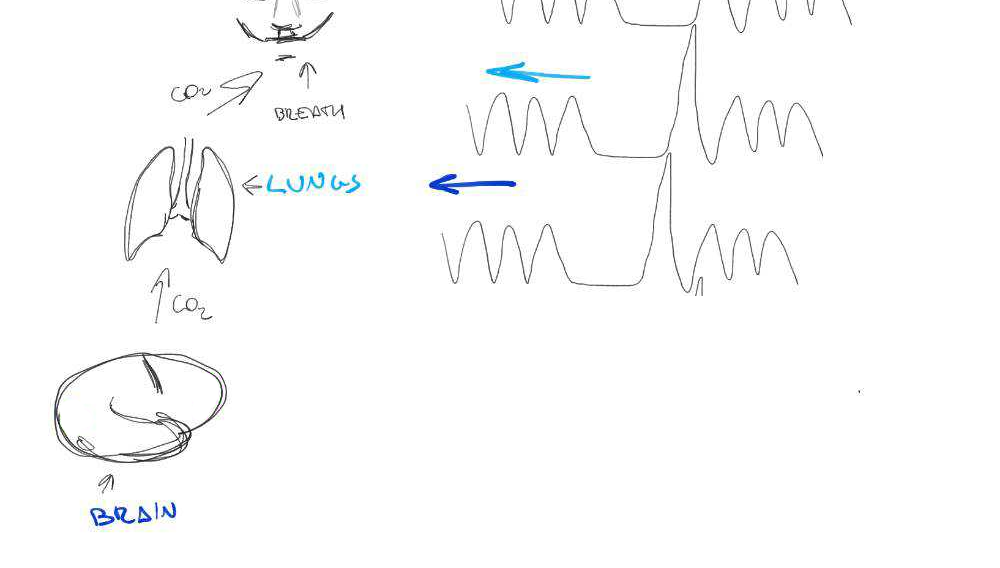
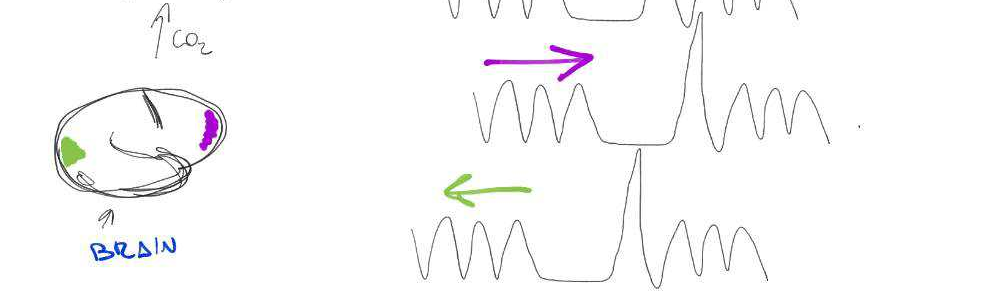
Cerebrovascular Reactivity (CVR)
Cerebrovascular Reactivity (CVR) is the response of cerebral vessels to a vasoactive stimulus (e.g. CO2) to provide sufficient O2 to cerebral tissues¹
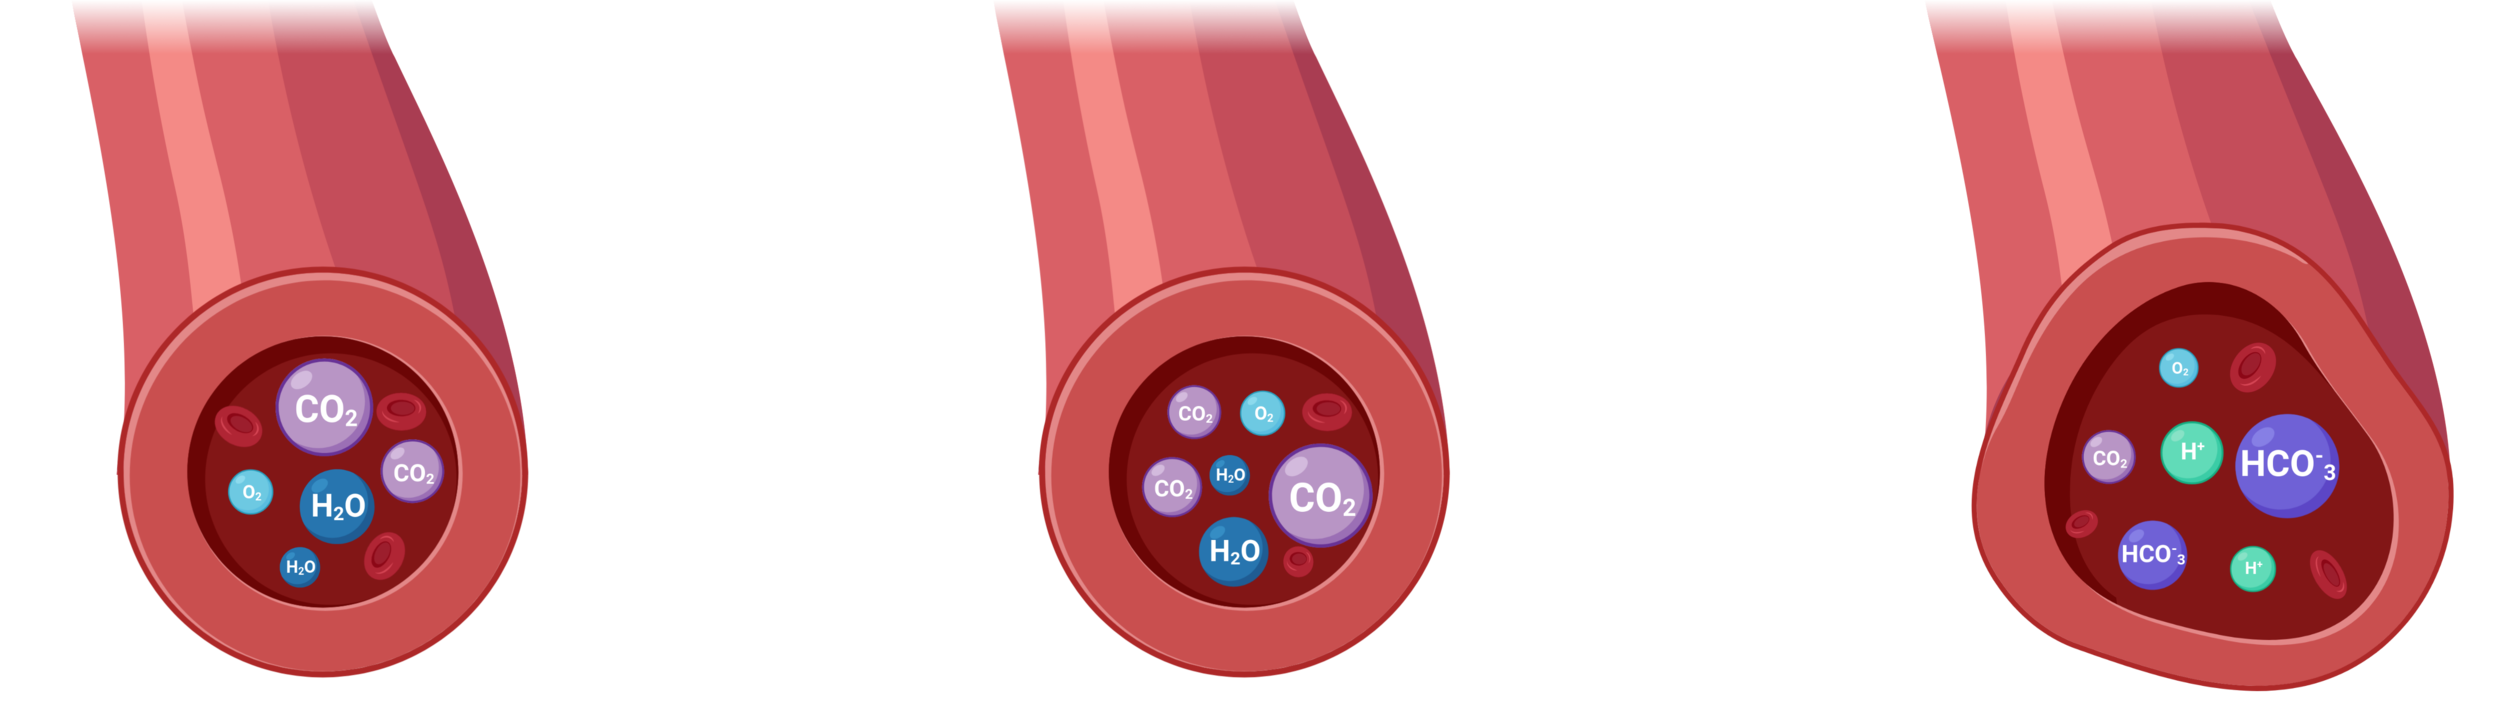
1. Liu et al., 2018 (Neuroimage); 2. Pinto et al., 2021 (Front. Physiol.), Moia et al., 2021 (Neuroimage)
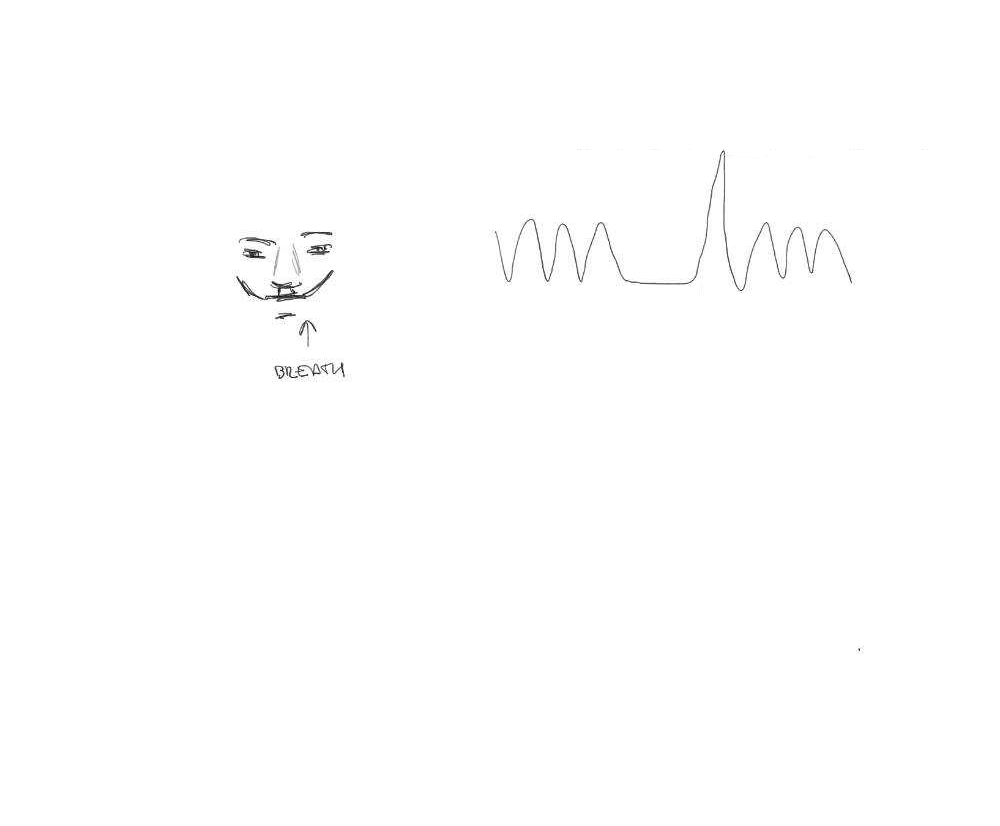
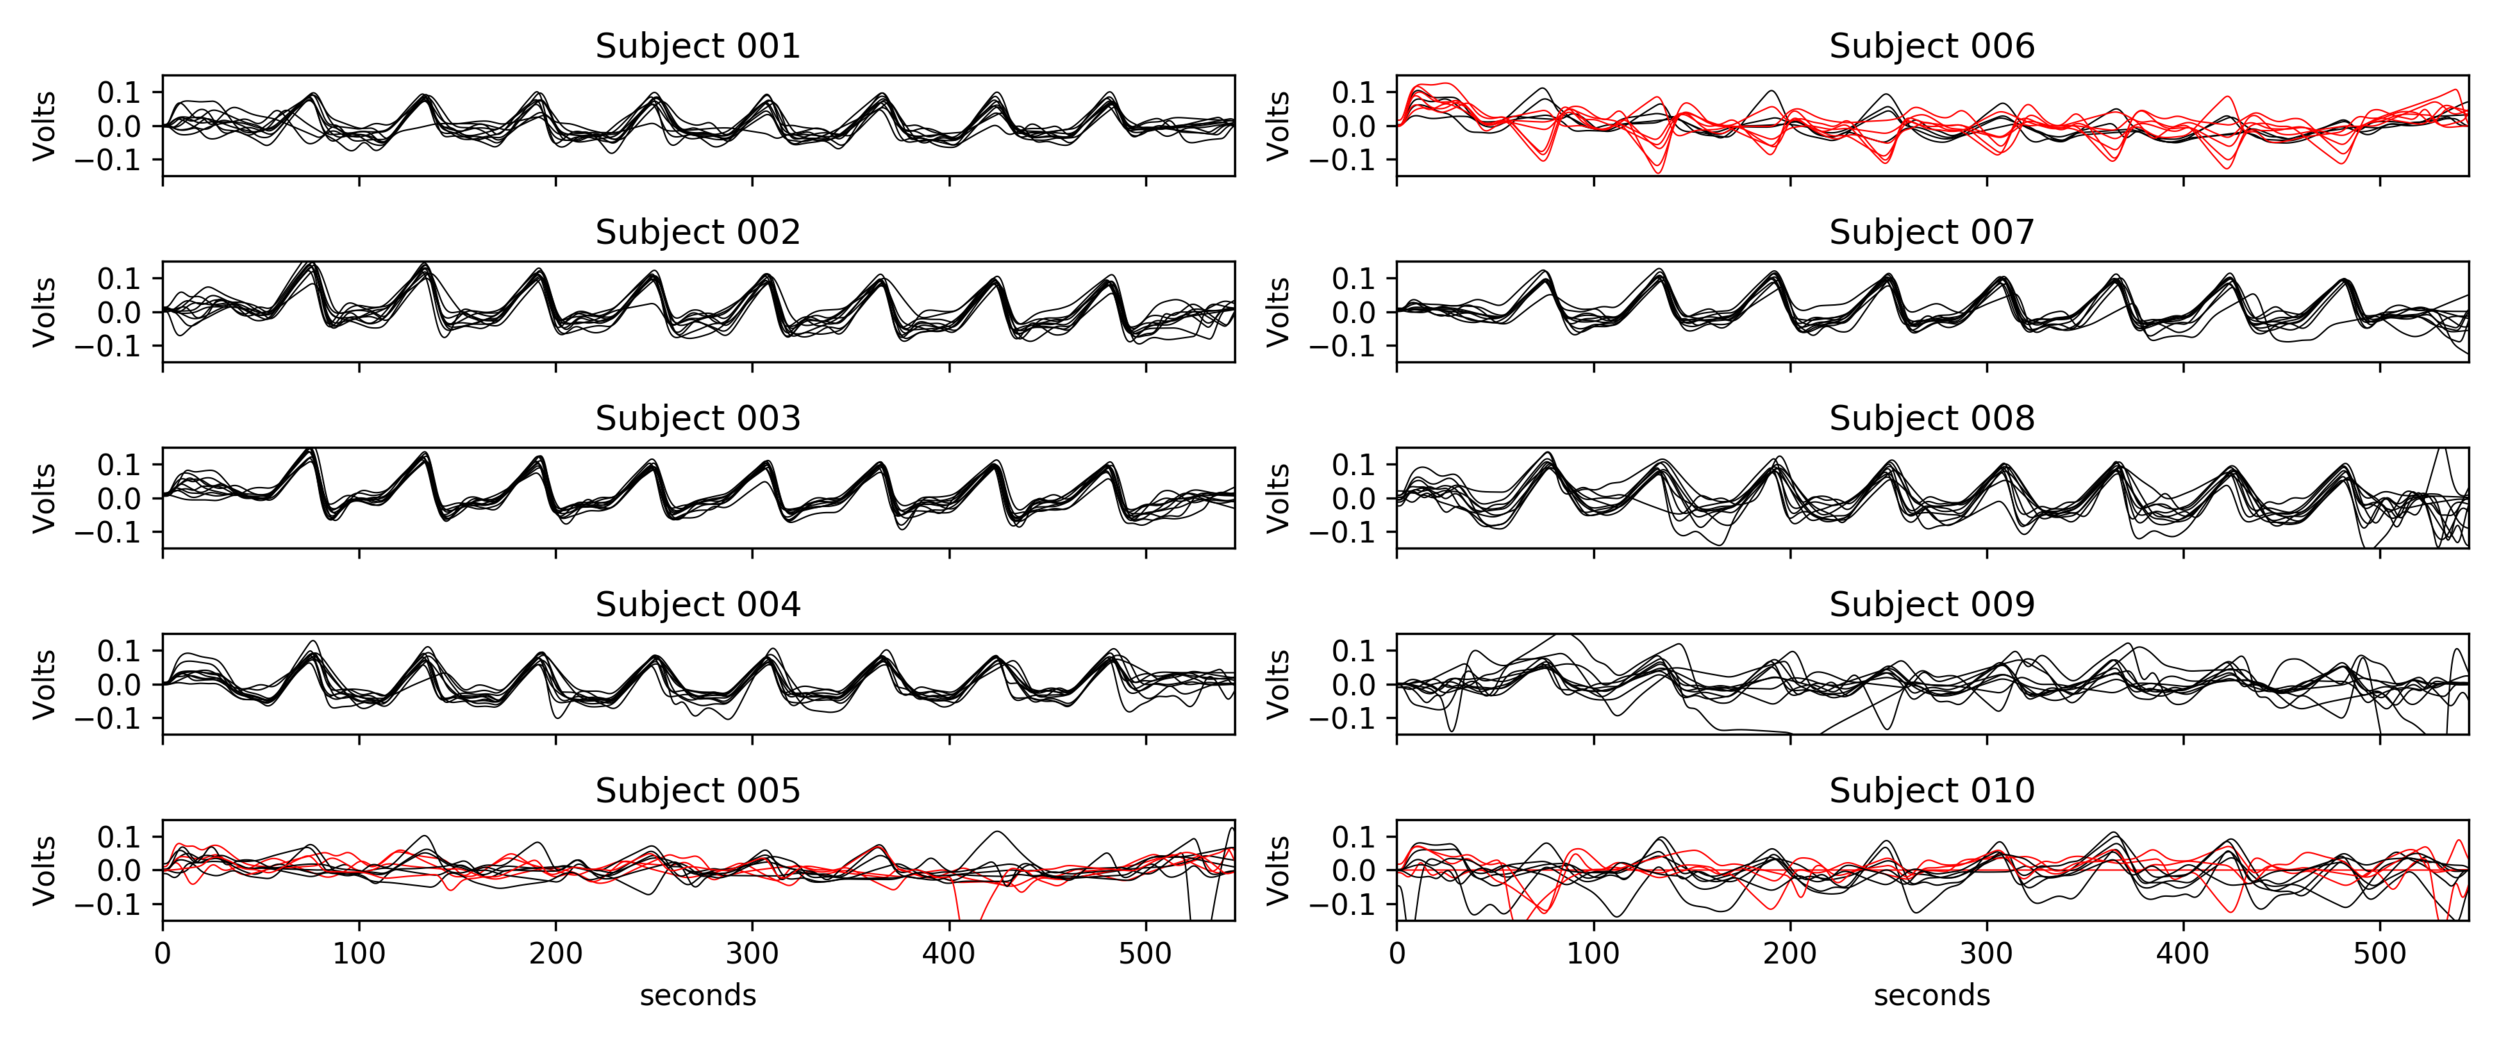
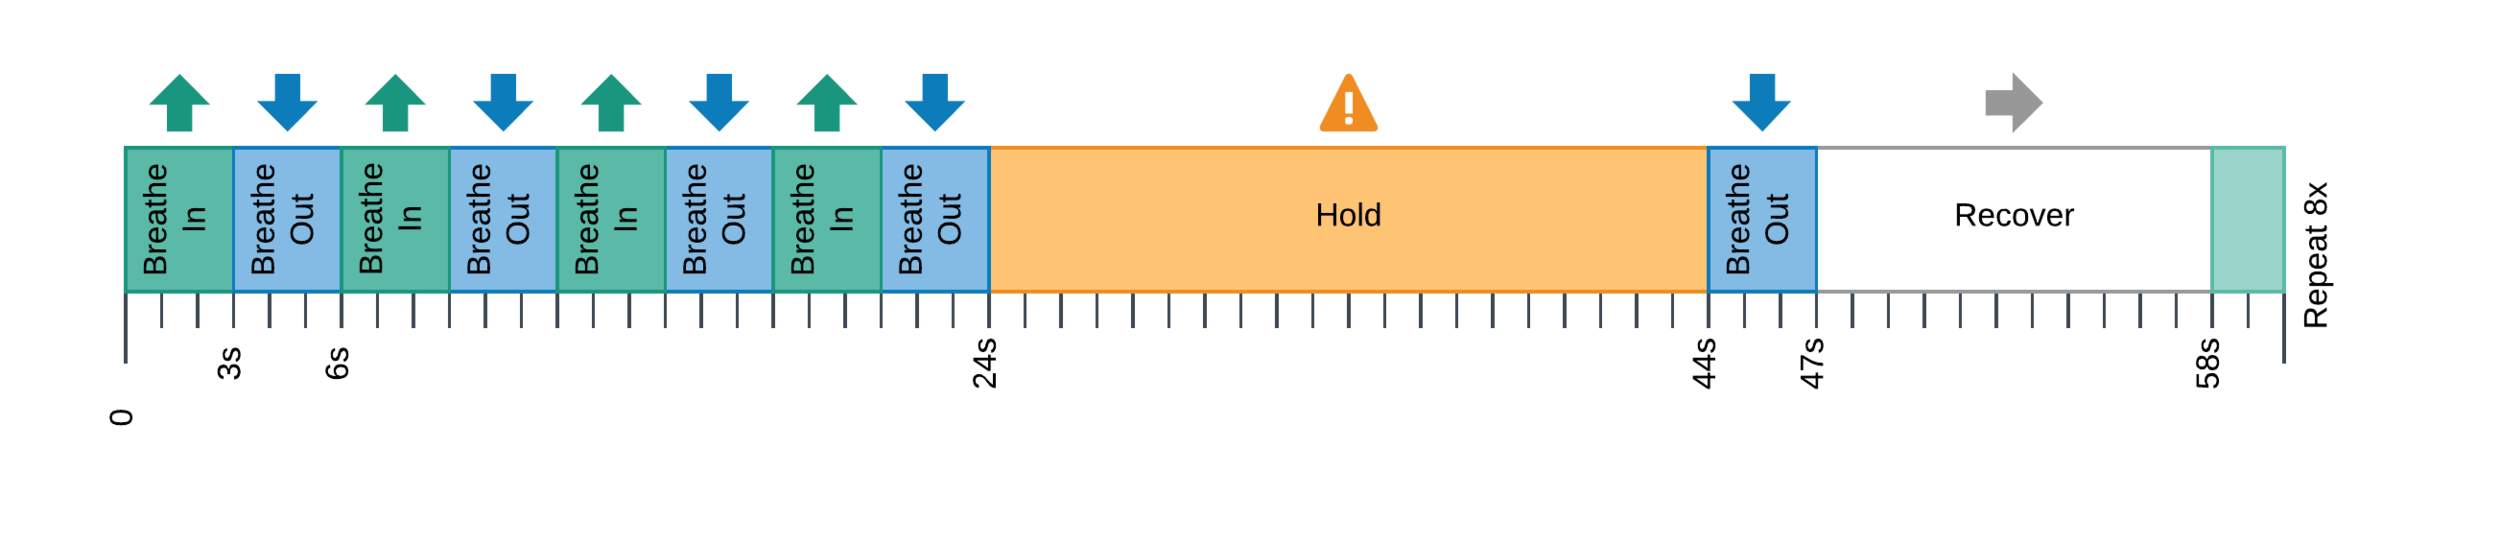
CVR can be measured during BOLD fMRI experiments with Breath-holds (BH), that induce the subject into a state of hypercapnia²
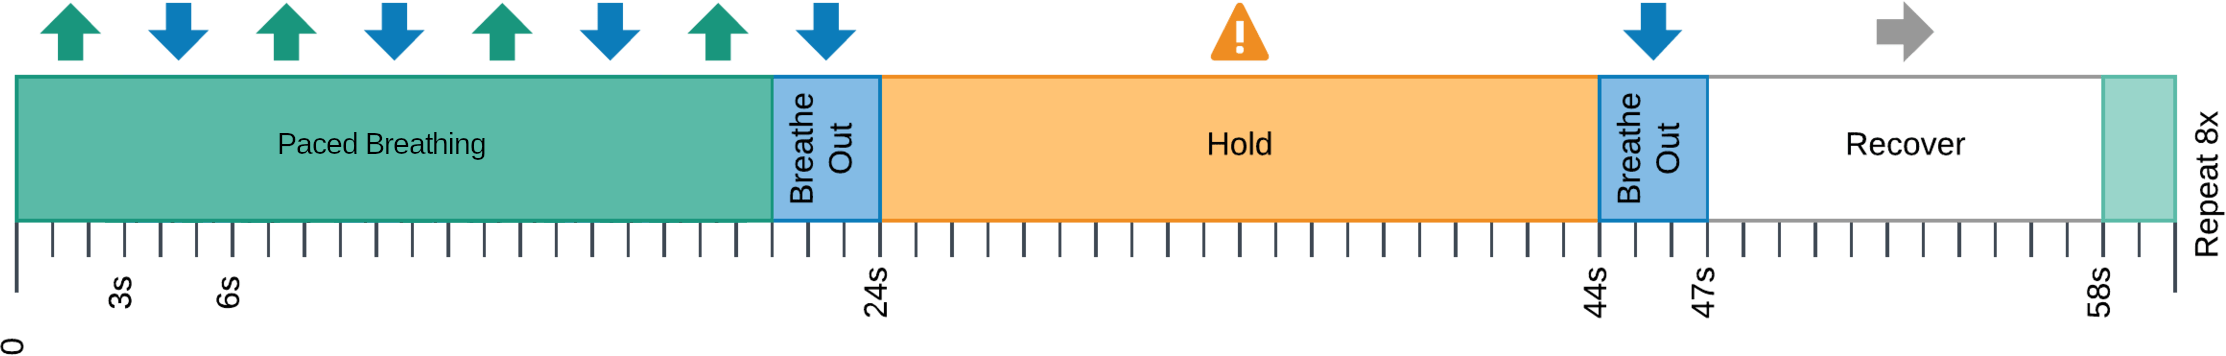
This is not the golden standard method, but it is an affordable one.
Improving CVR quality
BH-induced CVR: Issues
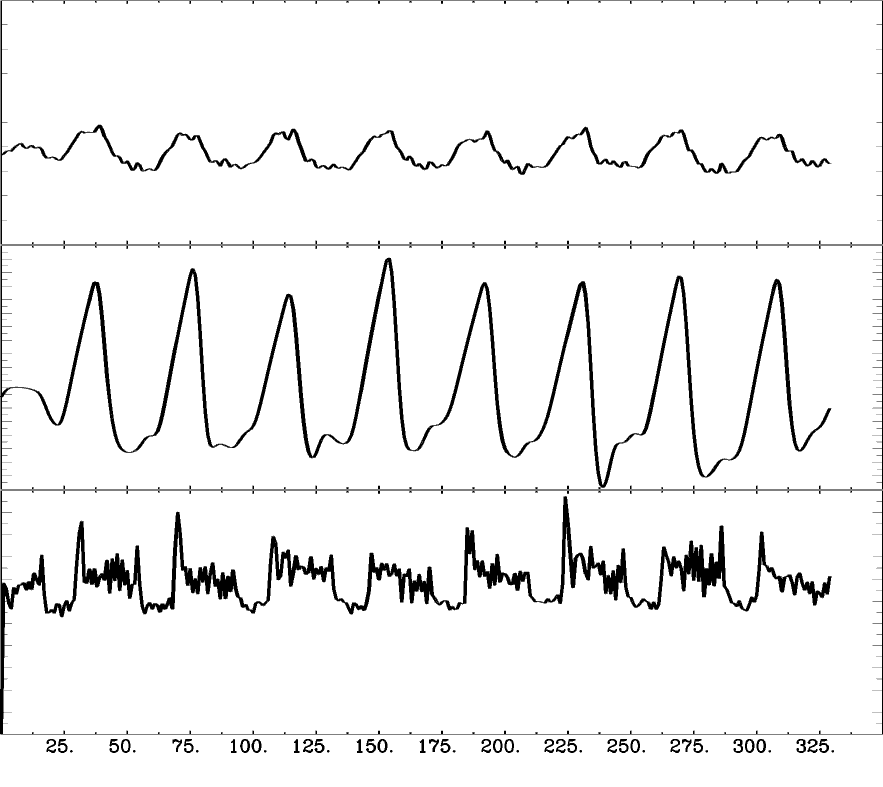
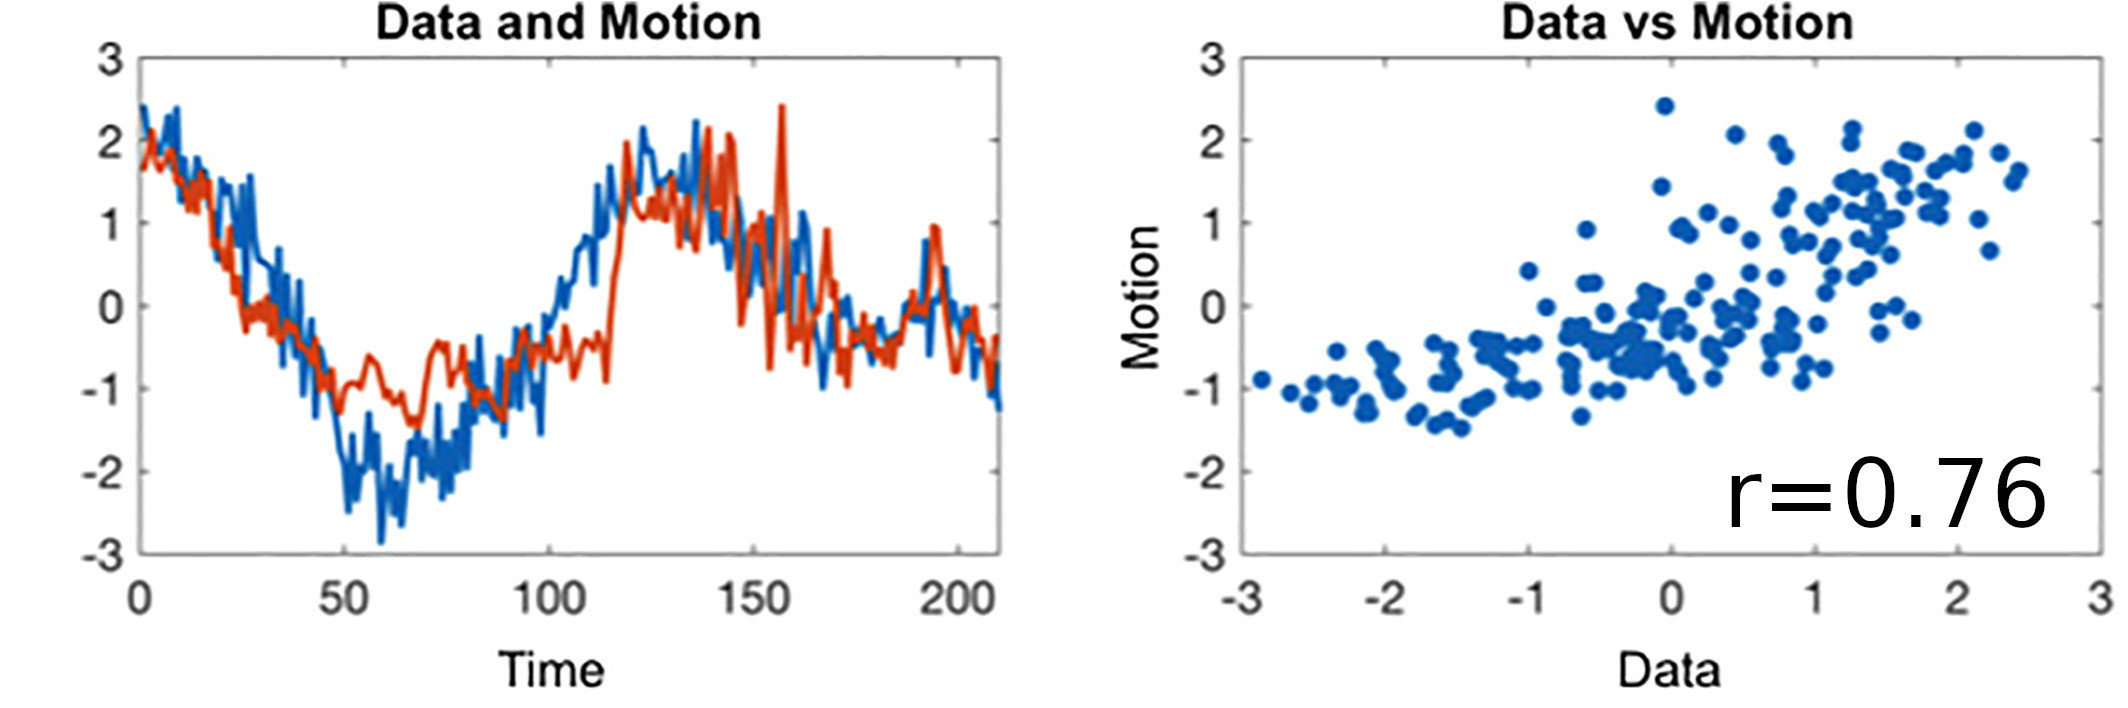
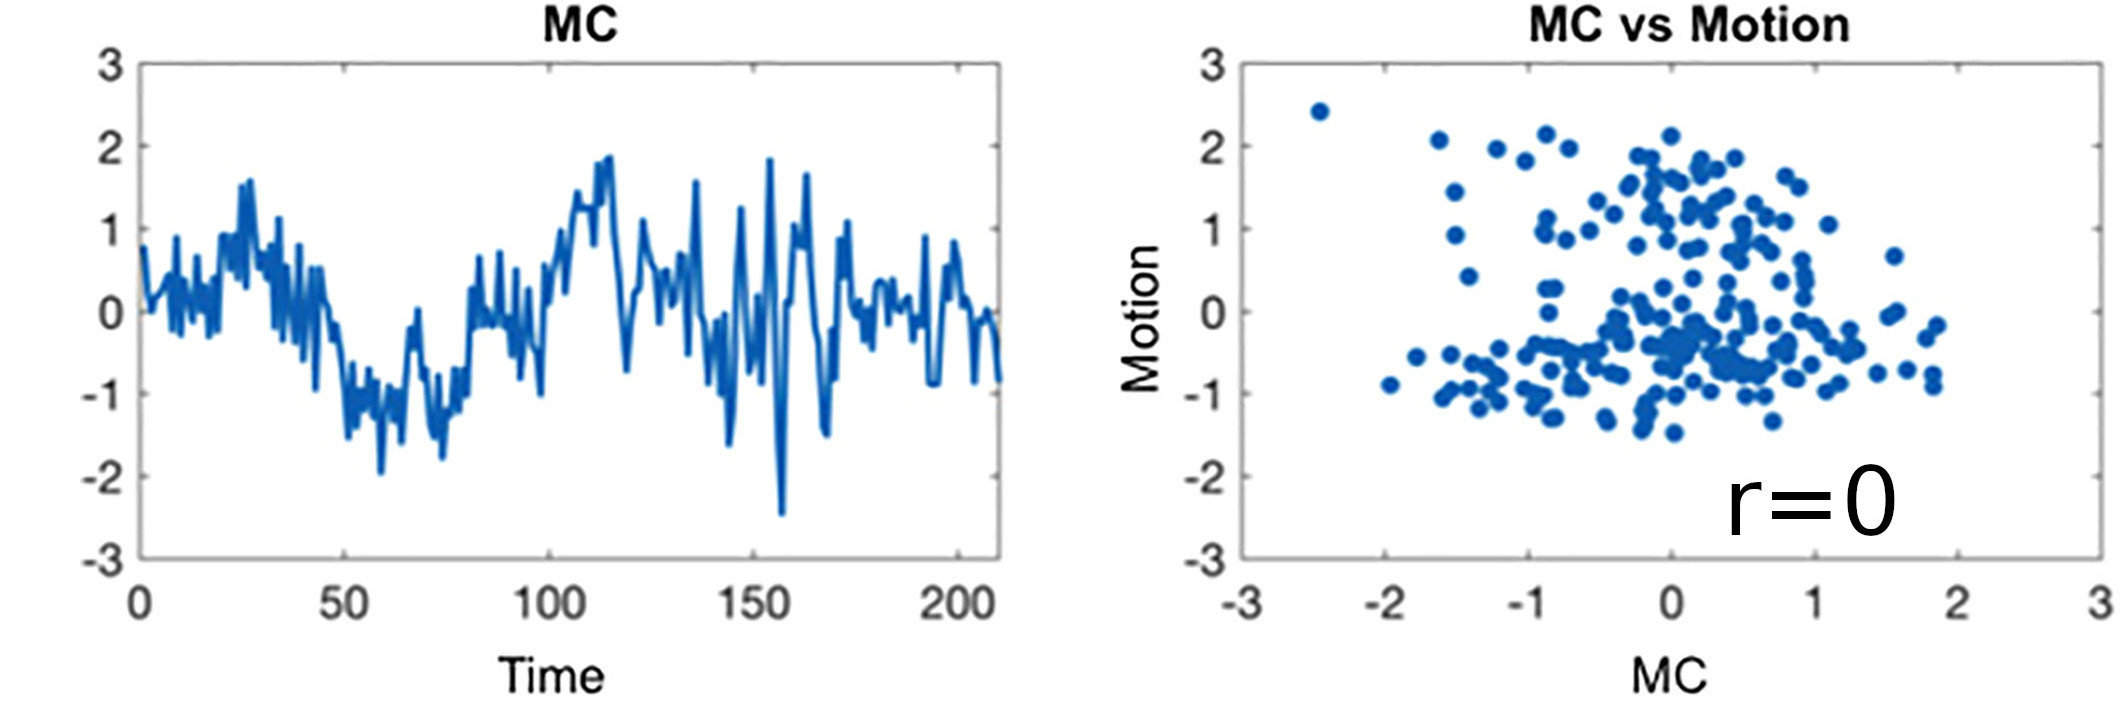
Motion
CO2
BOLD
Lagged responses
Collinear motion
Subject compliance
1. Frederick et al. 2012 (NeuroImage); 2. Sousa et al. 2014 (Neuroimage)
CVR estimates optimisation
Different methods have been proposed to take into account the lagged CVR:
- RIPTiDe: cross-correlation (X-corr)¹
- Lagged GLM after orthogonalising signal of interest to noise²
Lag optimisation
Different methods have been proposed to take into account the lag of CVR:
cross-correlation (RIPTiDe)¹,
Lagged GLM (L-GLM)²,
bayesian estimation³, ...
1. Frederick et al. 2012 (NeuroImage); 2. Sousa et al. 2014 (NeuroImage)
3. https://github.com/physimals/quantiphyse-cvr; 4. Moia, Stickland, et al. 2020 (EMBC)
→
→
→
→
→
→
→
→
An important factor to take into account is to set up denoising and CVR estimation simultaneously⁴
[Moia, Stickland, et al. 2020 (EMBC)]

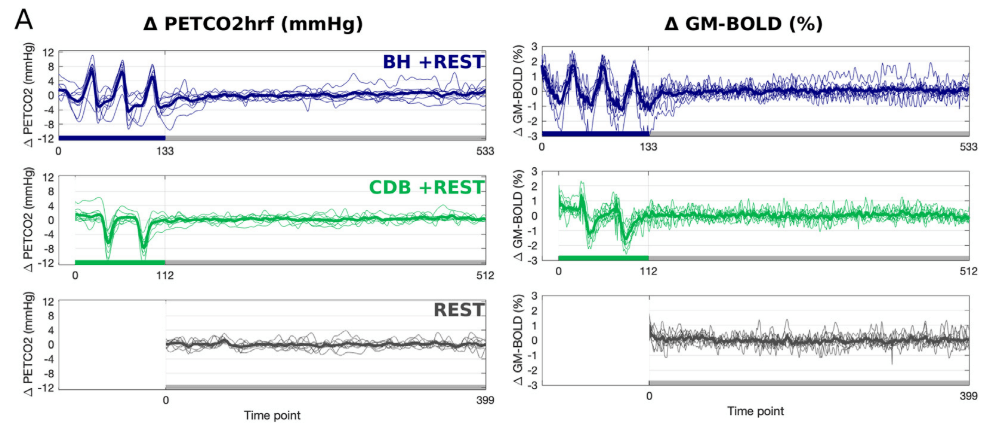
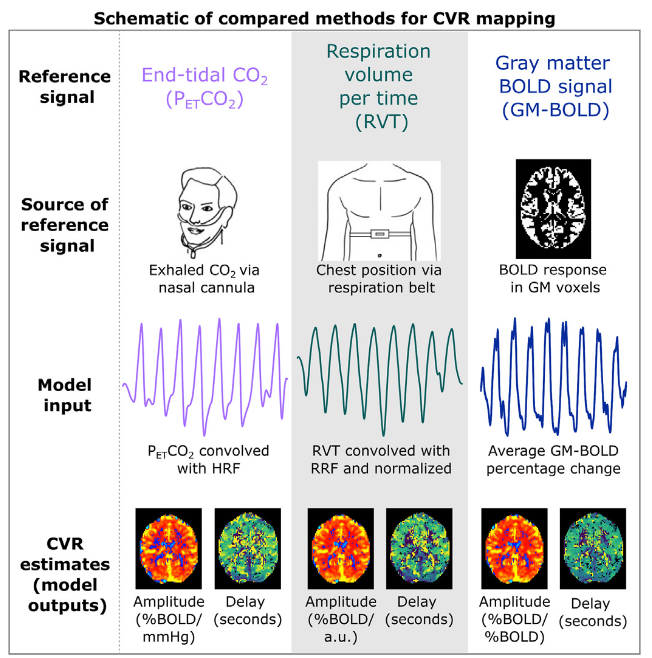
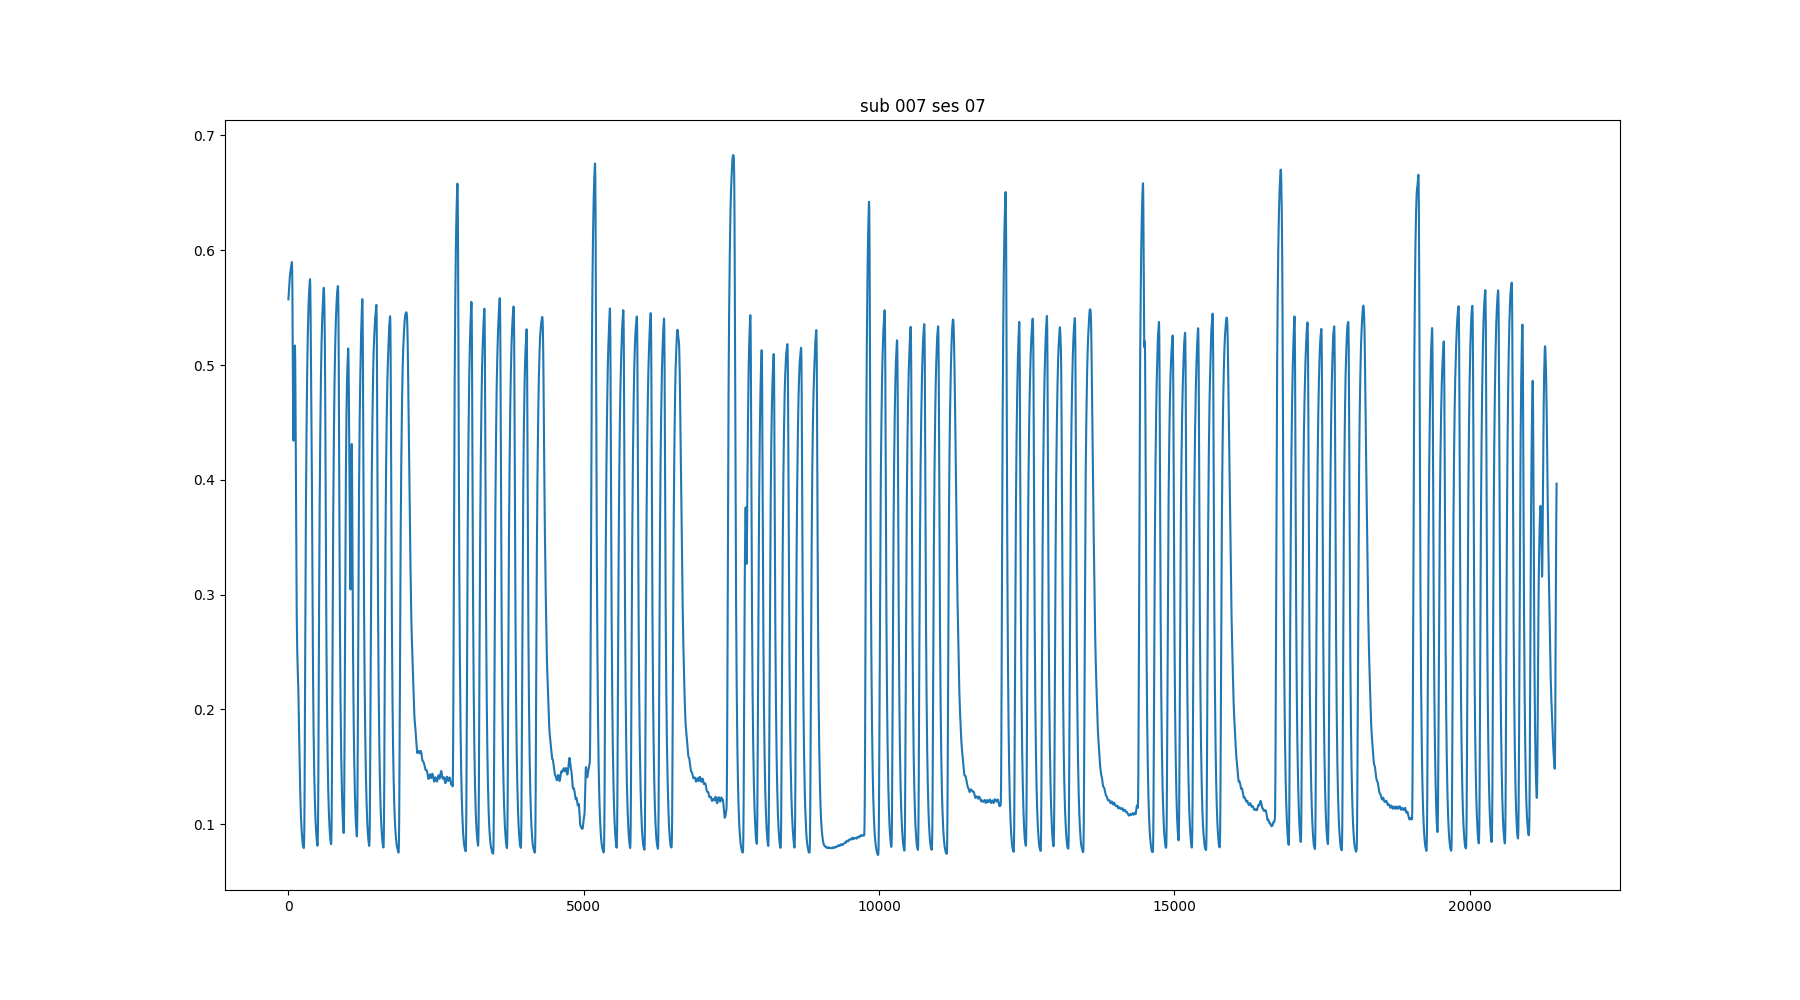
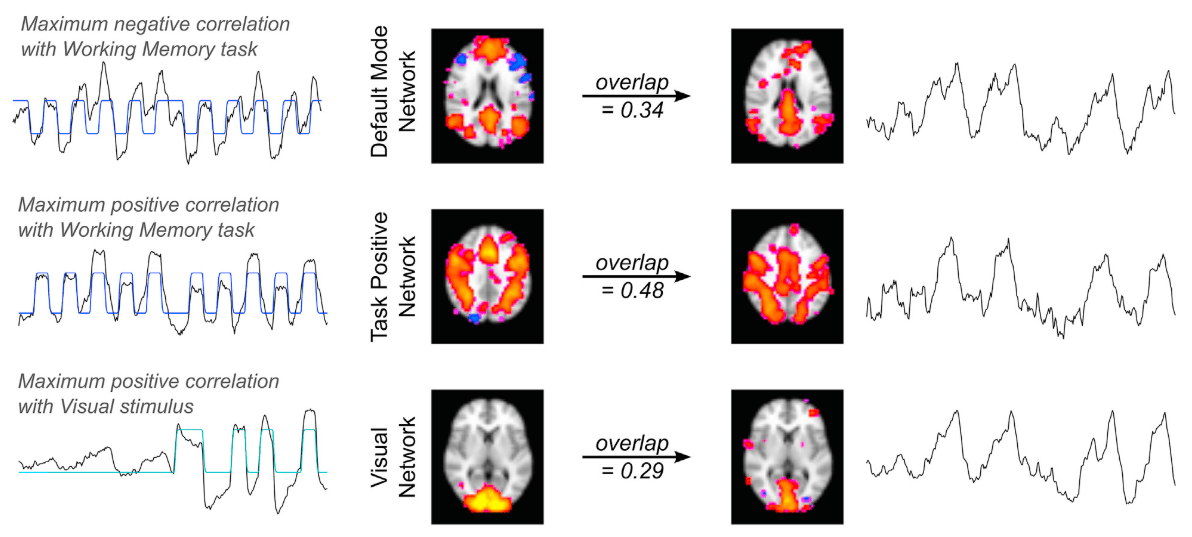
Methods: Analysis
- Peaks detection in exhaled CO2 traces
- Amplitude envelope (PETCO2) convolved with HRF
- Find max correlation of PETCO2 and average GM
- PETCO2 signal shifted between -9 and +9 sec
- Shifted regressors interpolated at the TR
- Compute GLM with each lagged regressor and nuisance regression (12 motion parameters and low frequency trends)
- For each voxel, select the lagged model with highest explained variance (R²)
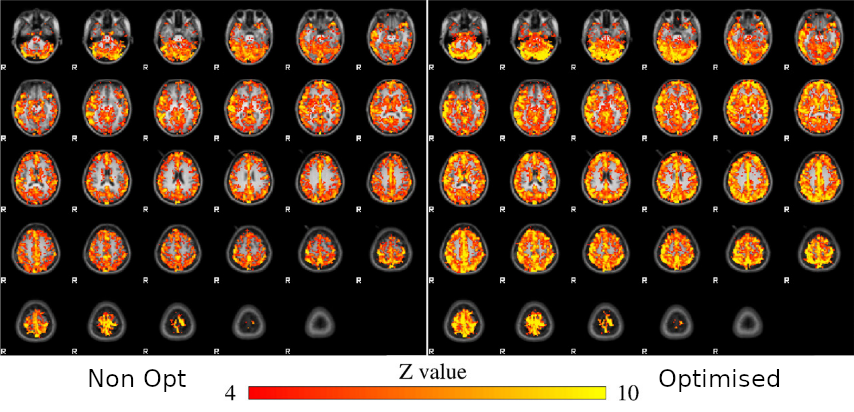
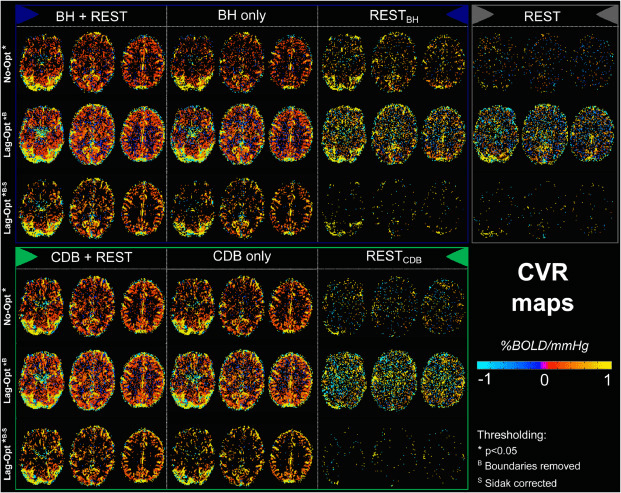
For comparison:
- Computed non-optimised CVR map (measurement delay)
- Computed GLM with each regressor, without motion parameters
- Computed GLM with each regressor, after motion was regressed out
↓
optimised CVR map and lag map
Lag optimisation
1. Frederick et al. 2012 (Neuroimage), Sousa et al. 2014 (Neuroimage), Bayes et al., 2024 (biorXiv)
2. Moia, Stickland, et al. 2020 (EMBC), Moia et al. 2021 (Neuroimage)
→
→
→
→
→
→
→
→
Adopting a lagged GLM, maximising the R² of models including both signal of interest
and known noise, improves BH-based CVR estimation¹..
Subject compliance
1. Stickland et al., 2021 (NeuroImage); 2. Zvolanek et al., 2023 (Neuroimage)
- Short respiratory challenges¹
- Alternative estimates²
Easy additions!
Subject compliance
1. Stickland et al., 2021 (NeuroImage); 2. Zvolanek et al., 2023 (Neuroimage)
- Short respiratory challenges¹
- Alternative estimates²
Take home #1
Adding two Deep Breaths or Breath Holds before/after your task is an easy way
to estimate Cerebrovascular Reactivity
Solving the motion issue
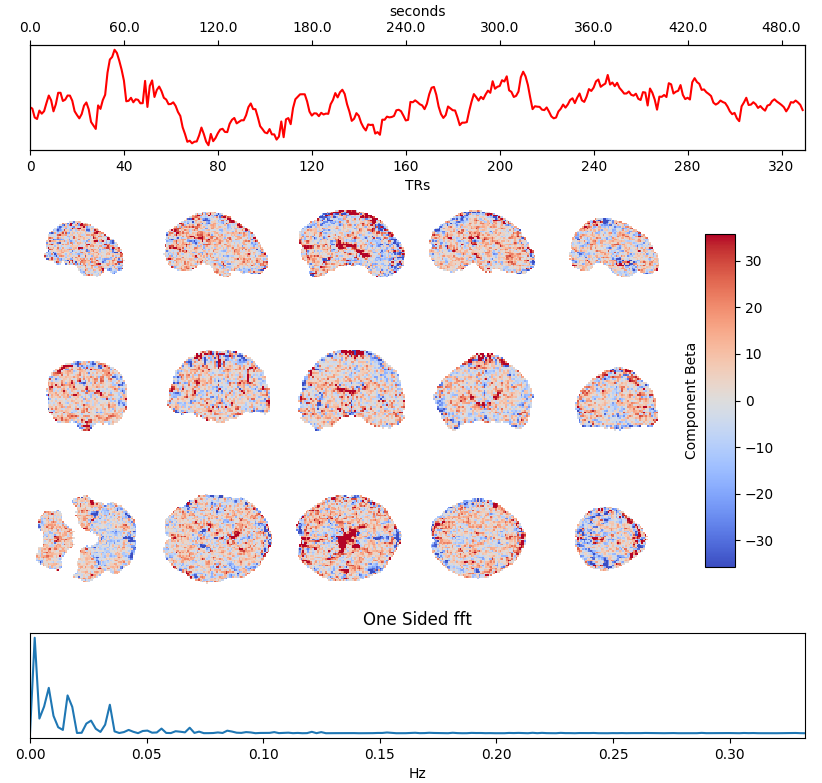
"Advanced" modelling: ICA denoising
Independent Component Analysis (ICA) is commonly used to remove motion effects and other sources of noise from fMRI data
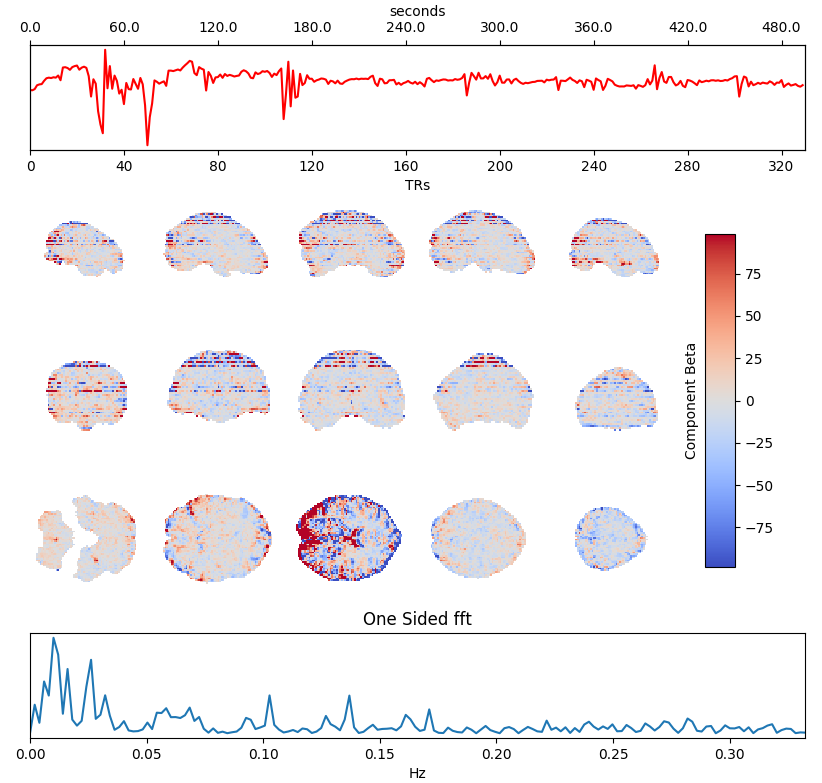
Motion + MB artefact
CSF pulsations
Griffanti et al. 2014 (NeuroImage), 2017 (NeuroImage), The tedana Community et al. 2021 (Zenodo)
Timeseries →
Spatial maps →
Power spectrum →
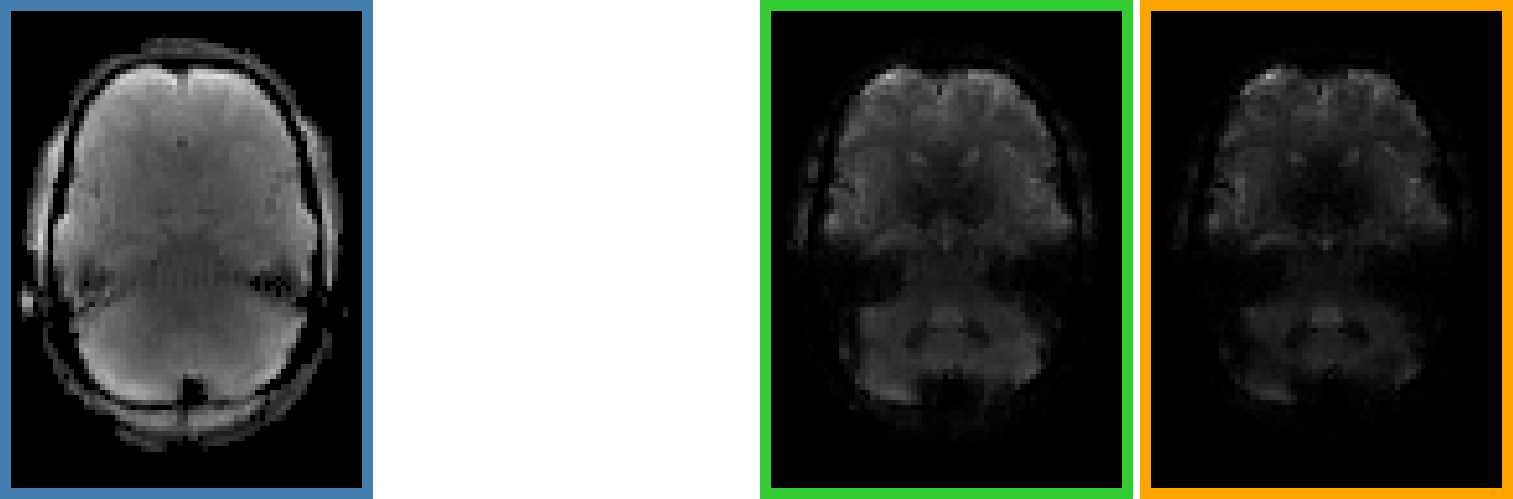
Advanced data acquisition: Multi-Echo (ME-fMRI)
- Single Echo (SE): during fMRI acquisition we collect the signal once per TR at a certain TE to obtain one timeseries per voxel
-
Multi-Echo (ME): we collect the signal multiple times at different TEs to obtain n timeseries per voxel


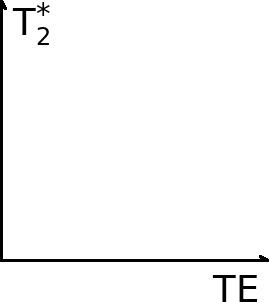
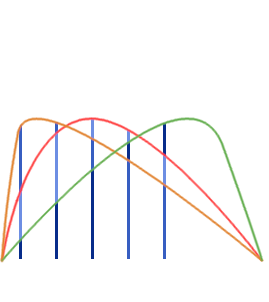
BOLD [a.u.]
Text
TR
TE
~ BOLD
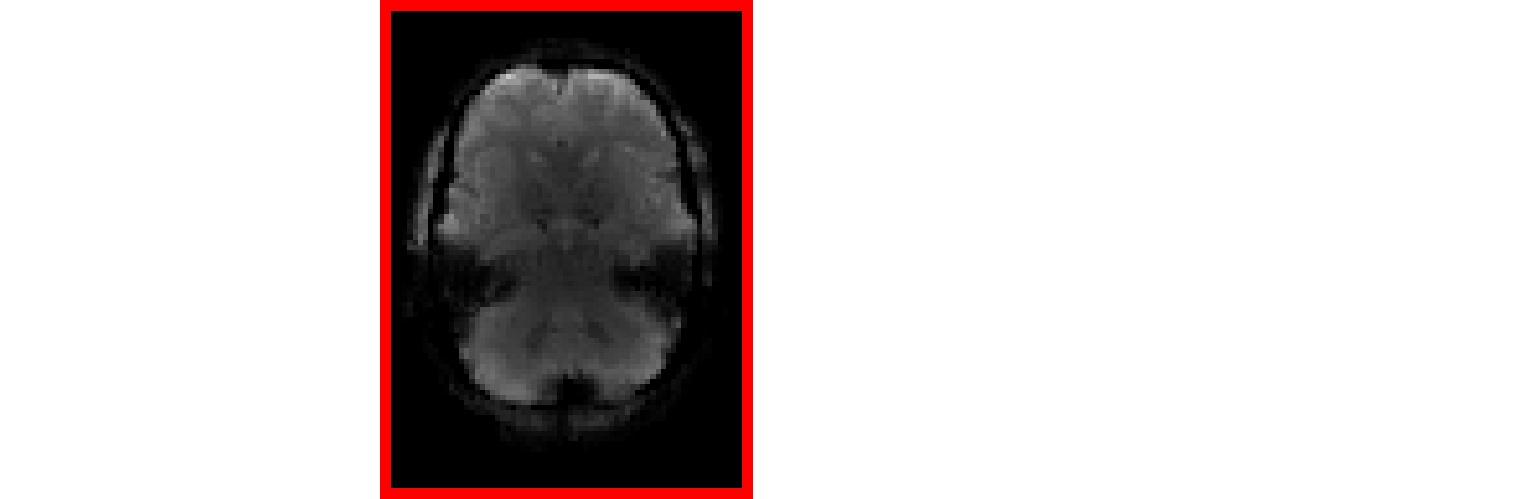
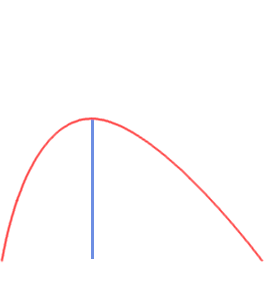
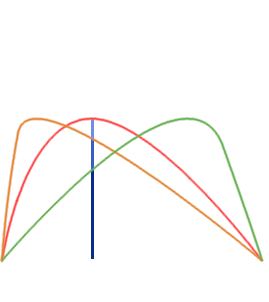
Multi-Echo improves contrast and tSNR
For each voxel and TR, we can Optimally Combine the echo volumes with a weighted sum based on their contribution to \( T_2^{\star} \)
In this way, spatial CNR and tSNR are maximised and the signal can be recovered in areas of drop-out
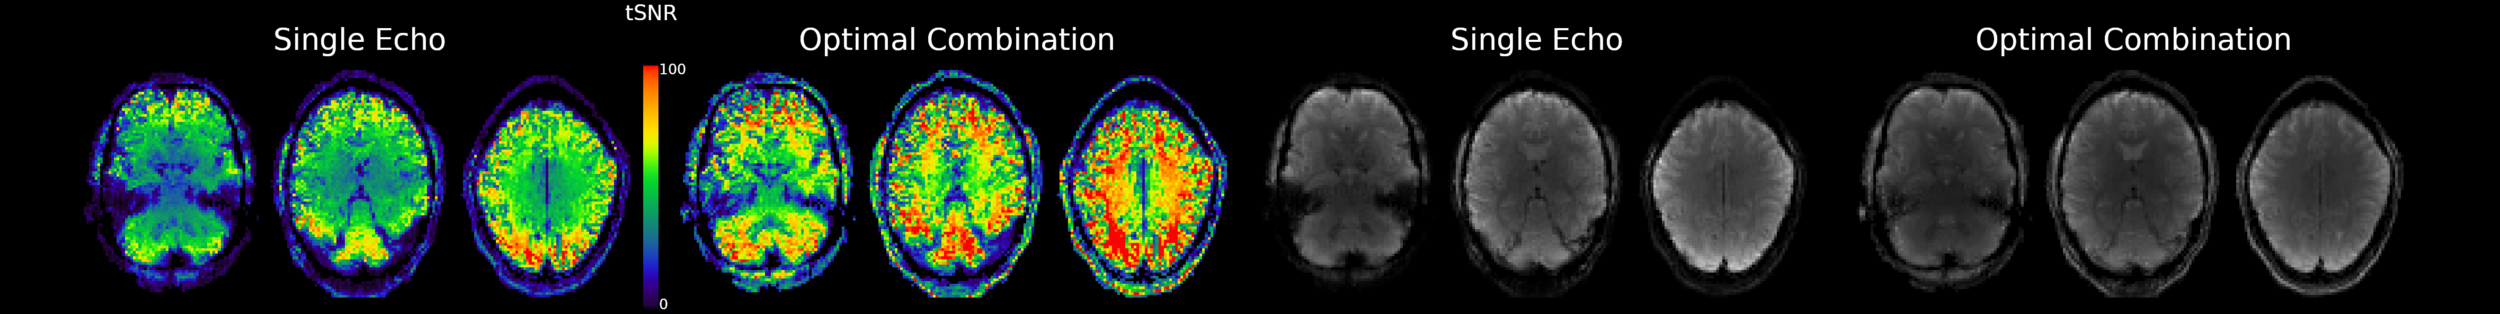
Posse et al. 1999 (Magn Reson Med), Poser et al., 2006 (Magn Reson Med)
Merging Multi-Echo and ICA denoising: tedana

DuPre et al., 2021 (JOSS)
ME-ICA
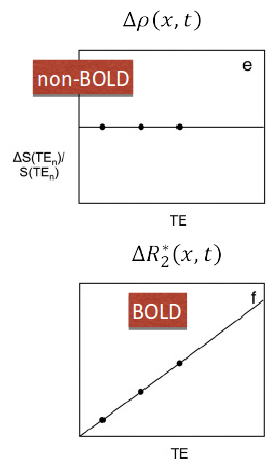
Assuming monoexponential decay, we can express the
signal percentage change as:
\[ S_{SPC} \approx \Delta\rho - TE \cdot \Delta R_2^{\star} + n \quad where \enspace R_2^{\star} = \frac{1}{T_2^{\star}} \]
This let us differentiate BOLD-related (\(\Delta R_2^{\star}\)) from non-BOLD related (\(\Delta\rho\)) changes
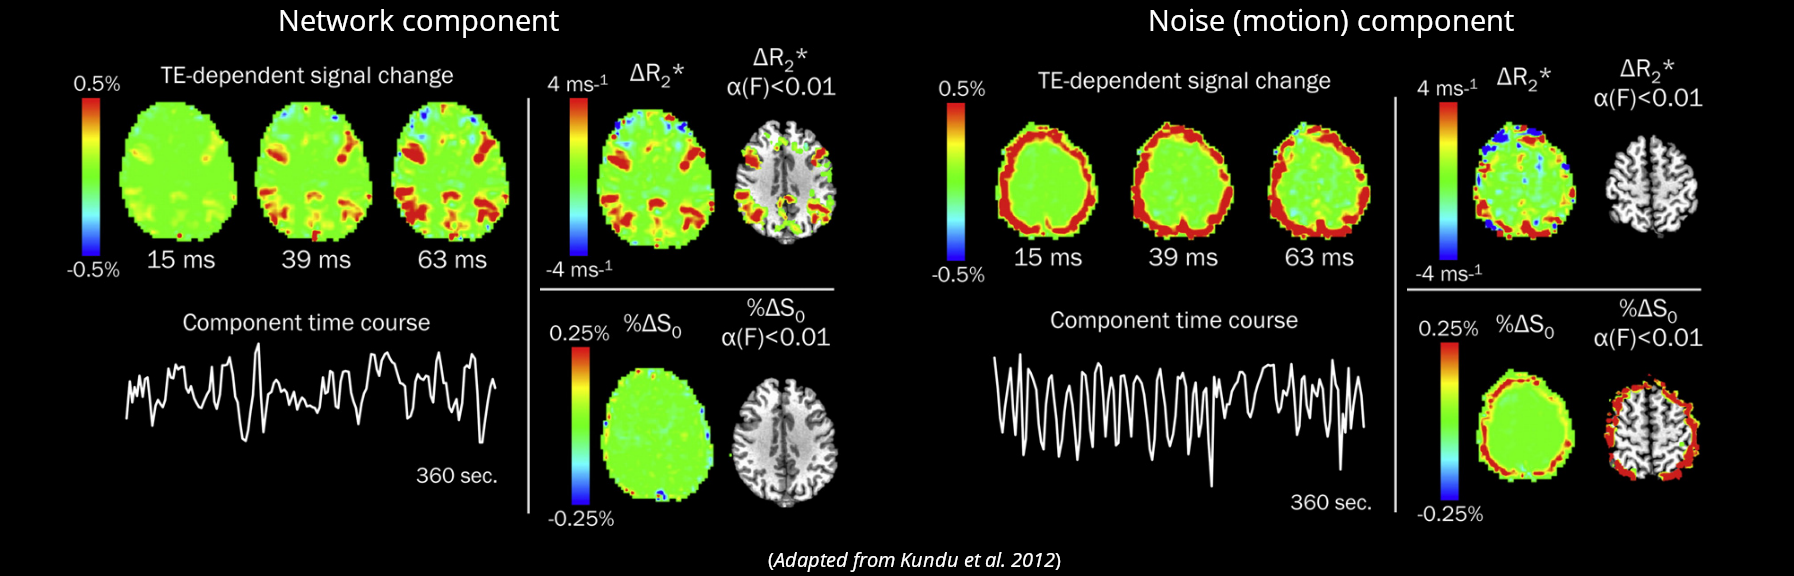
Kundu et al. 2012 (NeuroImage)
If we apply ICA, we can fit the timeseries of the components to either sub-models and automatically classify them
Multi-Echo & ICA based denoising
Reddy et al., 2024 (Imaging Neuroscience)
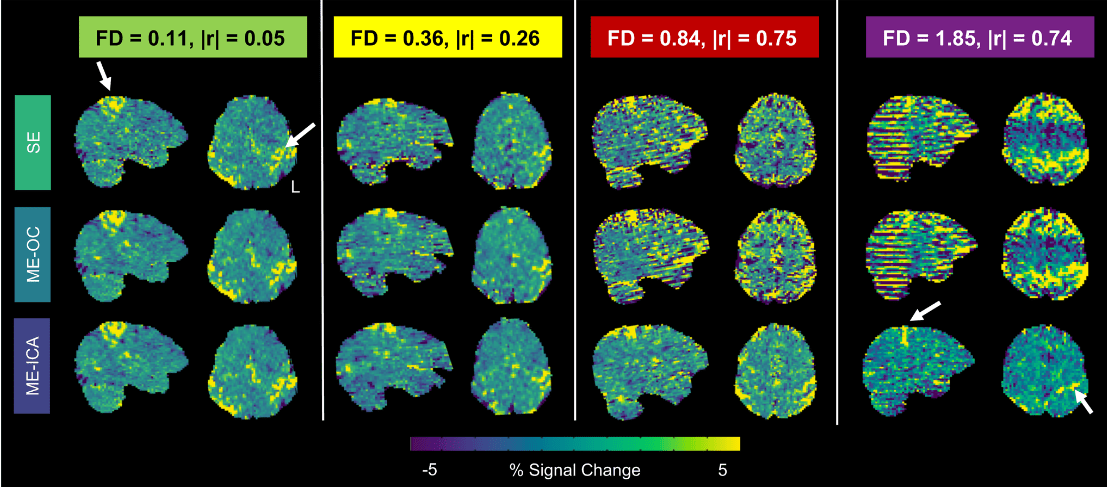
Increasing Motion
Single Echo →
Multi-Echo →
Multi-Echo & ICA →
Take home #2
Multi-Echo fMRI joint with denoising based on Independent Component Analysis can greatly reduce the impact of motion and other artefacts in your data
(Caveat: better at high fields than at ultra-high fields)
Which ICA denoising?
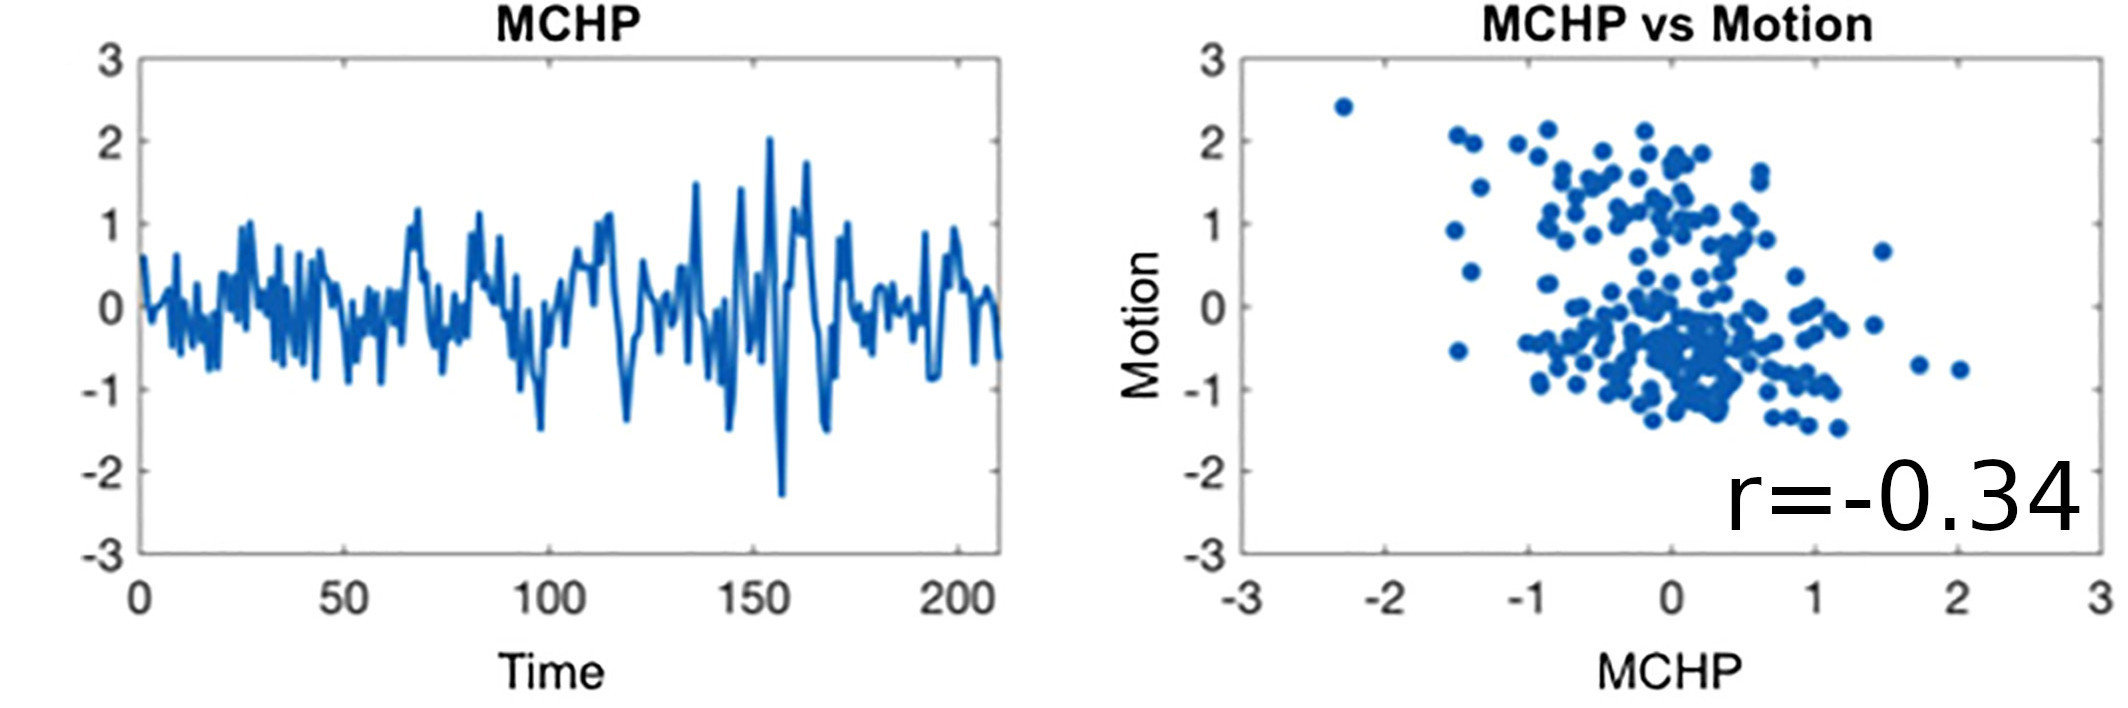
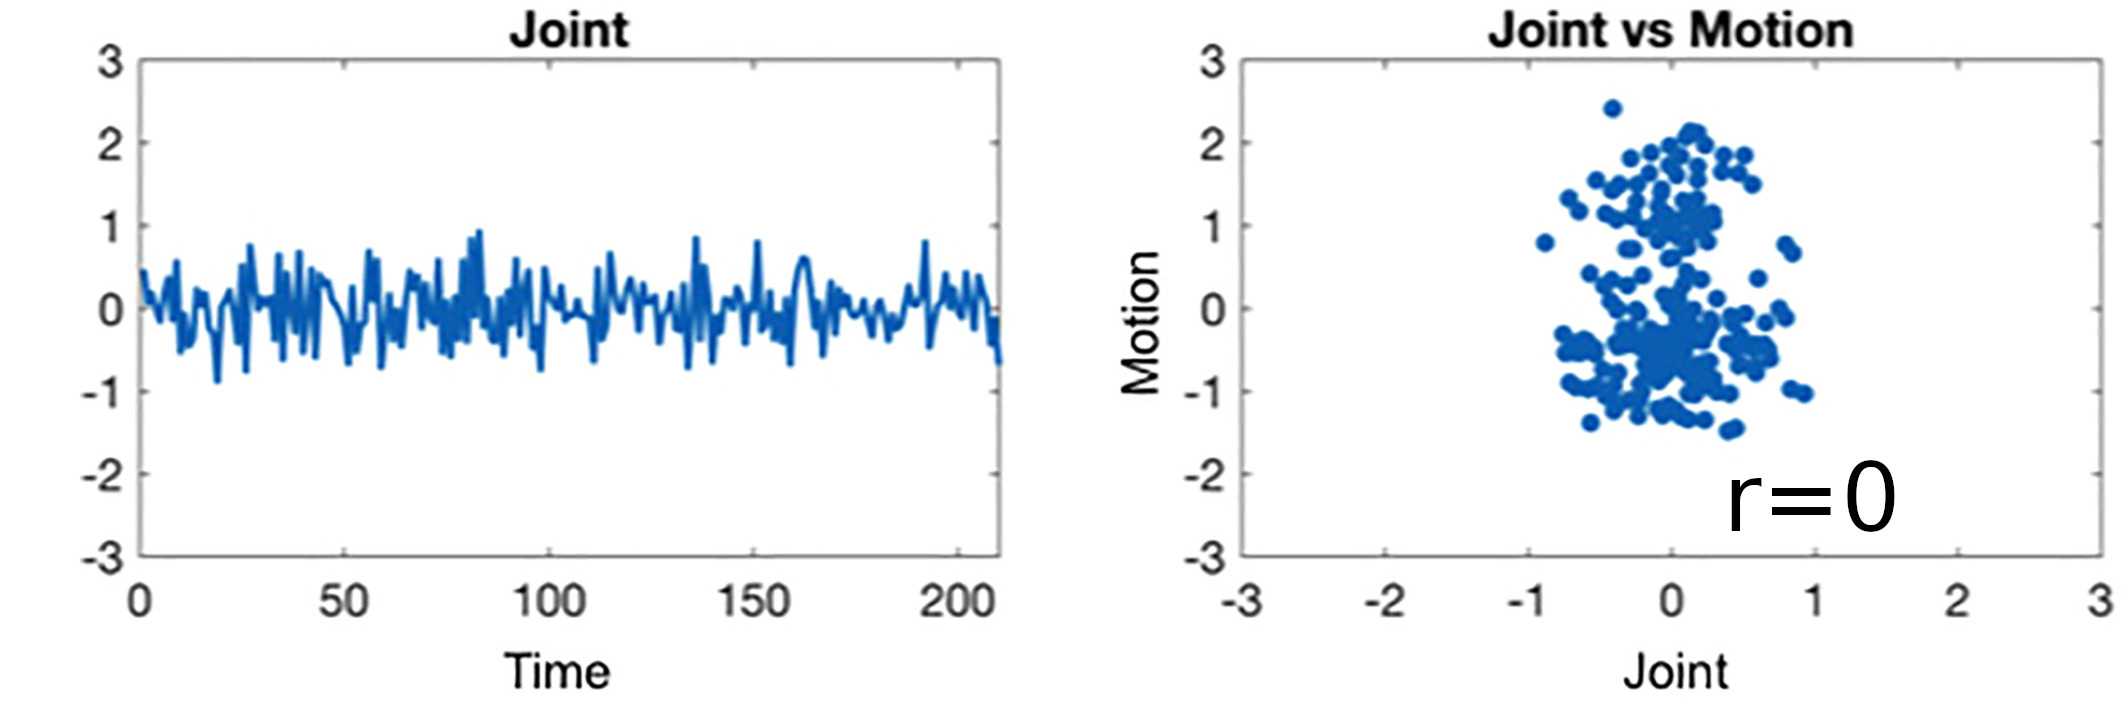
What is the best way to denoise BH data after ICA?
Being too aggressive might remove the signal of interest,
but being too conservative might keep too much noise in the model.
We tested the best approach by controlling the variance removed by the independent components
Motion removal
Moia et al. 2021 (NeuroImage)
Raw
Single Echo
Multi-Echo
Aggressive ME-ICA
Moderate ME-ICA
Conservative ME-ICA
Motion
Sequential vs Simultaneous denoising
Performing denoising in sequential steps, rather than in parallel, might reintroduce removed artefacts
Lindquist et al. 2019 (Hum. Brain Mapp.)
Results: lag optimisation
| CNR of lag maps | SimMot | SeqMot | NoMot |
|---|---|---|---|
| GM-WM | 0.52 ±0.21 | 0.46 ±0.26 | 0.49 ±0.25 |
| GM-Putamen | 0.47 ±0.22 | 0.44 ±0.21 | 0.44 ±0.21 |
| GM-Cerebellum | 0.82 ±0.15 | 0.69 ±0.17* | 0.69 ±0.16* |
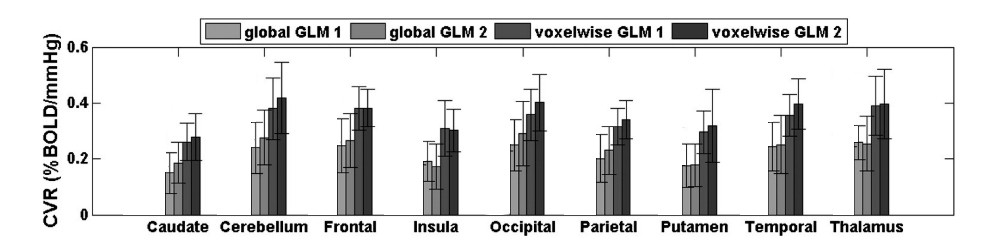
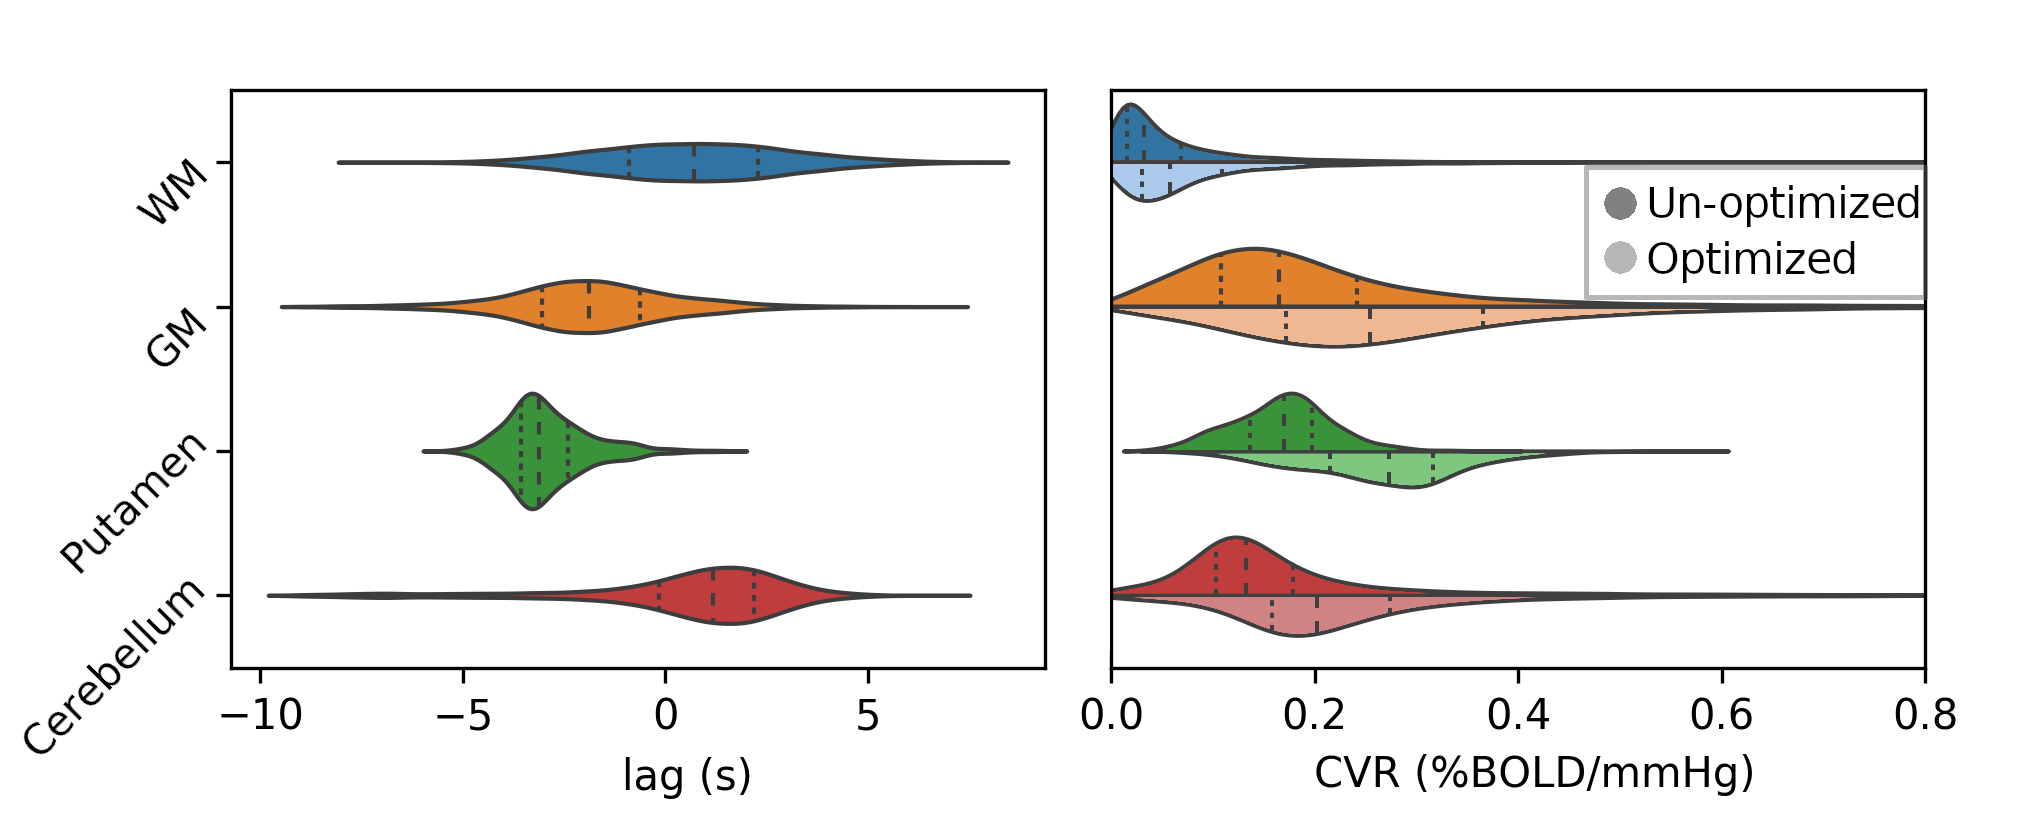
Non optimising leads to underestimate the CVR, especially in subcortical areas.
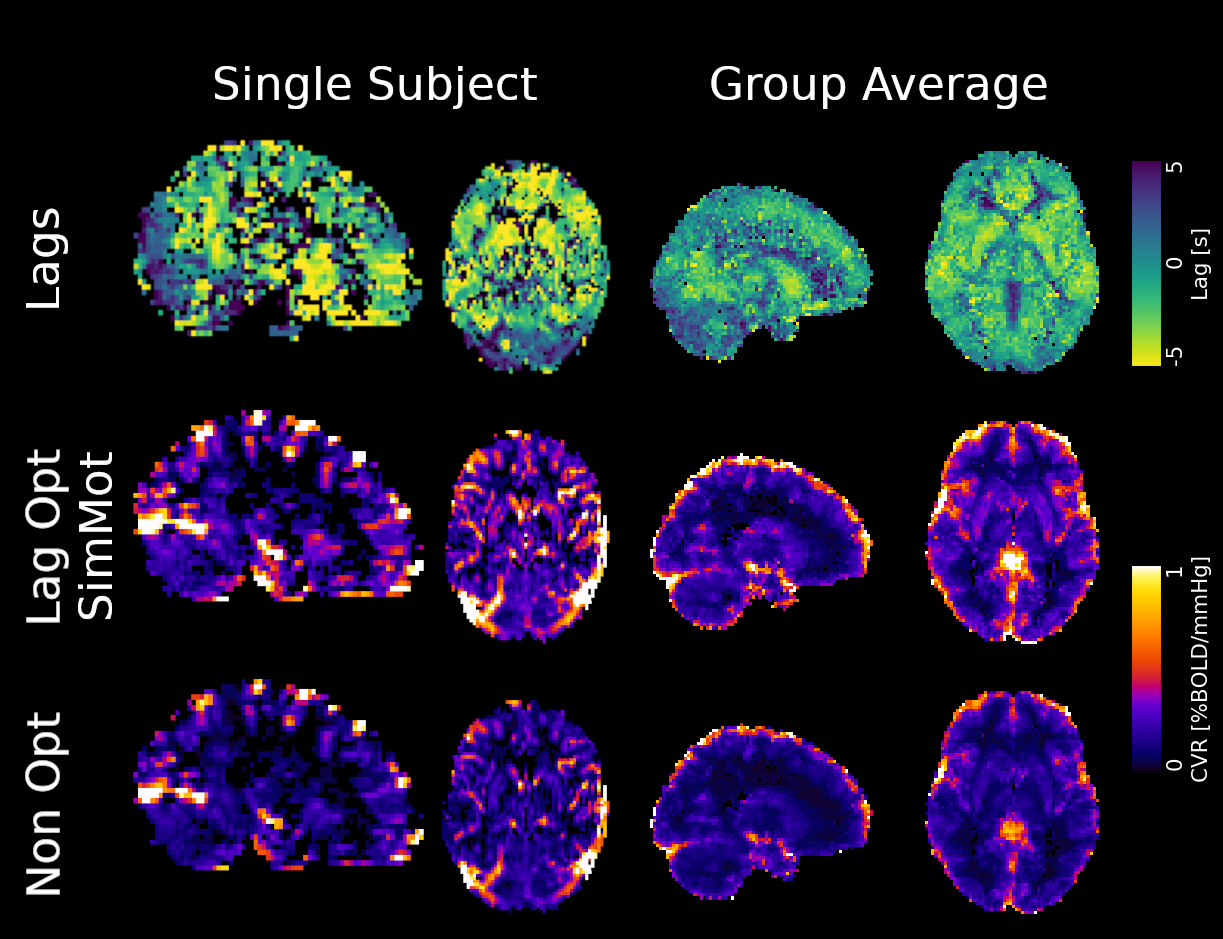
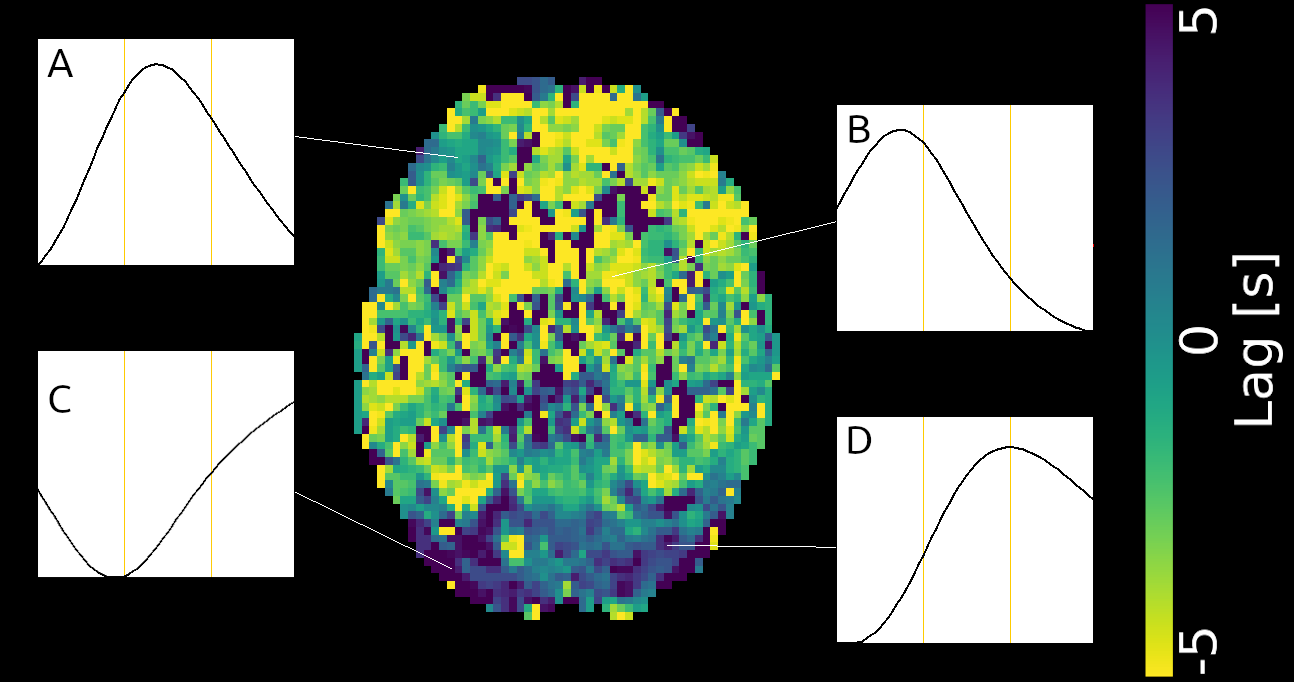
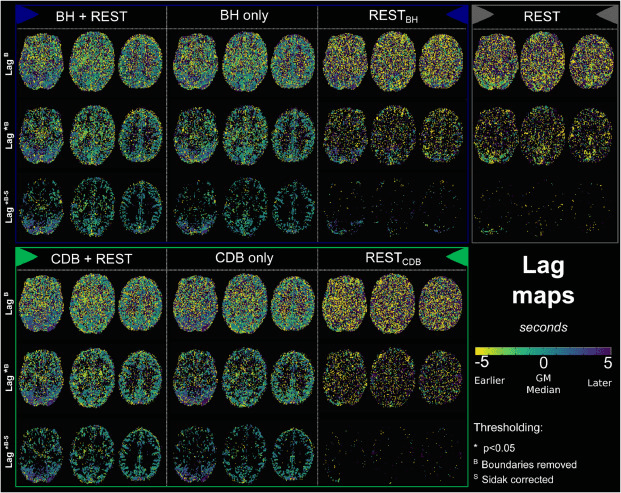
Lag maps show anatomical consistency
→
→
→
→
→
→
→
→
Different lag responses, coherent with previous evidence (e.g. Putamen has earlier response than GM)
Area mostly affected by motion! →
Moia, Stickland, et al. 2020 (EMBC)
CVR amplitude and lag estimation and reliability
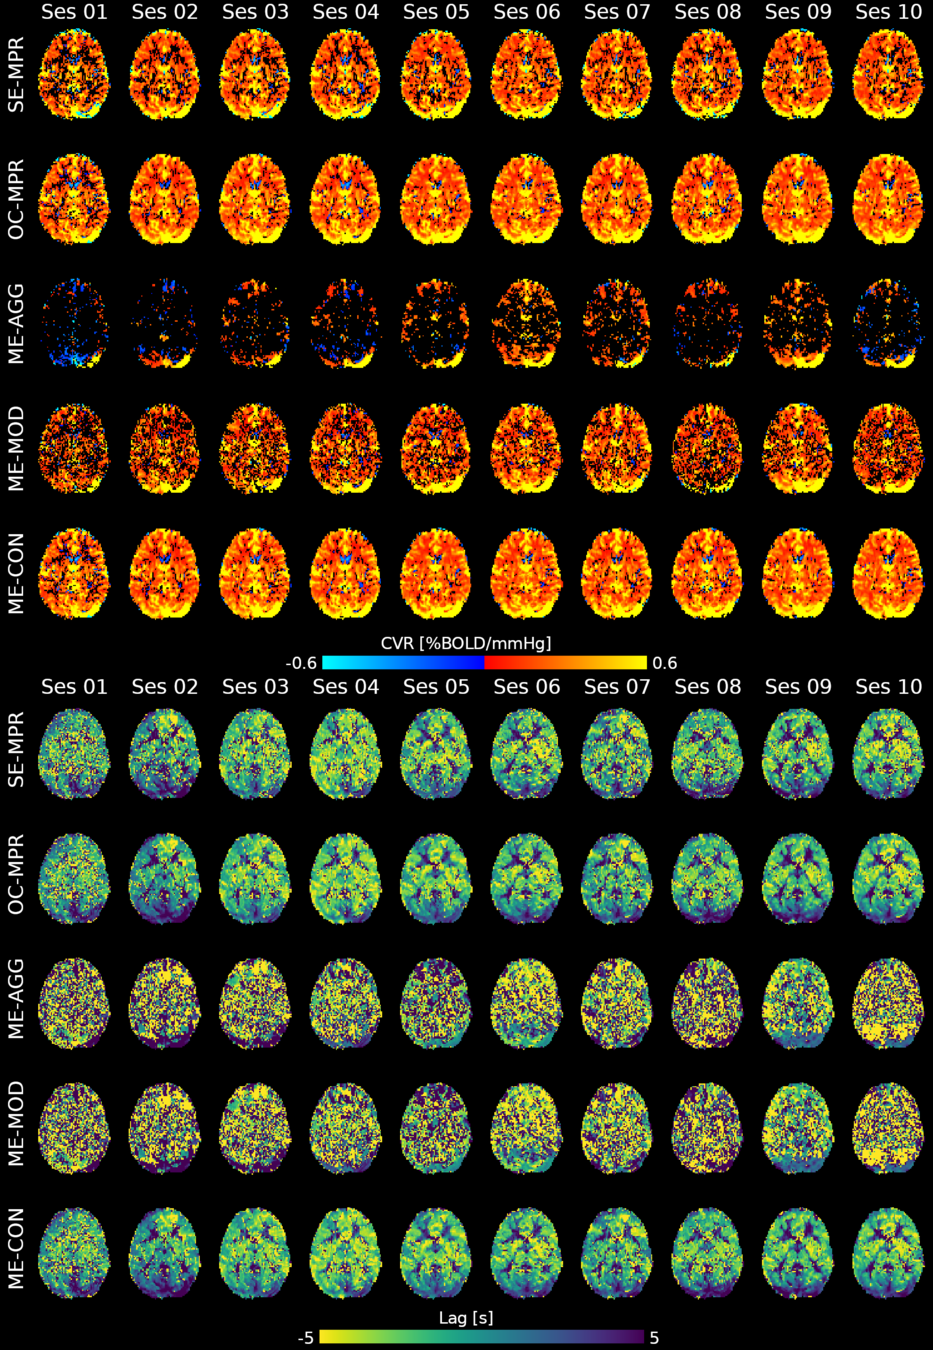
Moia et al. 2021 (NeuroImage)
CVR
Lag
CVR
Lag
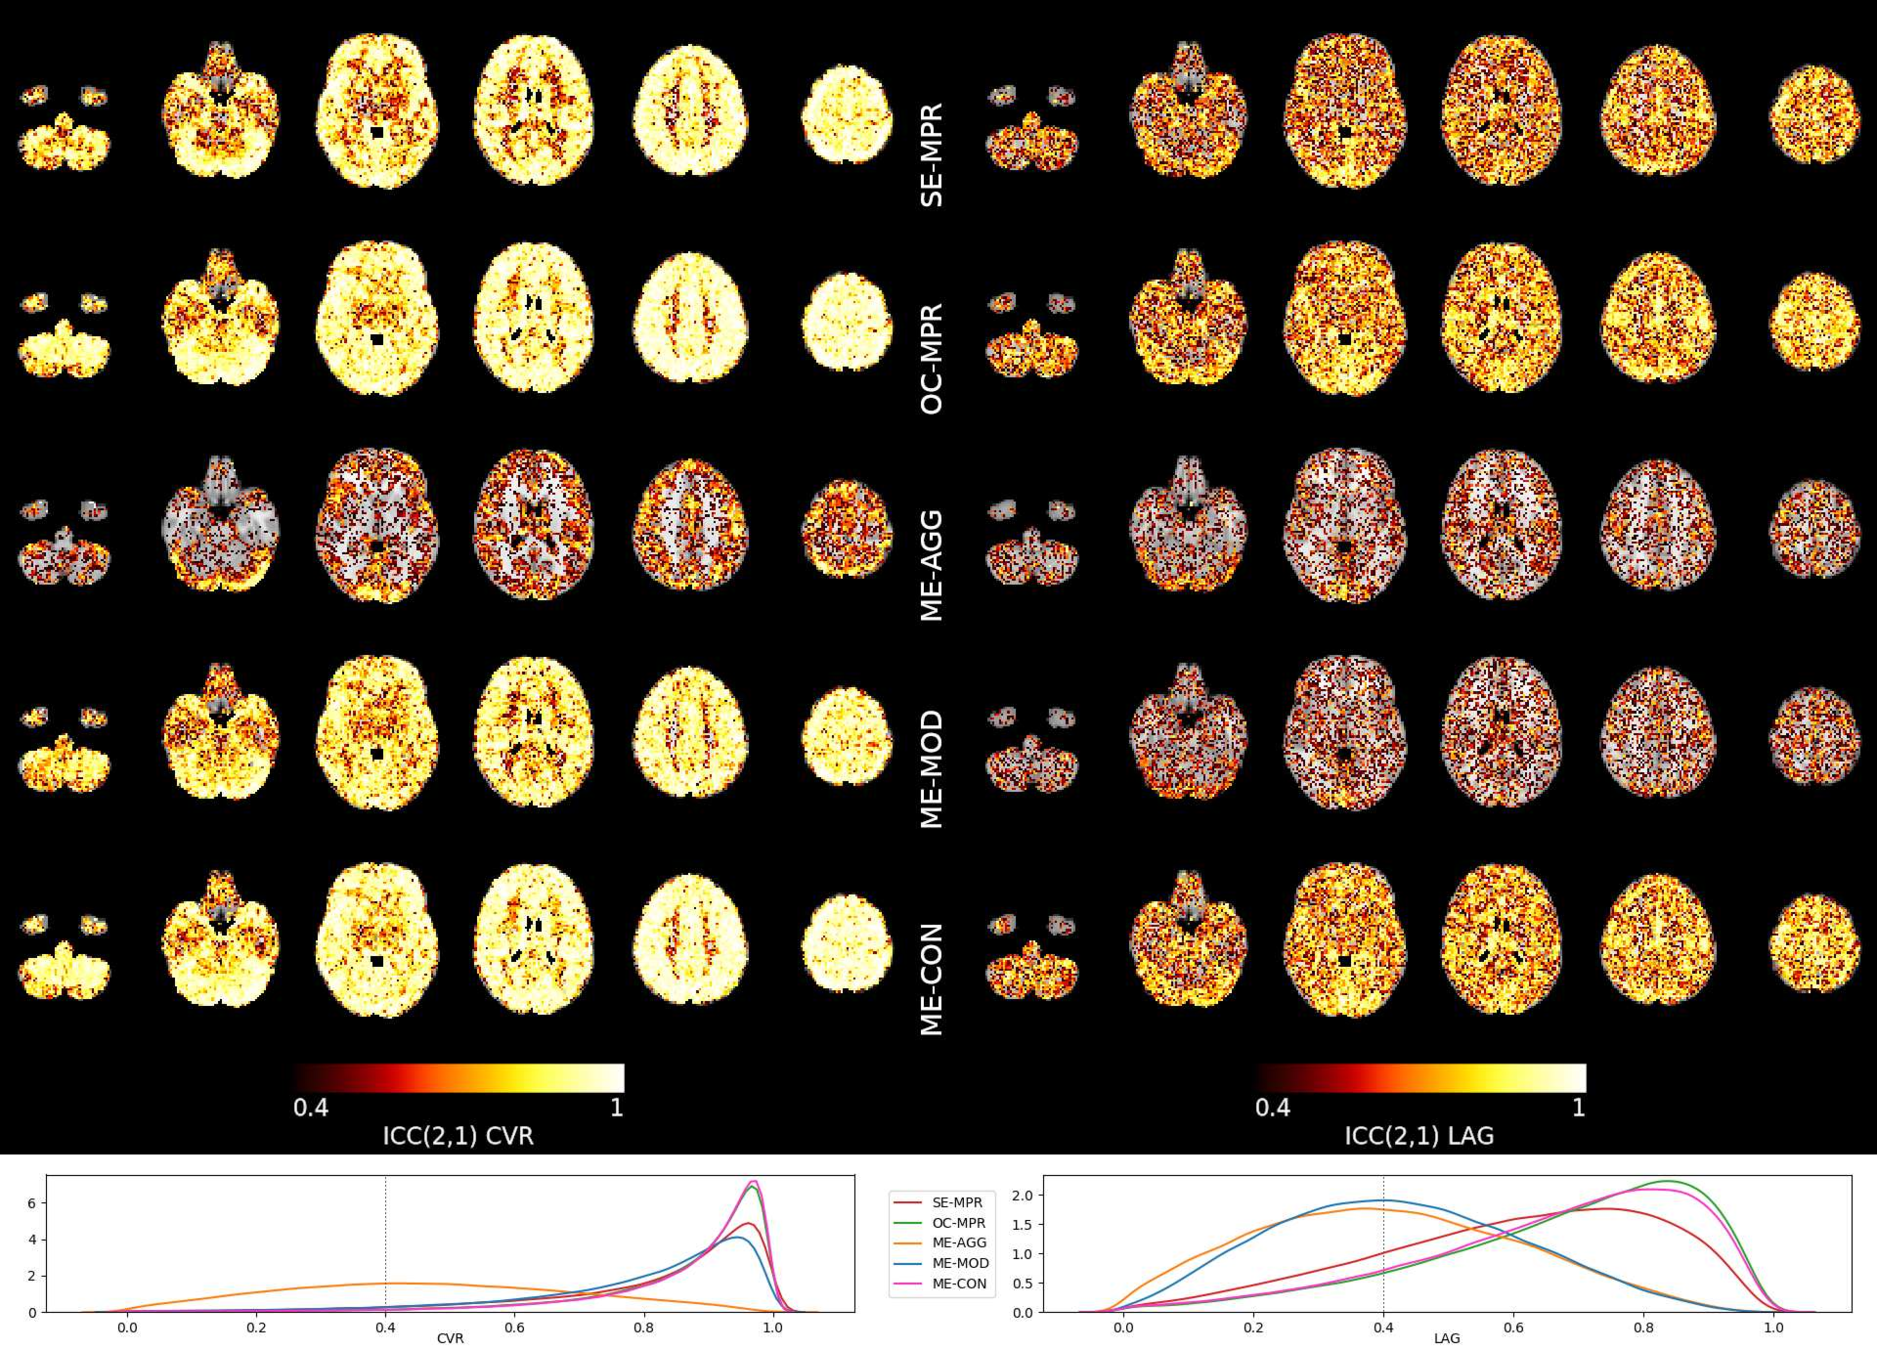
Reliability (ICC)
Single Echo
Multi-Echo
Aggressive
Moderate
Conservative
Reliability [ICC (2,1)]
Moia et al. 2021 (NeuroImage)
Results: model comparison
X \sim model + (1|subject) + (1|session)
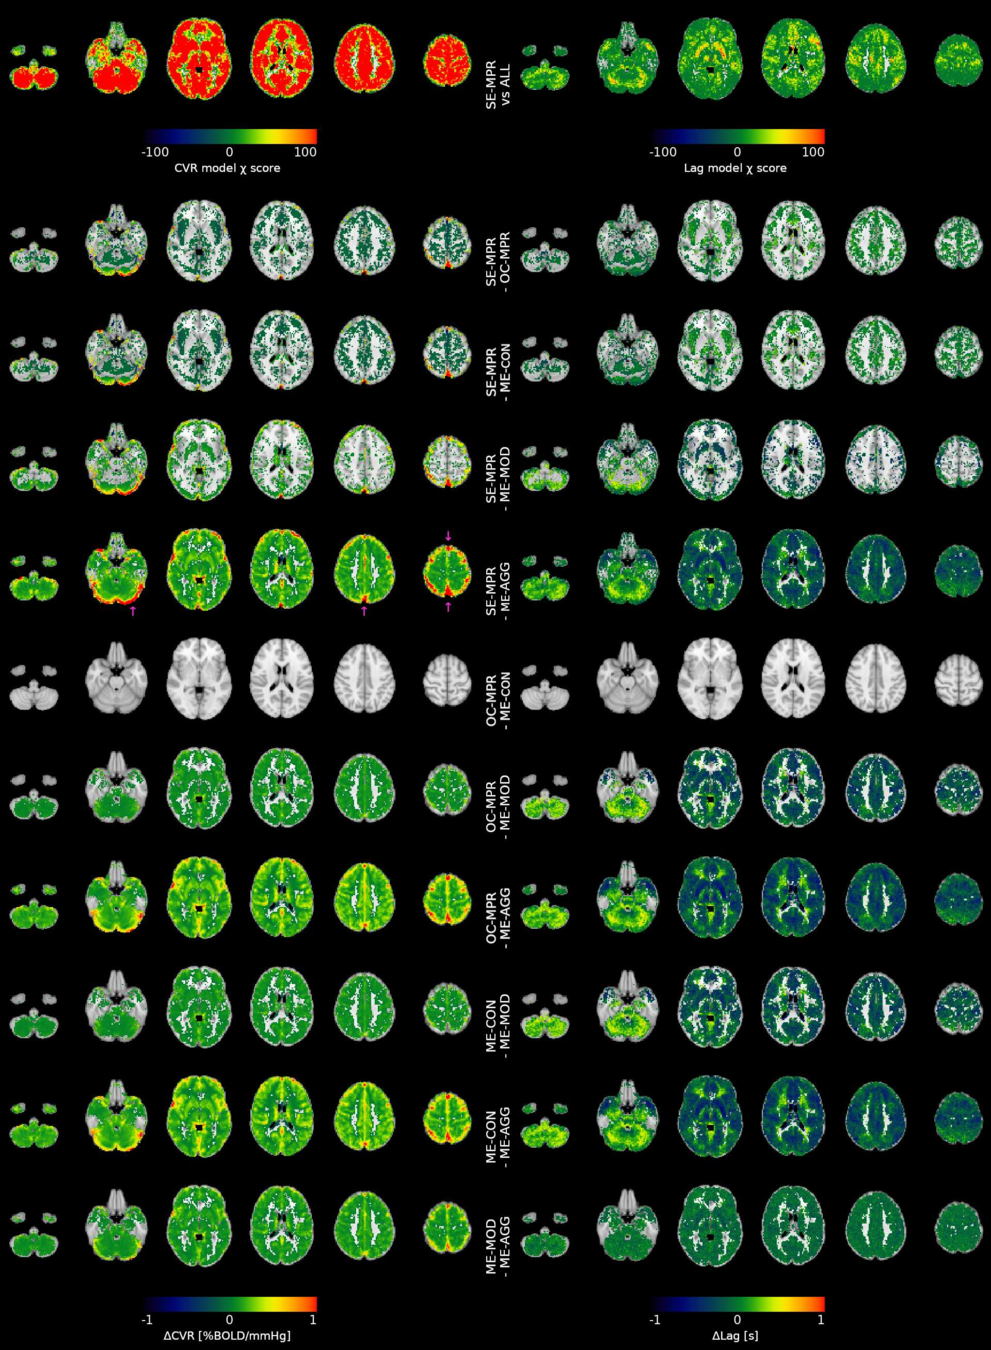
Moia et al. 2021 (NeuroImage)
CVR amplitude
CVR lag
CVR amplitude
CVR lag
Results: model comparison
X \sim model + (1|subject) + (1|session)
Moia et al. 2021 (NeuroImage)
CVR amplitude
CVR lag
CVR amplitude
CVR lag
Results: model comparison
X \sim model + (1|subject) + (1|session)
Moia et al. 2021 (NeuroImage)
CVR amplitude
CVR lag
CVR amplitude
CVR lag
Motion removal
Moia et al. 2021 (NeuroImage)
\( \cdot \) timepoint \( - \) session
Motion (FD)
Changes in BOLD (DVARS)
Raw
Single Echo
Multi-Echo
Aggressive ME-ICA
Moderate ME-ICA
Conservative ME-ICA
*Less slope is better
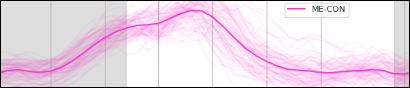
OC-MPR vs ME-CON
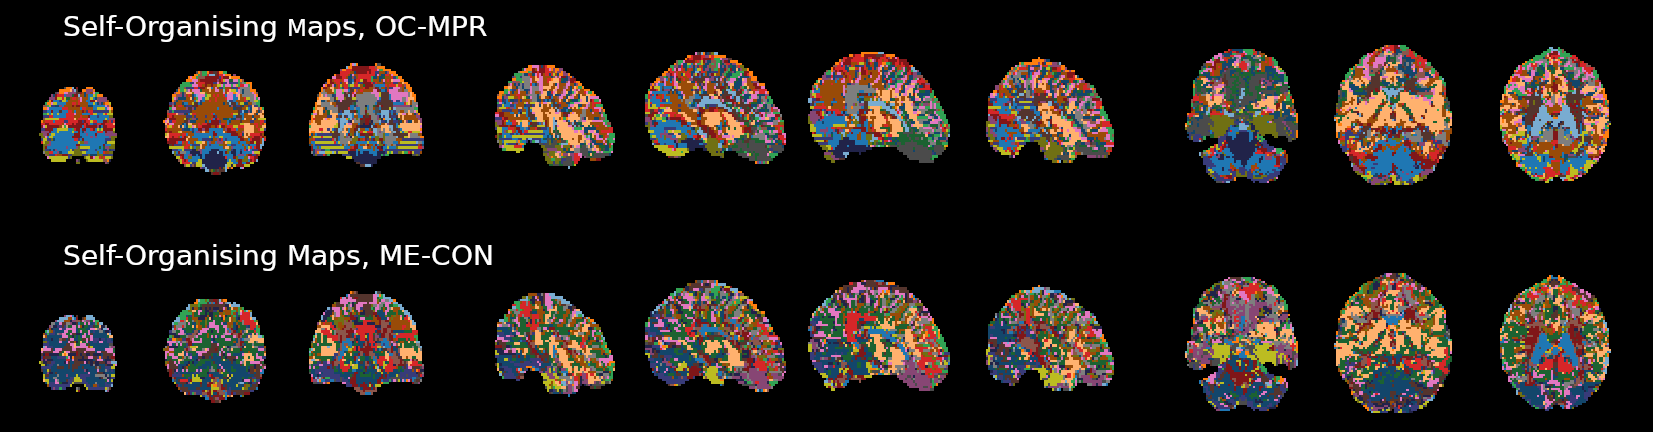
ME-CON should be better than OC-MPR in temporal-dependent application
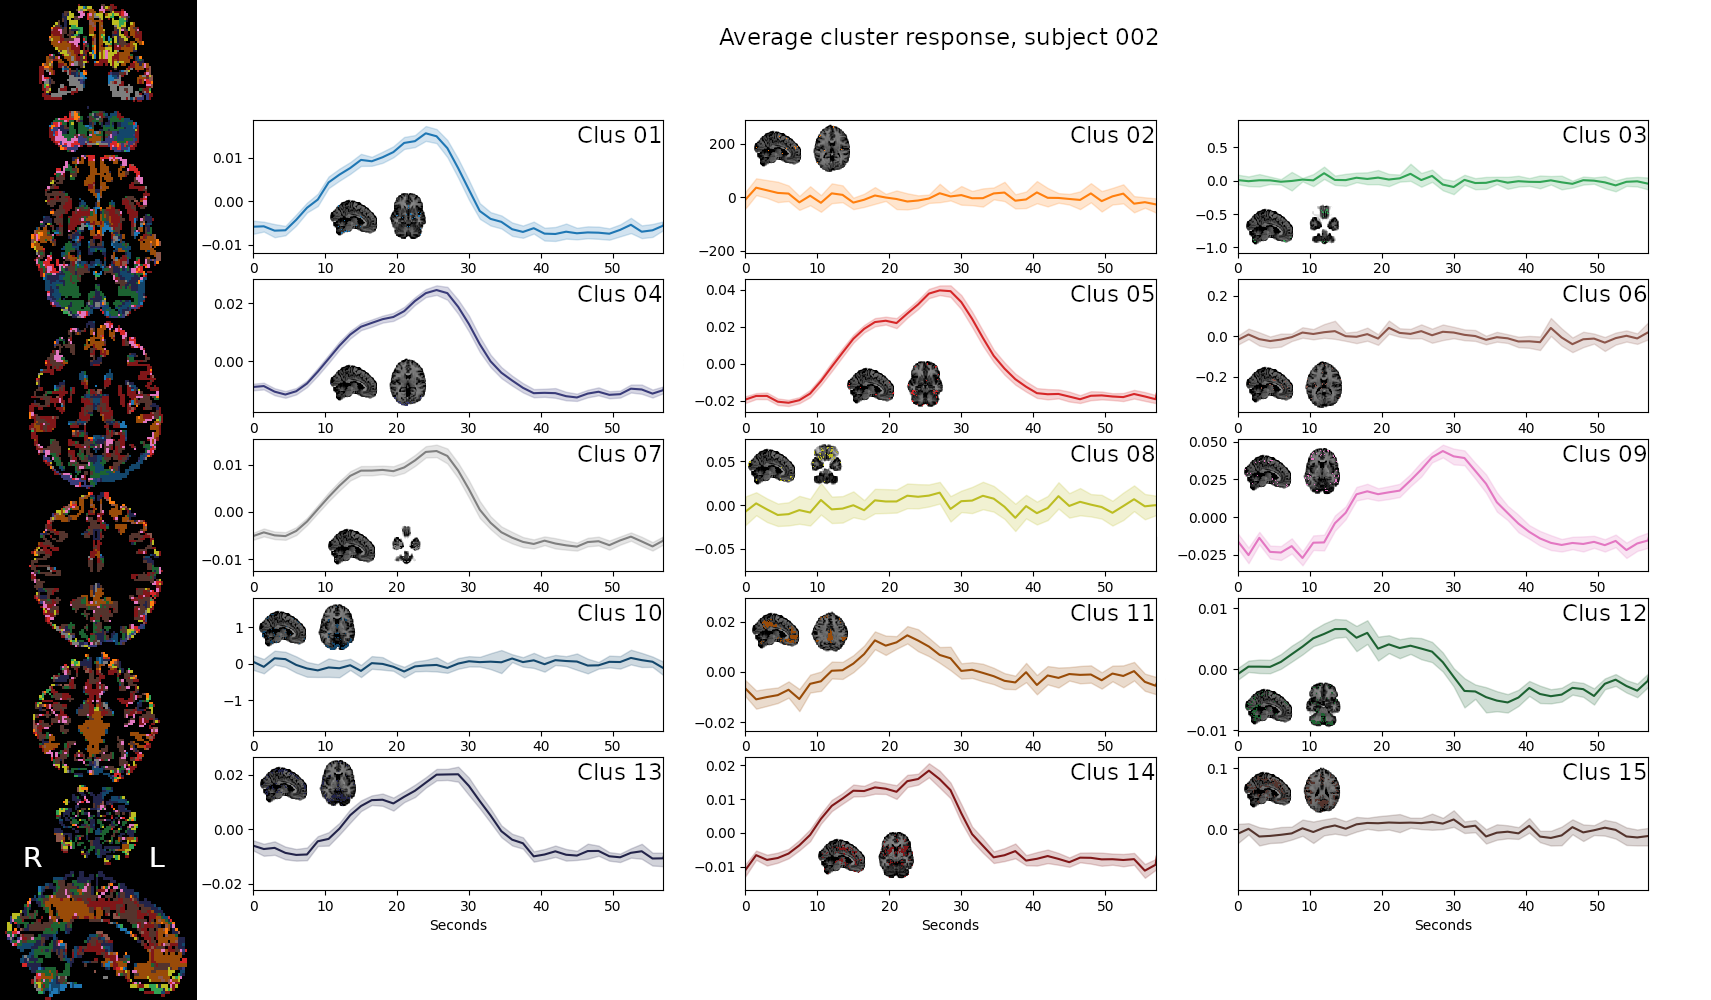
Example of application: timeseries clustering (Self-Organising Maps, 20 clusters)
Submitted to ISMRM 2022
Take home #3
Pay attention to your ICA denoising:
an aggressive denoising might remove your signal of interest completely!
Alternative ICA based denoise (sequential)
What is the best way to denoise the data after ICA?
Regression based:
Aggressive approach: nuisance regression using only the rejected components.
Non aggressive (partial regression) approach: all the components are considered, but only the rejected components are regressed out of the data.
Orthogonalised approach: the rejected components are orthogonalised with respect to the other components.
4D-based approach (similar to M/EEG): reconstruct volumes on noise, then subtract it from the original data.
\( Y = \) \(A\) \(+\) \(R\) \(+ n \)
Multivariate:

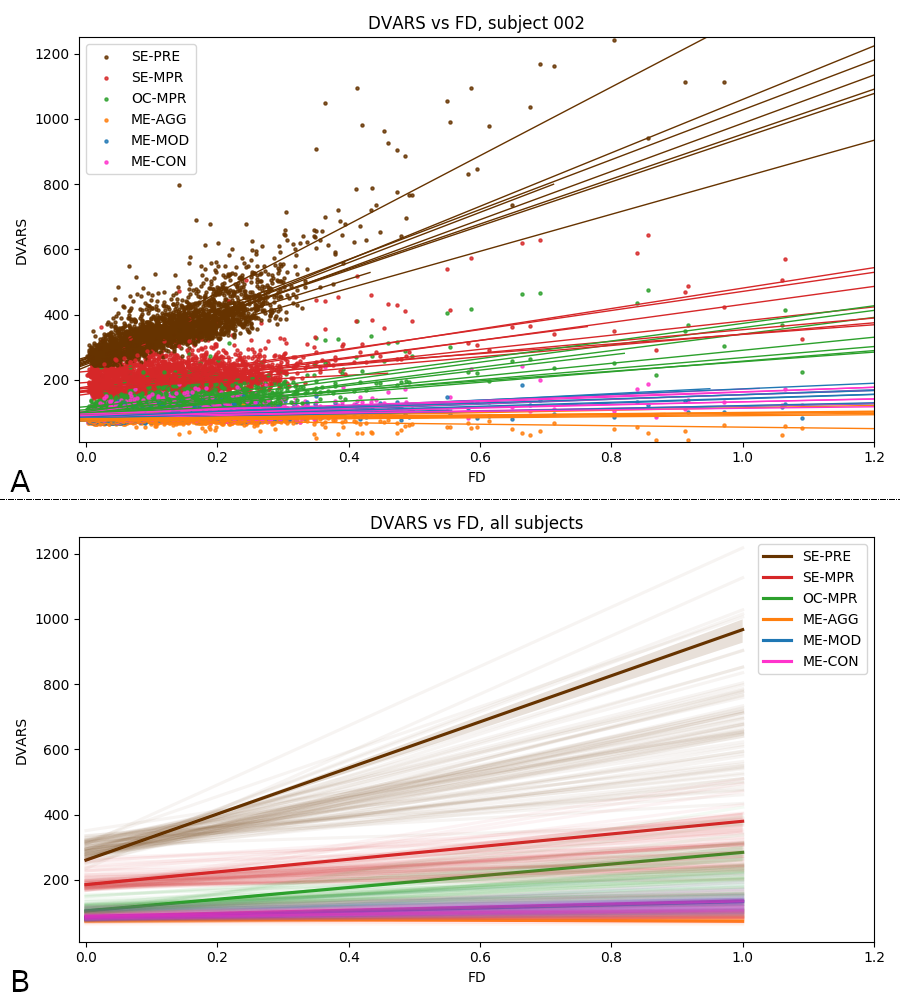
Alternative ICA based denoise (sequential)
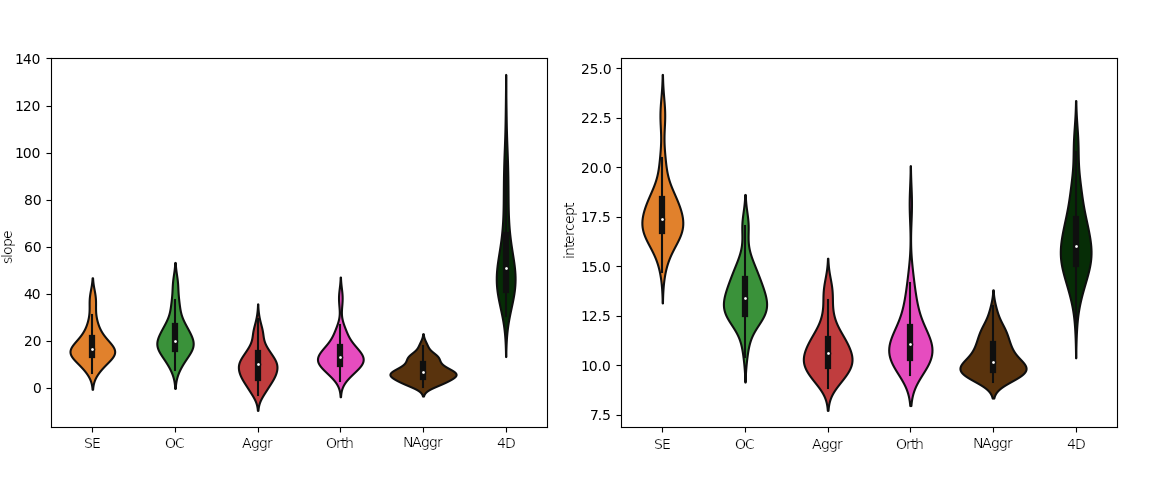
Effect of denoising approach is significant for slope (F(5,354)=177.6, p<0.001) and intercept (F(5,354)=225.7, p<0.001) of the linear regression model
DVARS vs FD
Group level, DVARS vs FD
Slope
Intercept
↓
↓

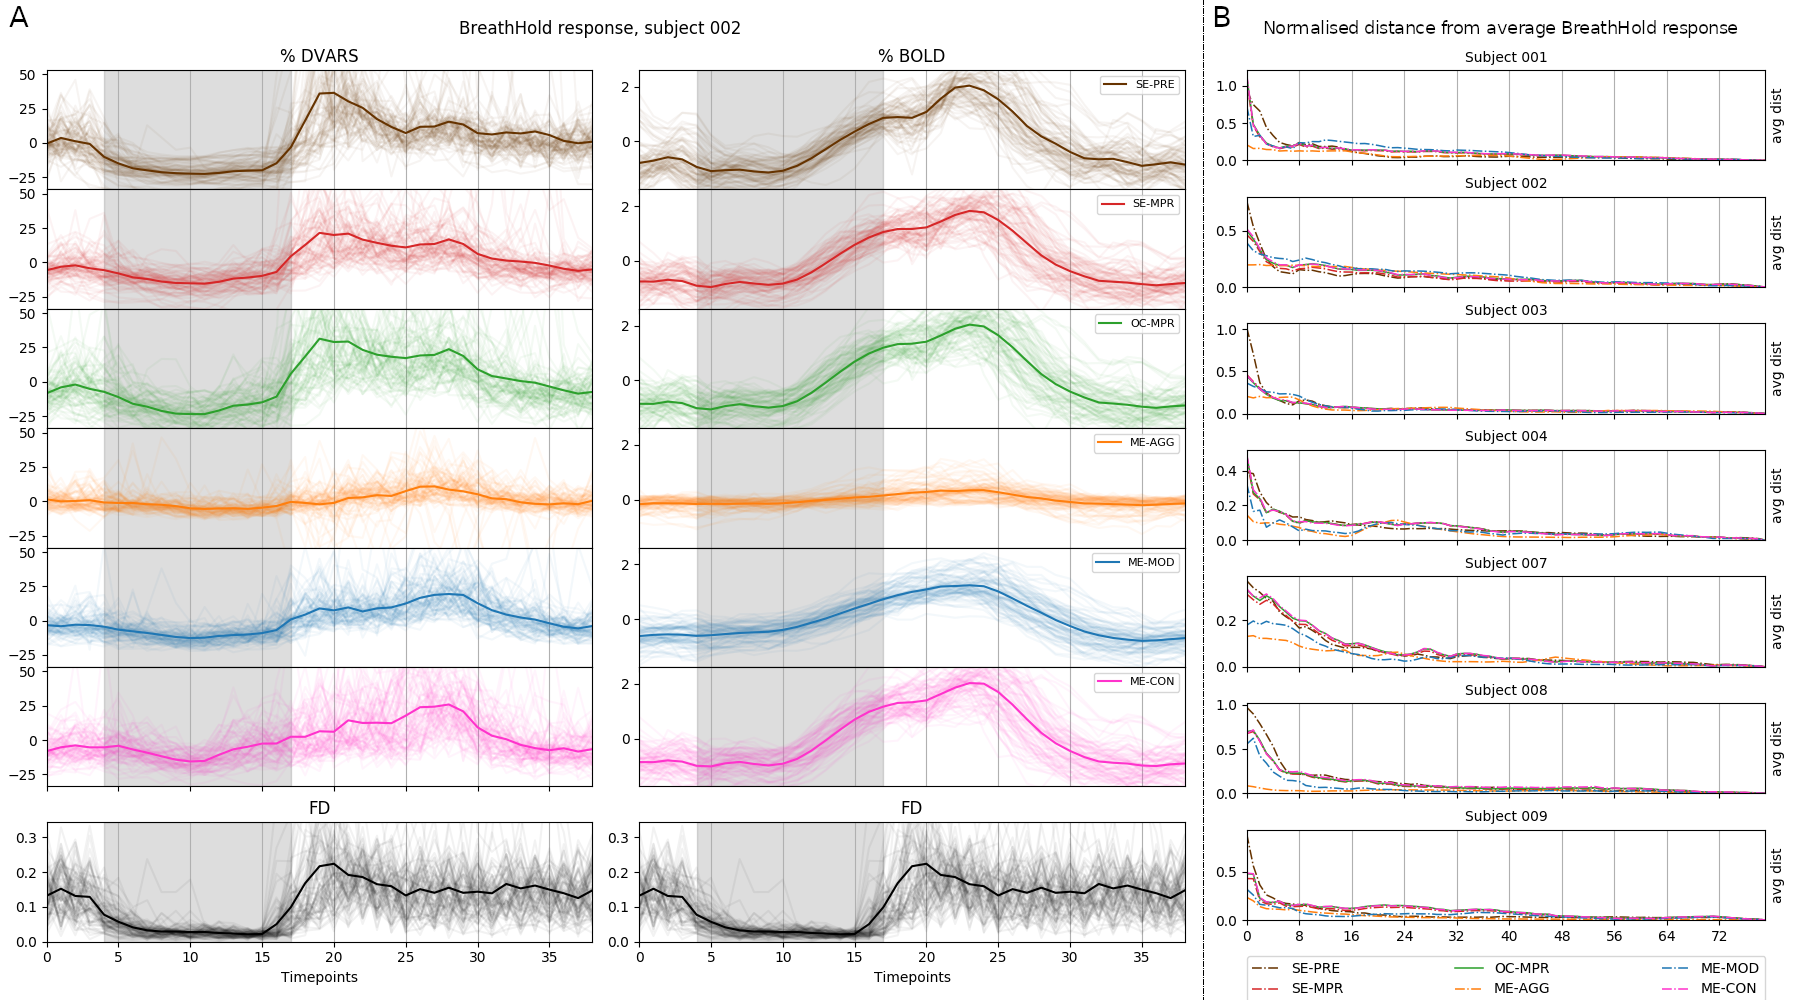
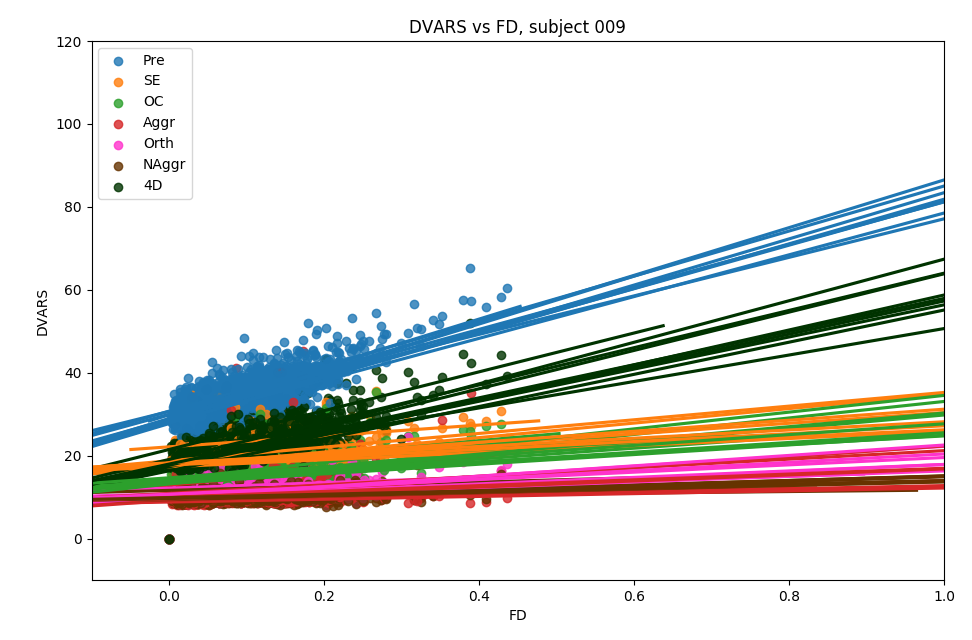
Alternative ICA based denoise (sequential)
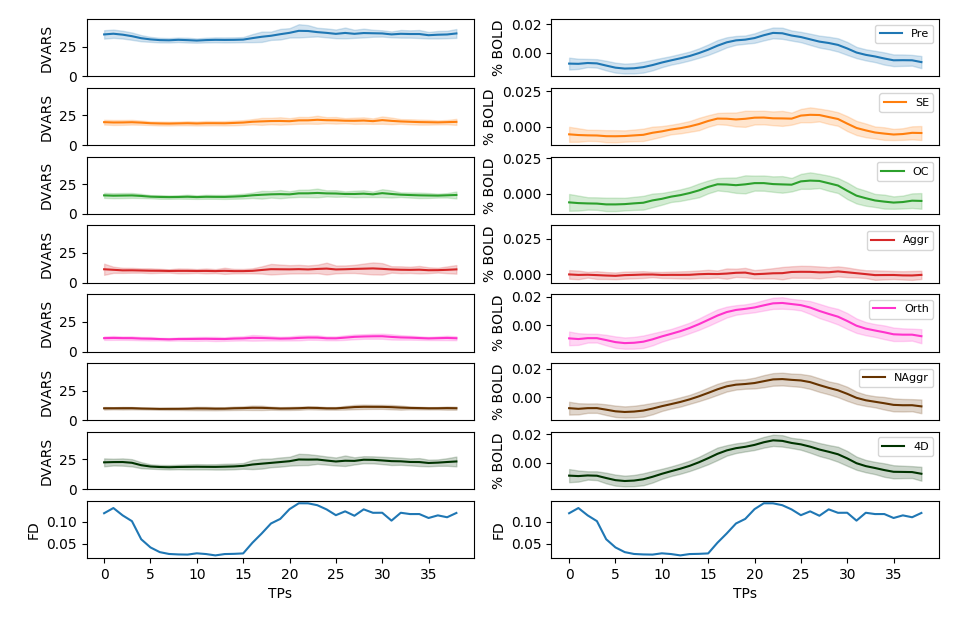
Average % BOLD and DVARS across all trials
↑
↑
↓
↓
↓
↓
↓
Aggressive denoise removes signal of interest
OC and E-02 denoise affects the signal of interest more than ICA denoise
↑
↑
↑
↑
Alternative ICA based denoise (sequential)
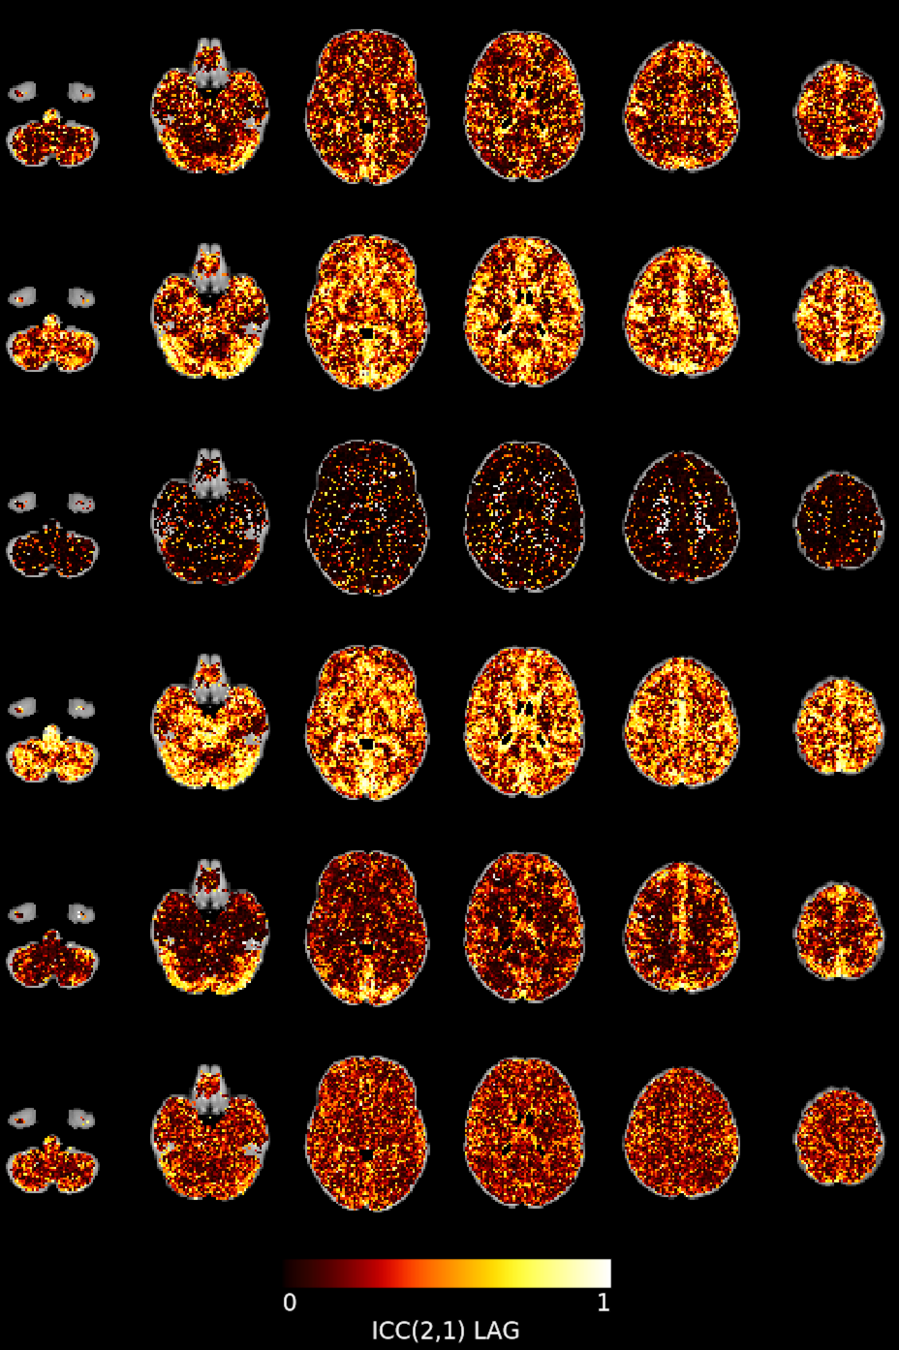
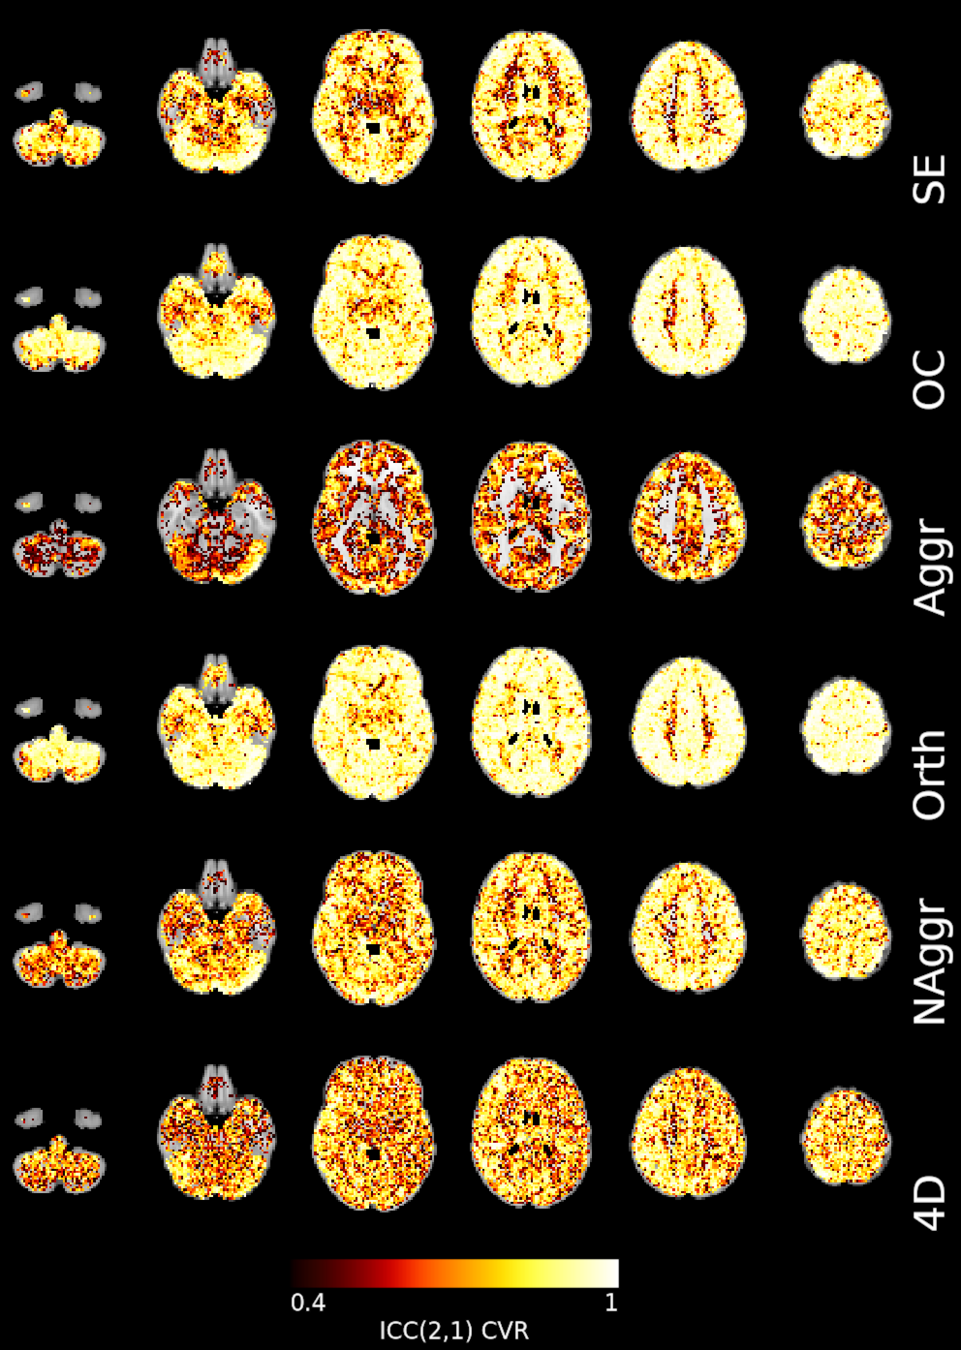
Lag reliability
CVR reliability
Impact of CVR
on rest and behaviour
Cerebrovascular Reactivity (CVR) and Neurovascular Coupling
CVR reflects the capacity for Cerebral Blood Flow and Volume to increase.
A similar, if not the same, process is driven by Neurovascular Coupling.
Does CVR amplitude predict Neurovascular Coupling?
Is CVR a predictor of natural fluctuations and behavioural responses?
Does it explain part of the individual variability?
An alternative estimation of CVR
Previous literature links CVR with Resting State Fluctuations Amplitudes, due to cross-sectional (inter-subject) and spatial correlation¹
RSFA = \sigma_{t_x}
CVR \backsim RSFA
1. Golestani et al., 2016 (Neuroimage), Chen et al., 2023 (bioRxiv), De Vis et al. 2014 (PloS ONE), Kannurpatti et al., 2014 (PloS ONE)
Alternative CVR estimation
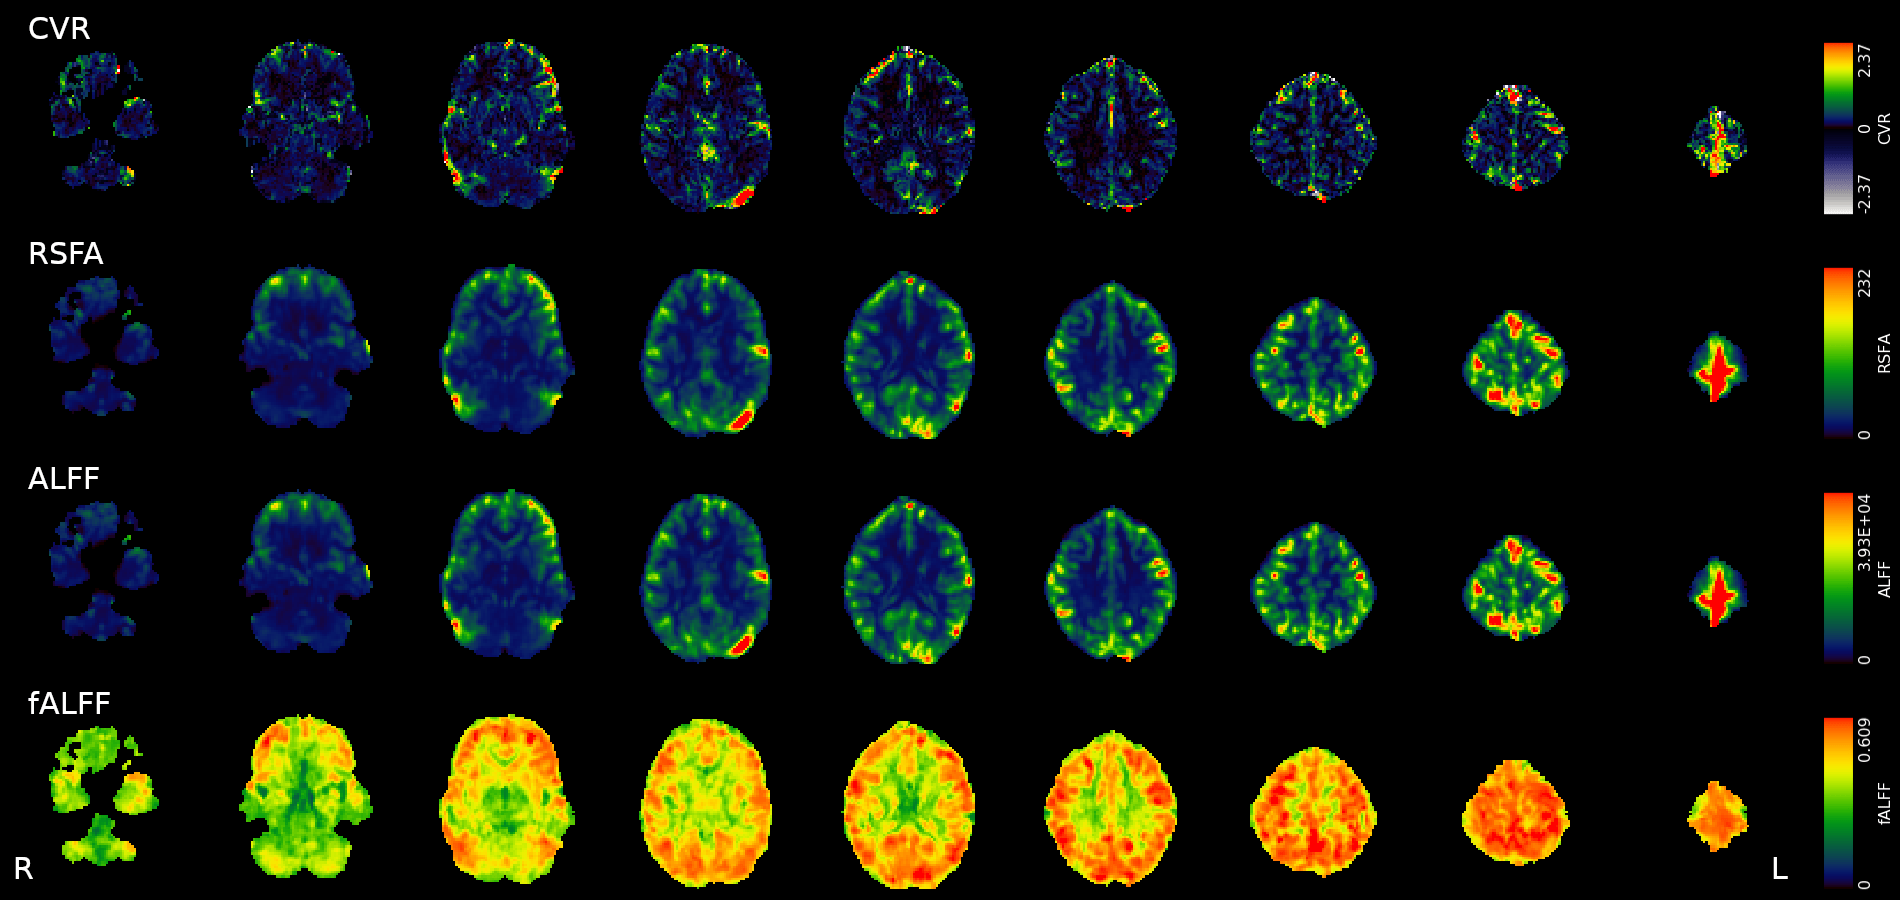
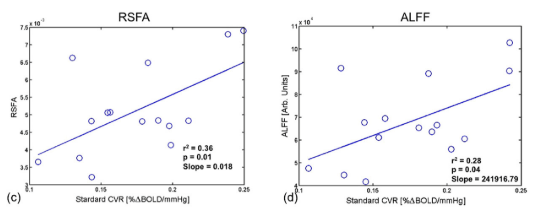
- Resting State Fluctuations (RSFA, ALFF) agree with CVR in cross-section studies¹
1. Golestani et al., 2016 (Neuroimage), Chen et al., 2023 (bioRxiv),
De Vis et al. 2014 (PloS ONE), Kannurpatti et al., 2014 (PloS ONE)
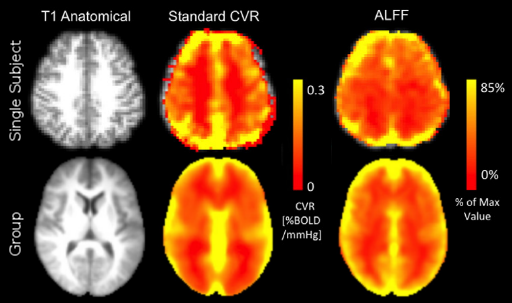
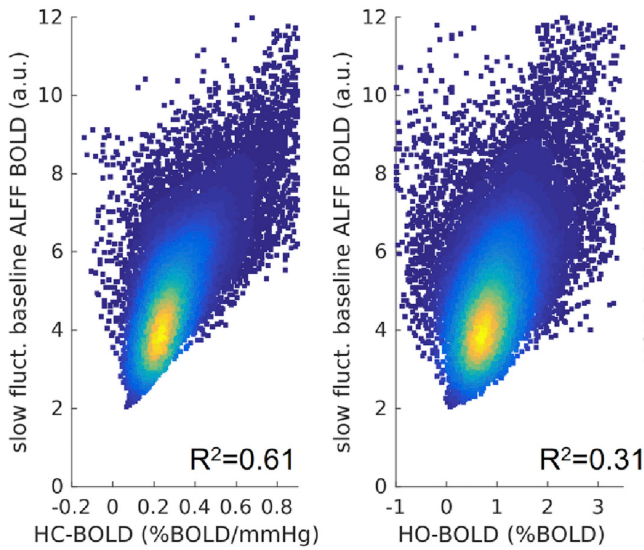
corr(CVR,RSFA)
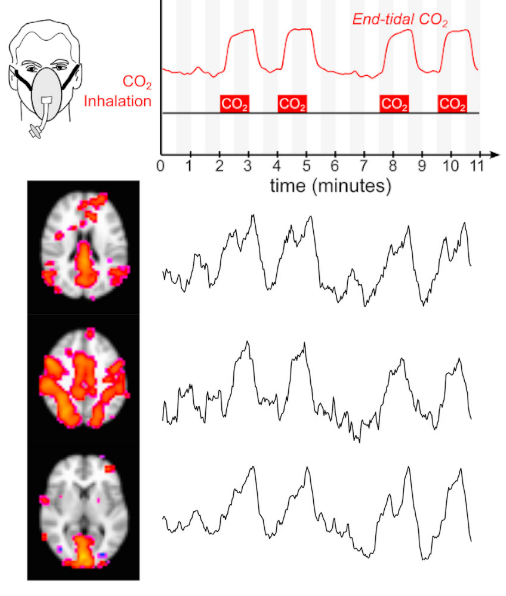
Resting State Fluctuations and physiology
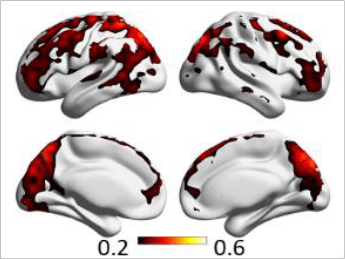
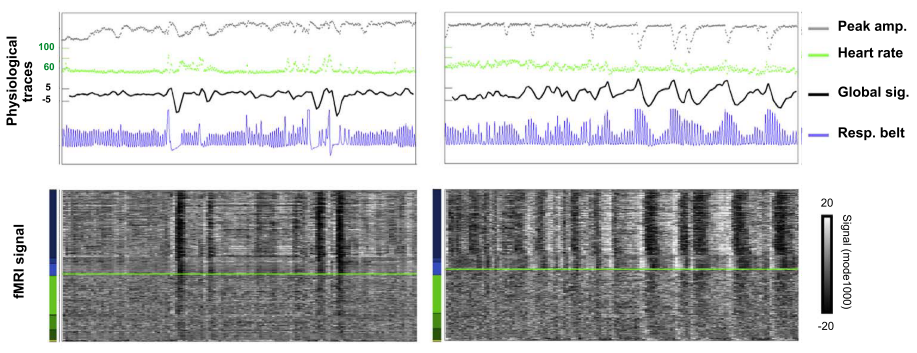
1. [adapted from] Power et al. 2017 (Neuroimage)
This susceptibility can be treated either as noise or as meaningful information (e.g. physiological imaging or functional MRI calibration).
Resting State Fluctuations (RSF) are susceptible to physiological signals¹.
Resting State Fluctuations and behavioural responses
CVR \backsim RSFA
RSFA → beh.resp.
CVR → beh.resp. \; {?}
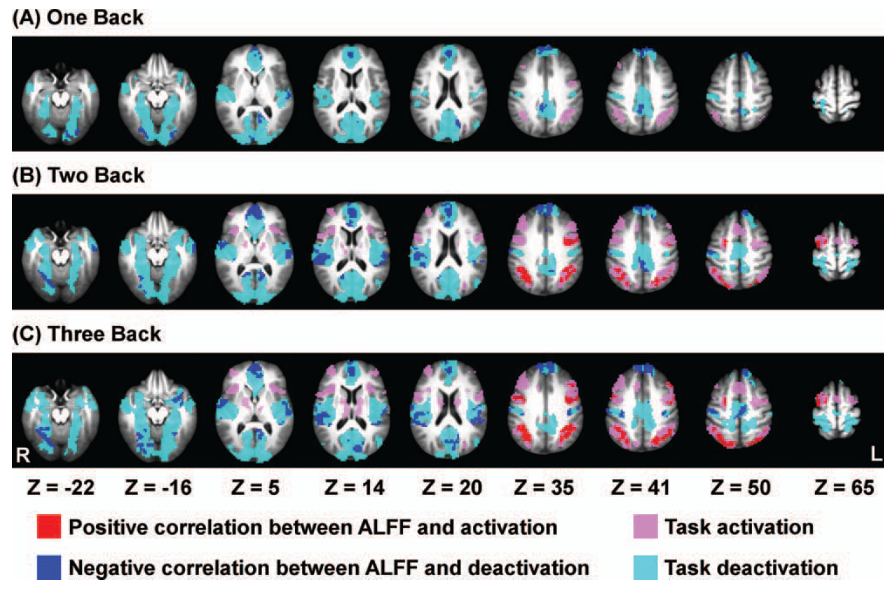
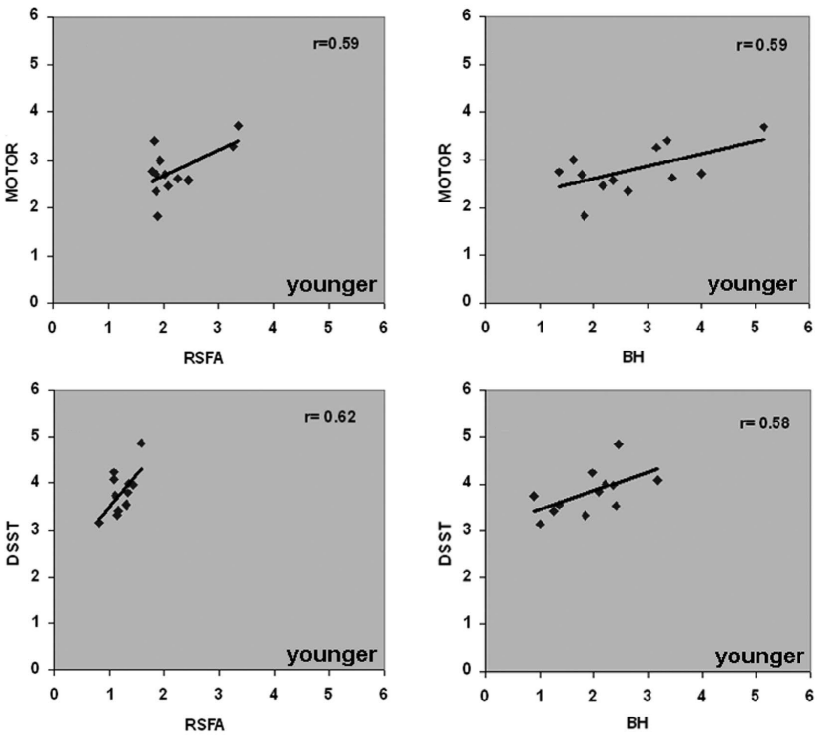
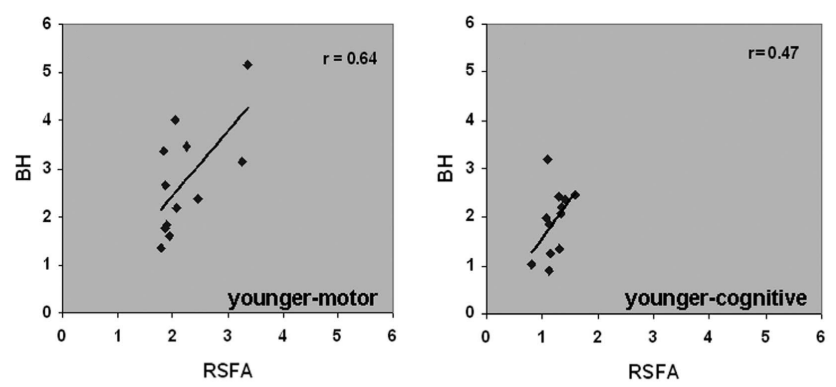
1. Zou et al. 2013 (Hum. Brain Mapp.), Mennes et al. 2011 (NeuroImage), Kannurpatti et al. 2014 (PLoS ONE)
Link between Resting State Fluctuations Amplitudes and behavioural responses¹
* ALFF is qualitatively the same as RSFA
EuskalIBUR
ME-MB fMRI: TR = 1.5 s, TEs = 10.6/28.69/46.78/64.87/82.96 ms, MB = 4, GRAPPA = 2, voxel size = 2.4x2.4x3 mm³
10 neurotypical subjects
(5F, age 25-40y)

10 sessions, one week apart, same time of the day

T2w, MP2RAGE, 4 RS,
3 tasks, BH paradigm
CO2 and O2
sampling
↑
Moia et al. (2020), OpenNeuro. [Dataset] doi: 10.18112/openneuro.ds003192.v1.0.1

EuskalIBUR
ME-MB fMRI: TR = 1.5 s, TEs = 10.6/28.69/46.78/64.87/82.96 ms, MB = 4, GRAPPA = 2, voxel size = 2.4x2.4x3 mm³
10 neurotypical subjects
(5F, age 25-40y)
10 sessions, one week apart, same time of the day
T2w, MP2RAGE, 4 RS,
3 tasks, BH paradigm
CO2 and O2
sampling
↑
Moia et al. (2020), OpenNeuro. [Dataset] doi: 10.18112/openneuro.ds003192.v1.0.1
Impact of CVR on rest and behavioural responses
CVR \backsim RSFA
RSFA → beh.resp.
CVR → beh.resp. \; {?}
Data
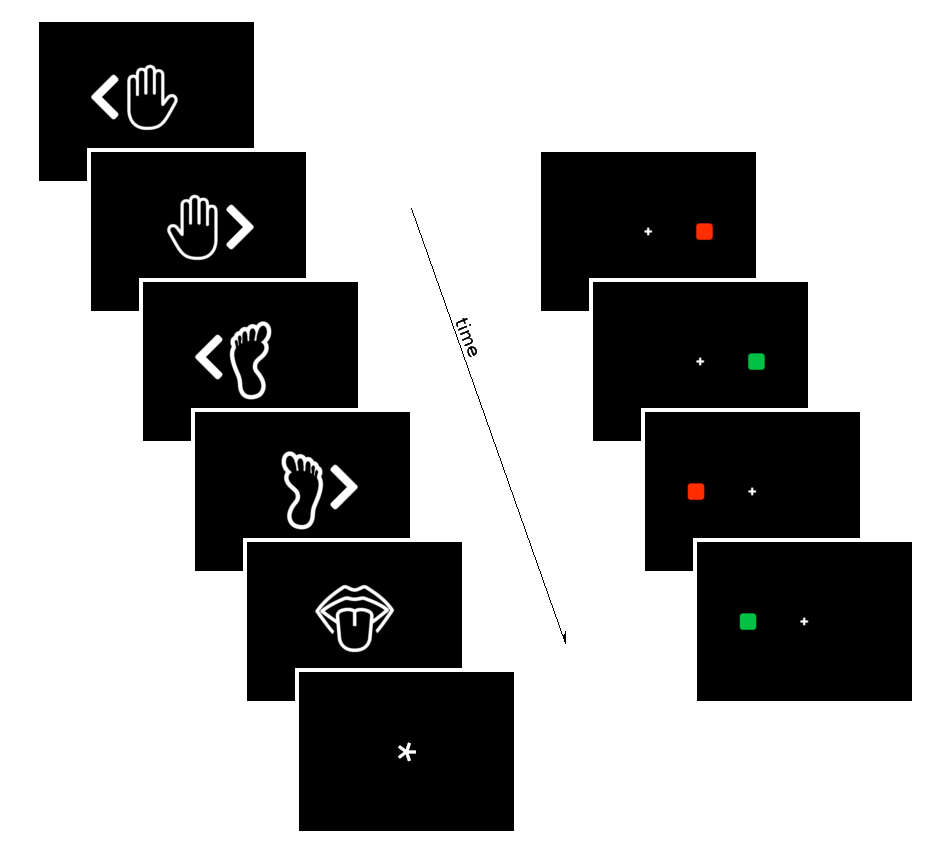
- Session-wise GLMs to retrieve betas and contrasts in tasks
- Linear Mixed Effects Models to assess relationships between CVR, RSF, and behavioural responses
Motor
Simon
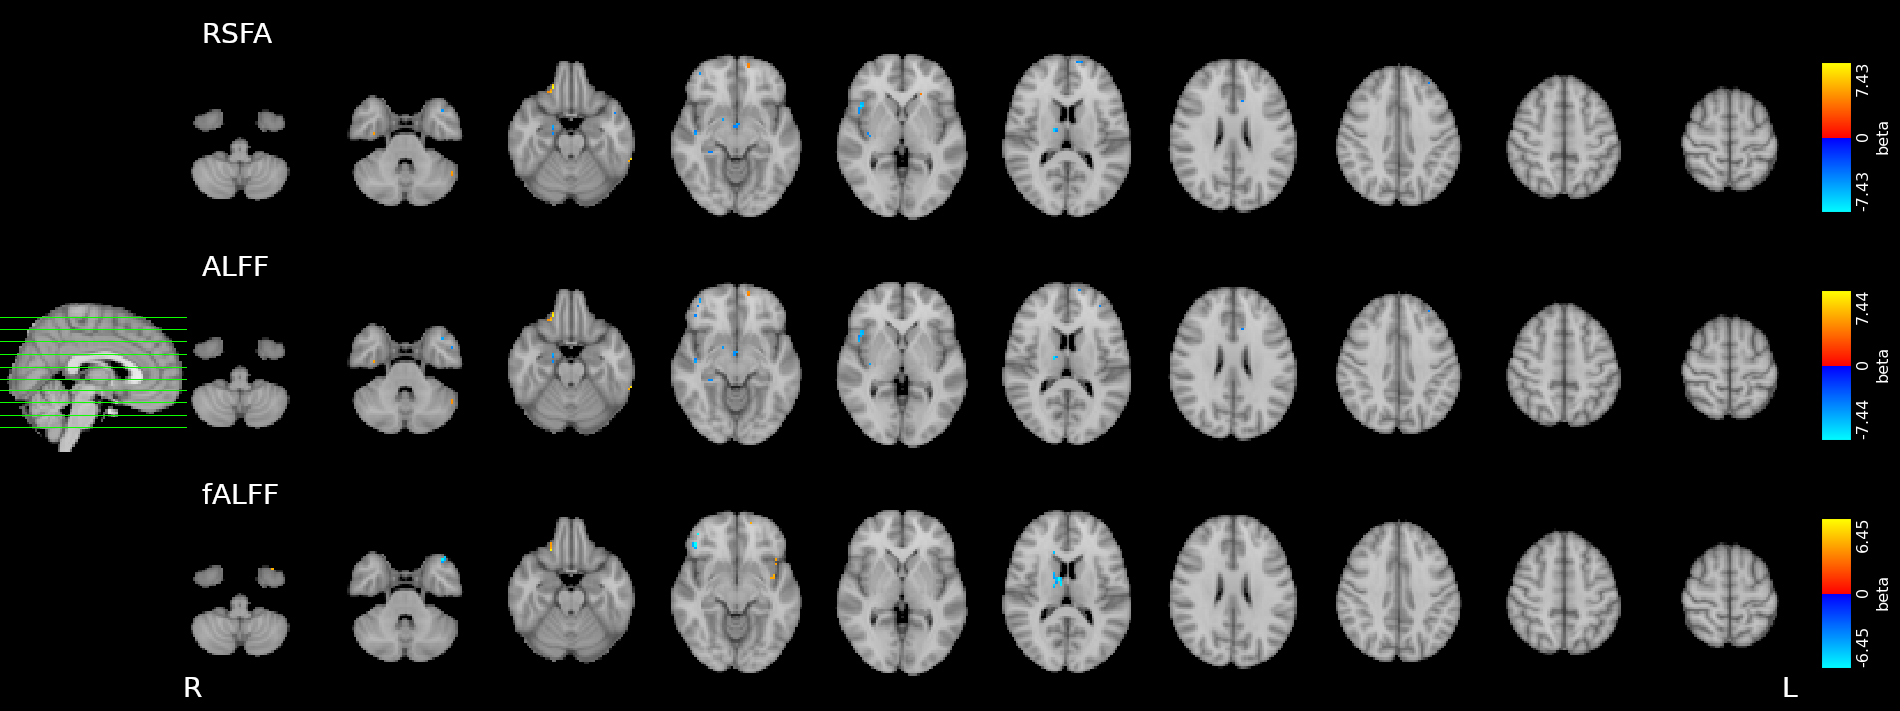
CVR, Resting State Fluctuations, and behaviour
Results thresholded at \(p<0.001\) uncorrected
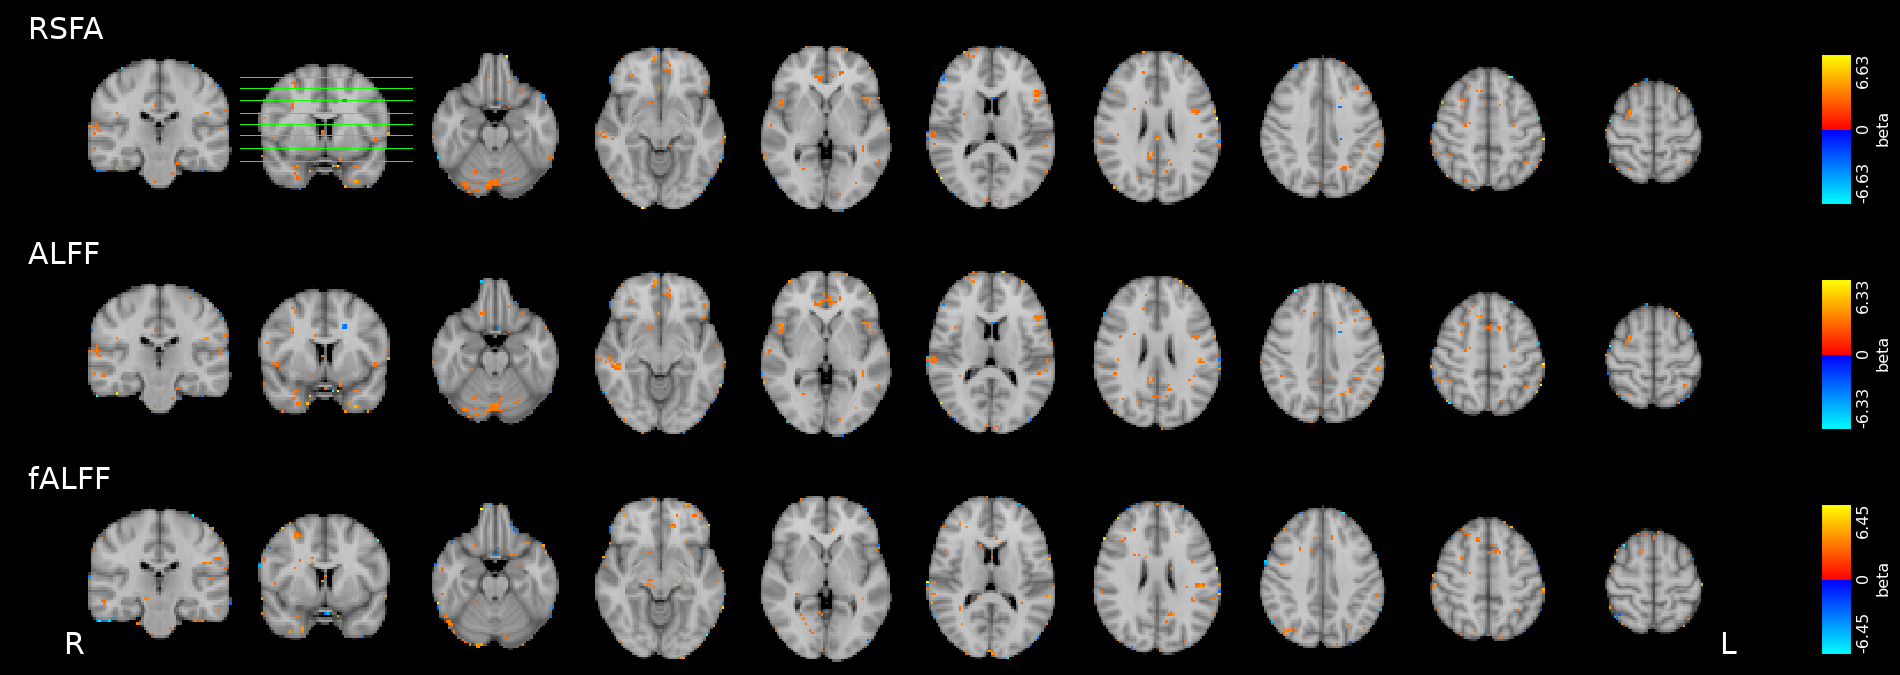
CVR-
RSFA
Motor
Simon
Congr.
Simon
Incon.
Results: CVR and RSF
Results thresholded at \(p<0.001\) uncorrected
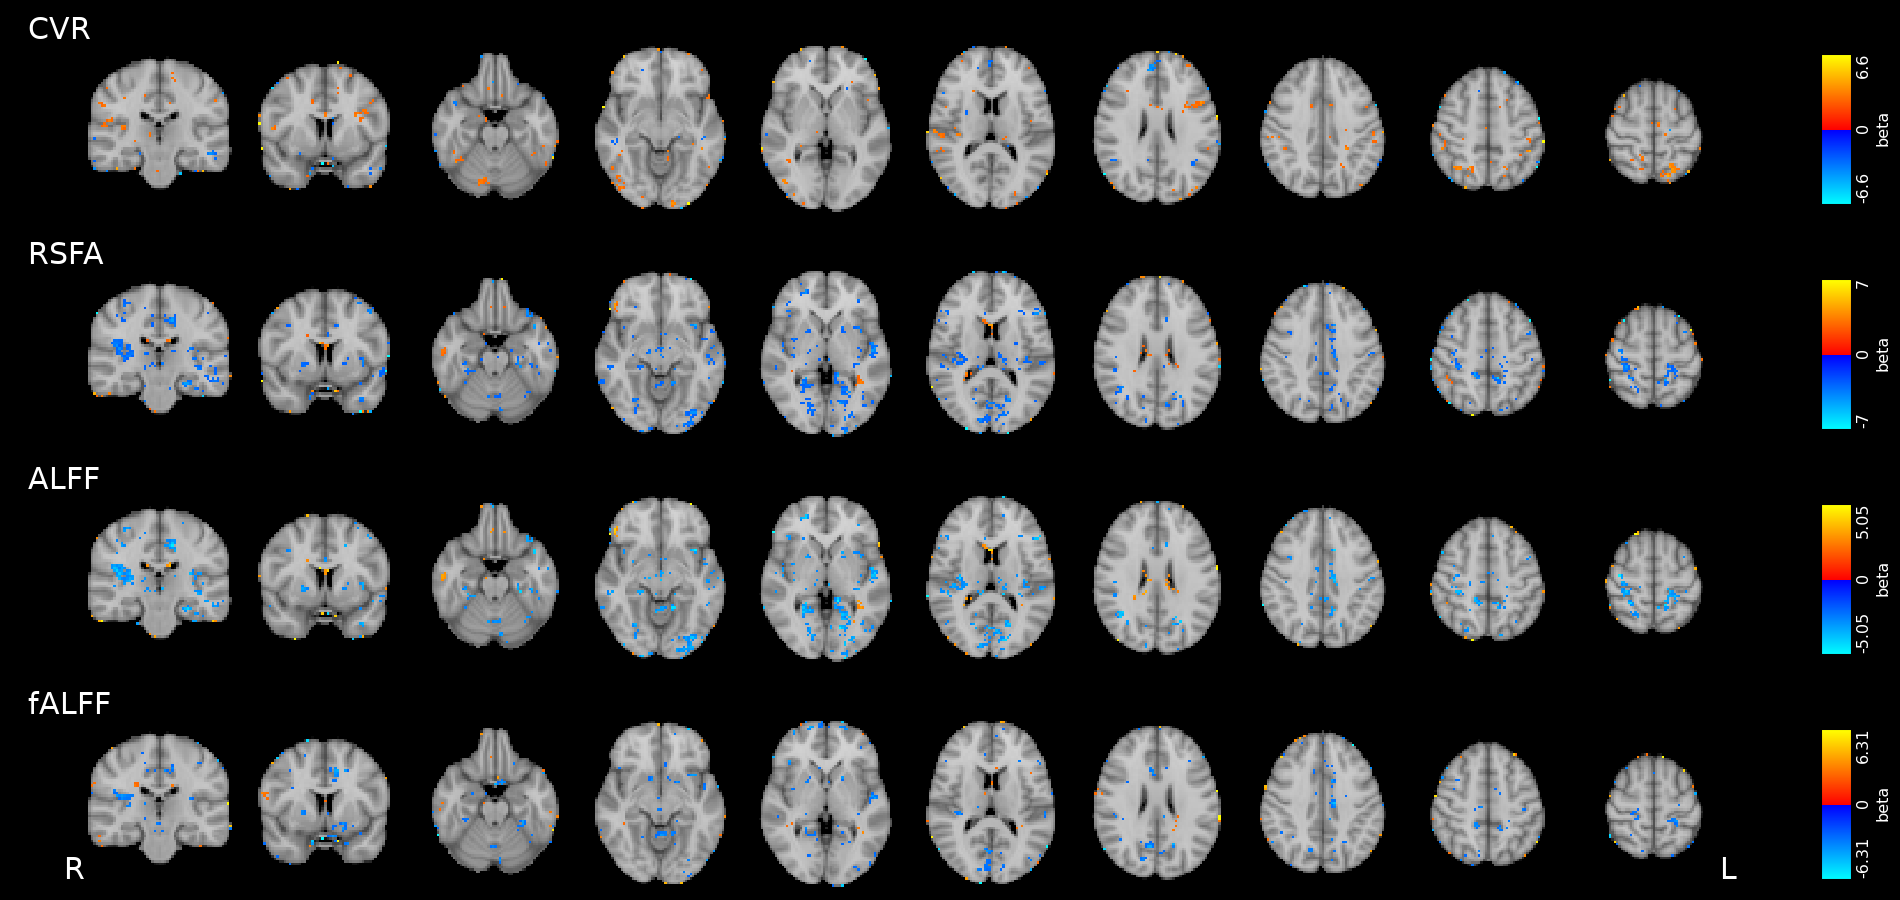
Results: CVR, RSF, and tasks (motor)
Results thresholded at \(p<0.001\) uncorrected
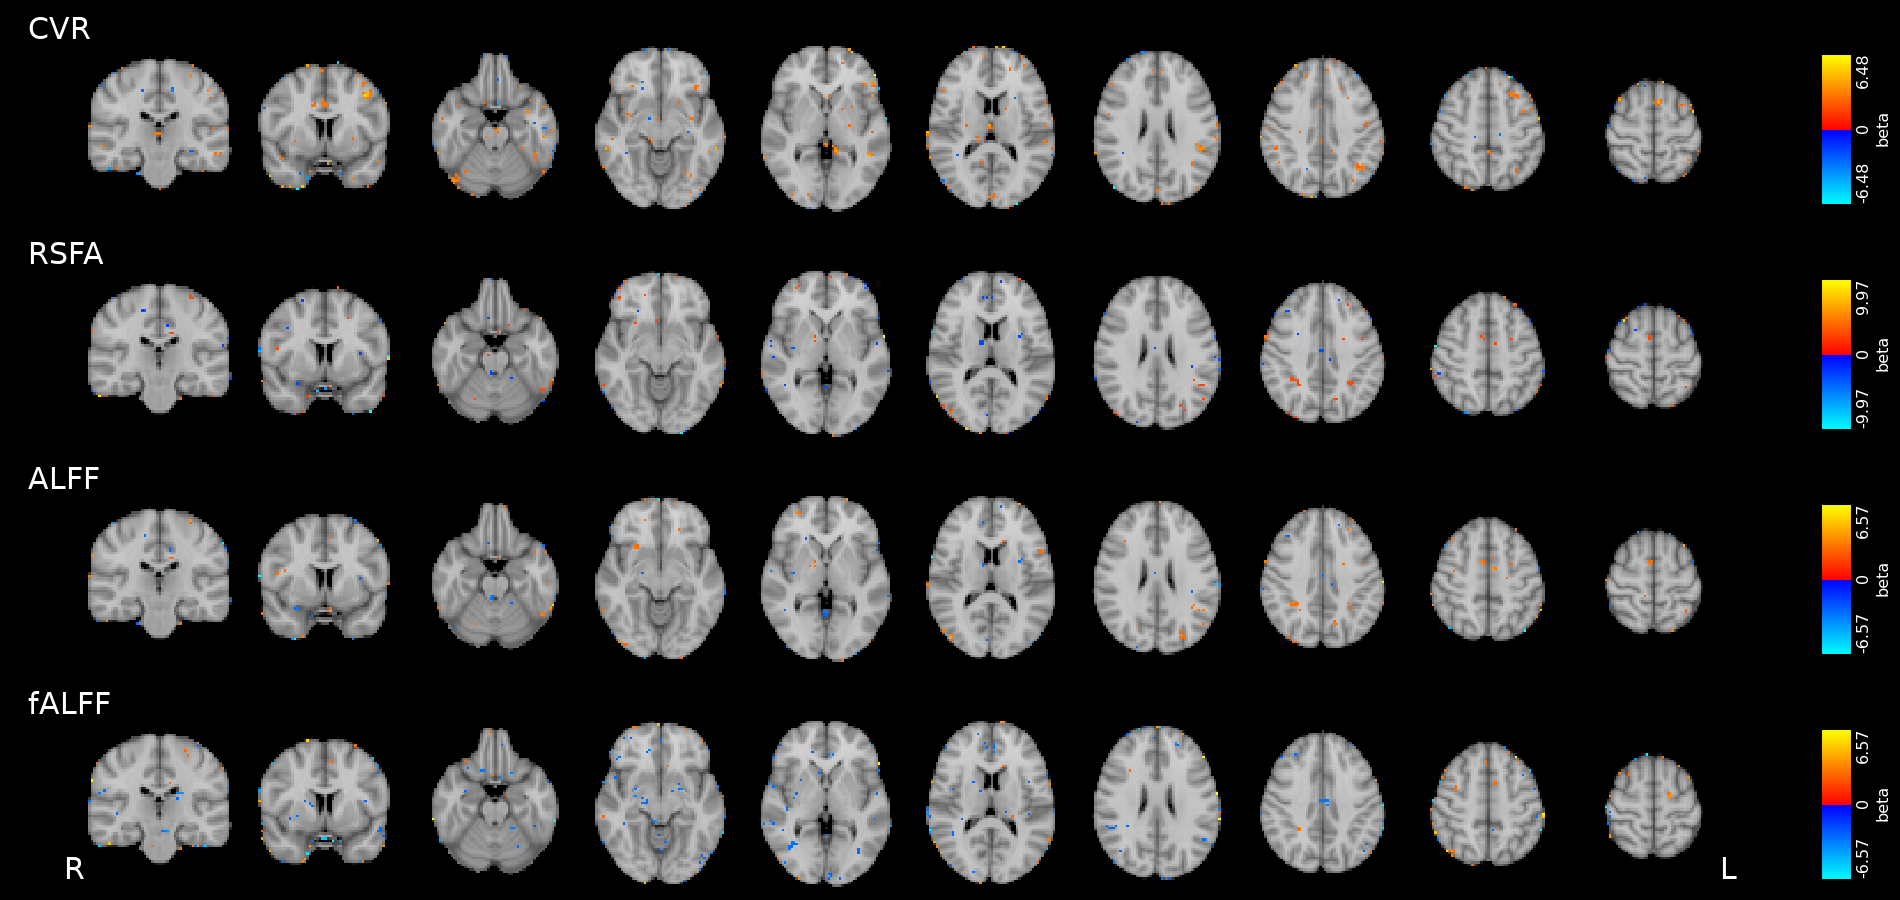
Results: CVR, RSF, and tasks (Simon, congruent)
Results thresholded at \(p<0.001\) uncorrected
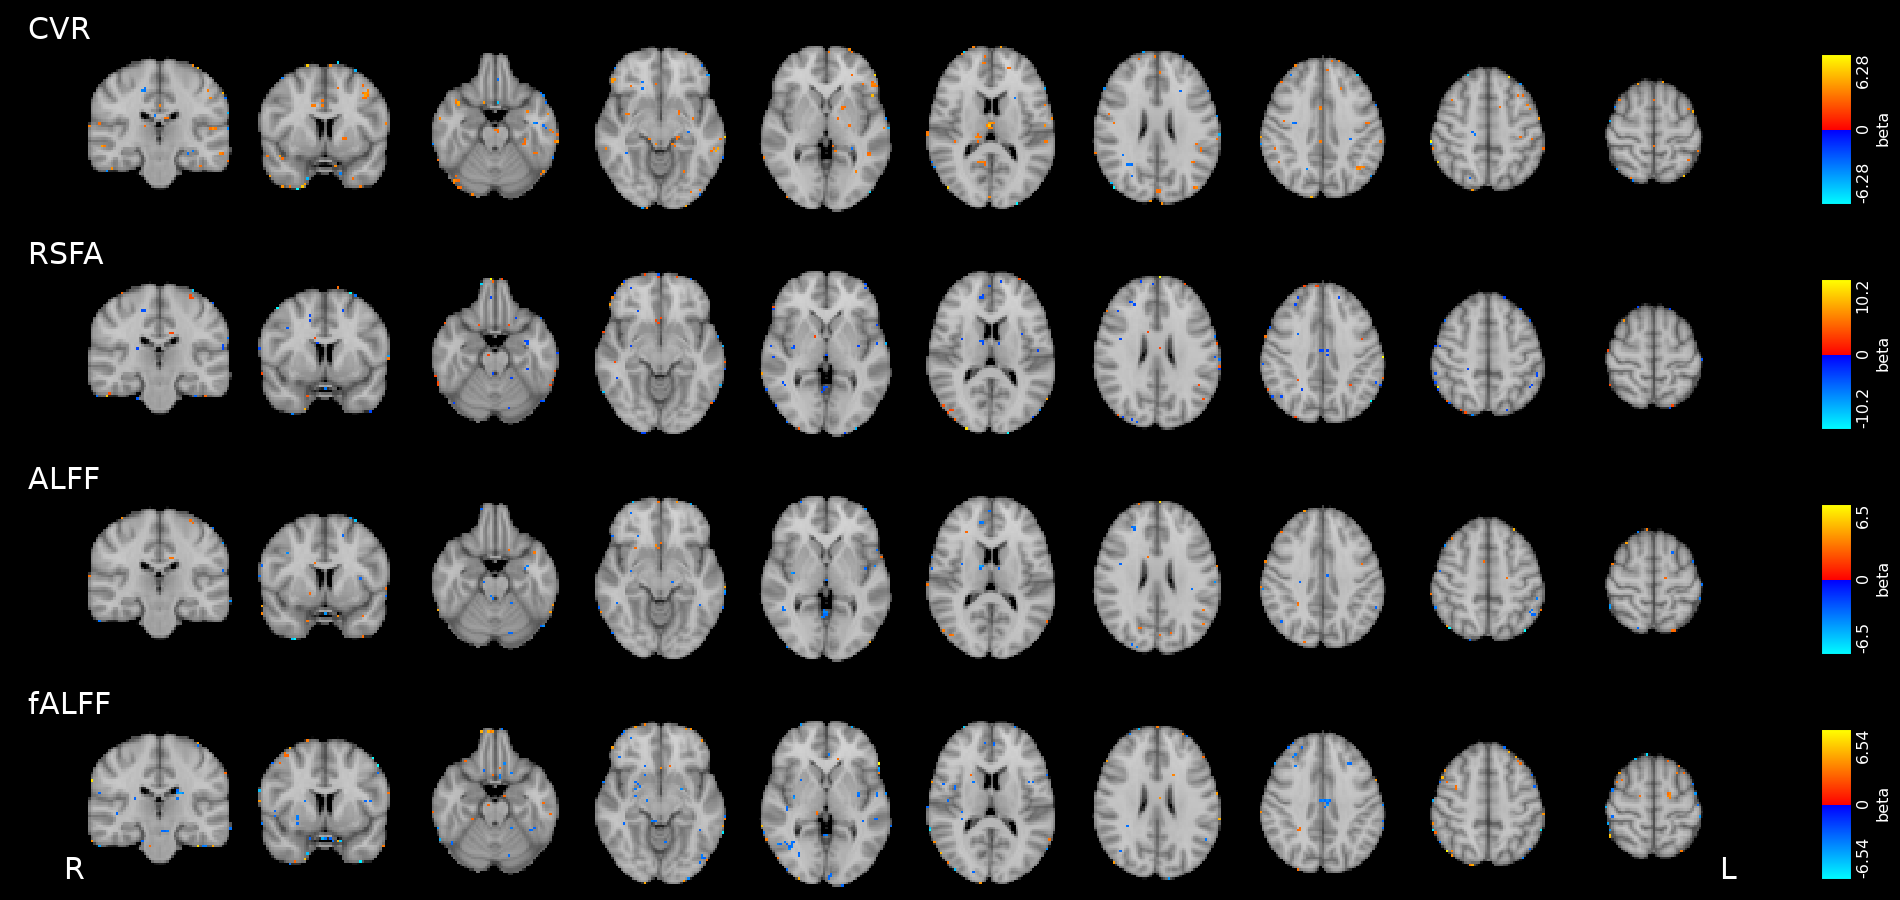
Results: CVR, RSF, and tasks (Simon, incongruent)
Results thresholded at \(p<0.001\) uncorrected
Physiology and RSF
We used 3dLMEr¹ to set up the following LME models (R syntax):
RSF \sim sex*(MAP+PP+pulse)+(1|ses)+((MAP+PP+pulse)|subj)
Effect of Sex
Only sex had a significant effect on RSF
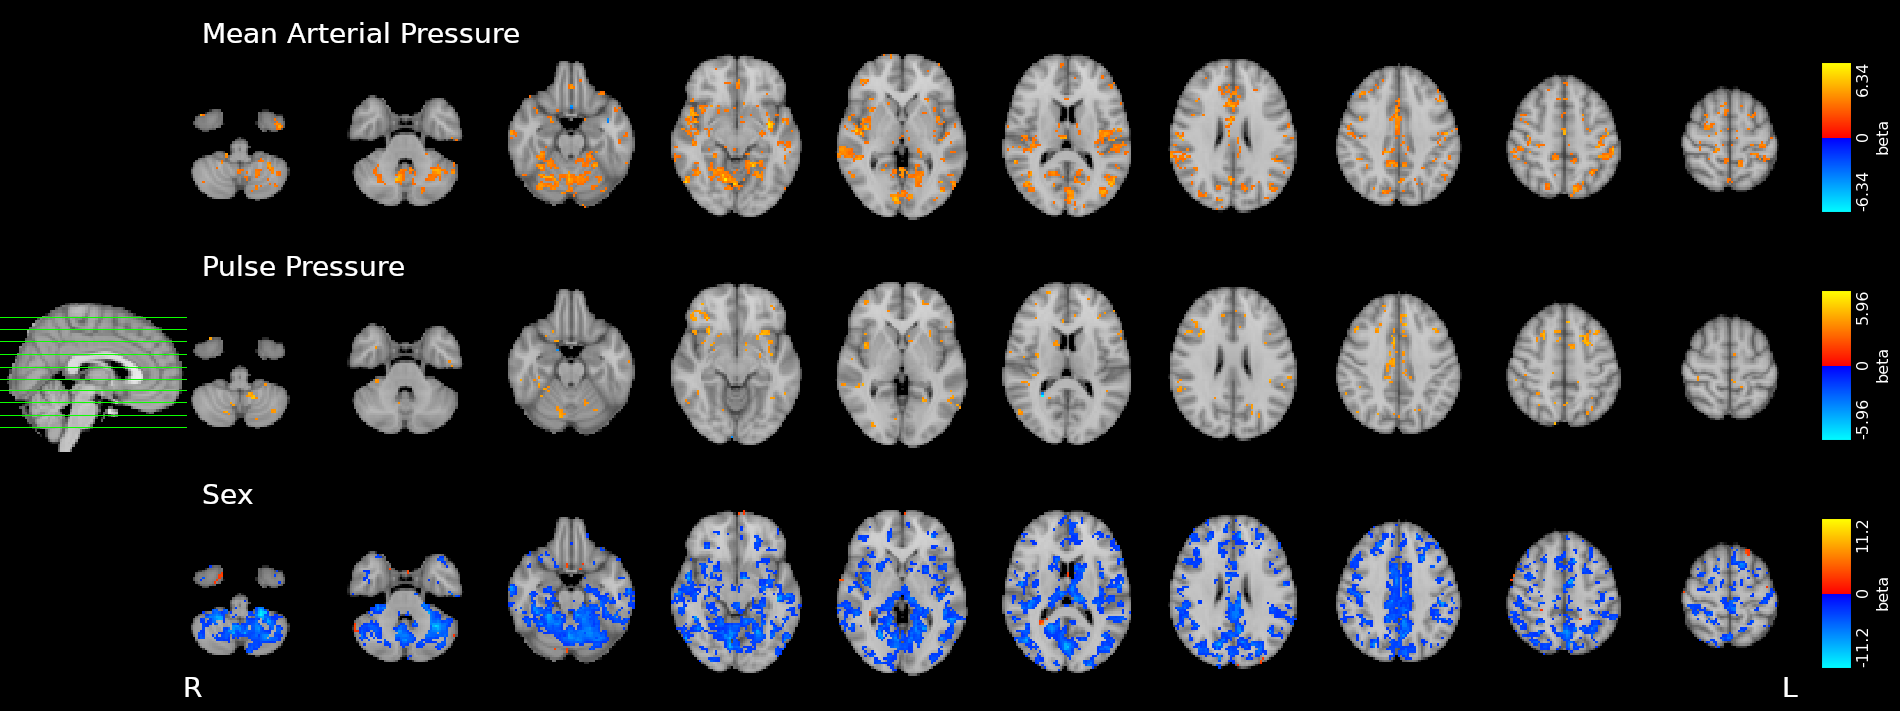
Effect on CVR
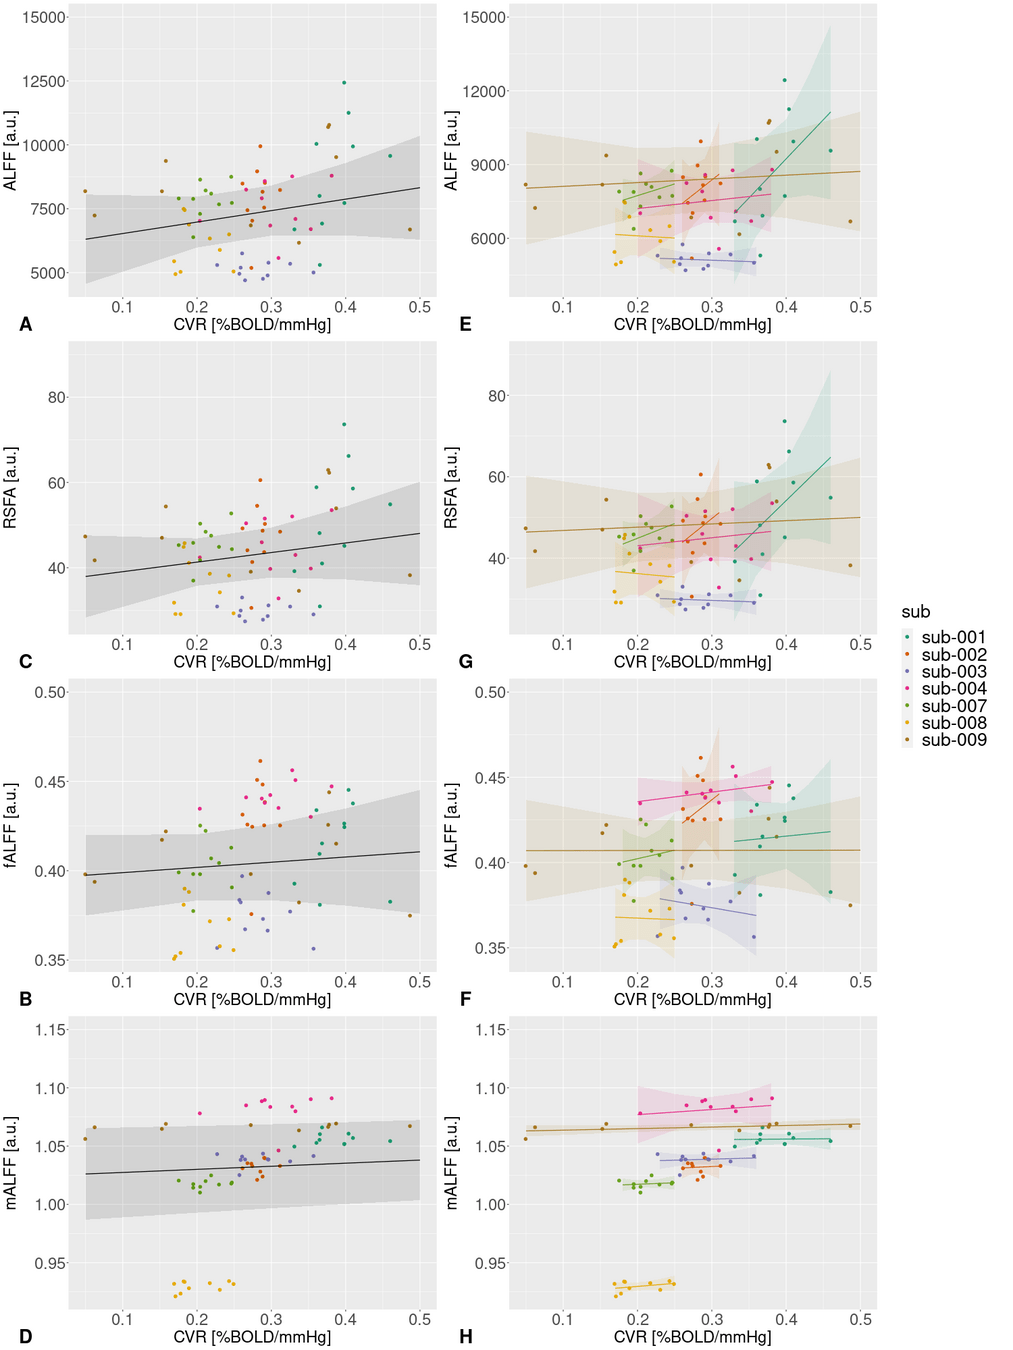
CVR and Resting States Fluctuations
- Resting State Fluctuations (RSF) agree with CVR in cross-section studies¹
- RSF do not agree strongly with CVR in a dense mapping study²
- RSF might be more related to Neurovascular Coupling than to CVR³
1. Golestani et al., 2016 (Neuroimage), Chen et al., 2023 (bioRxiv); 2. Moia et al., 2024 (bioRxiv); 3. Bailes et al., 2023 (eLife)
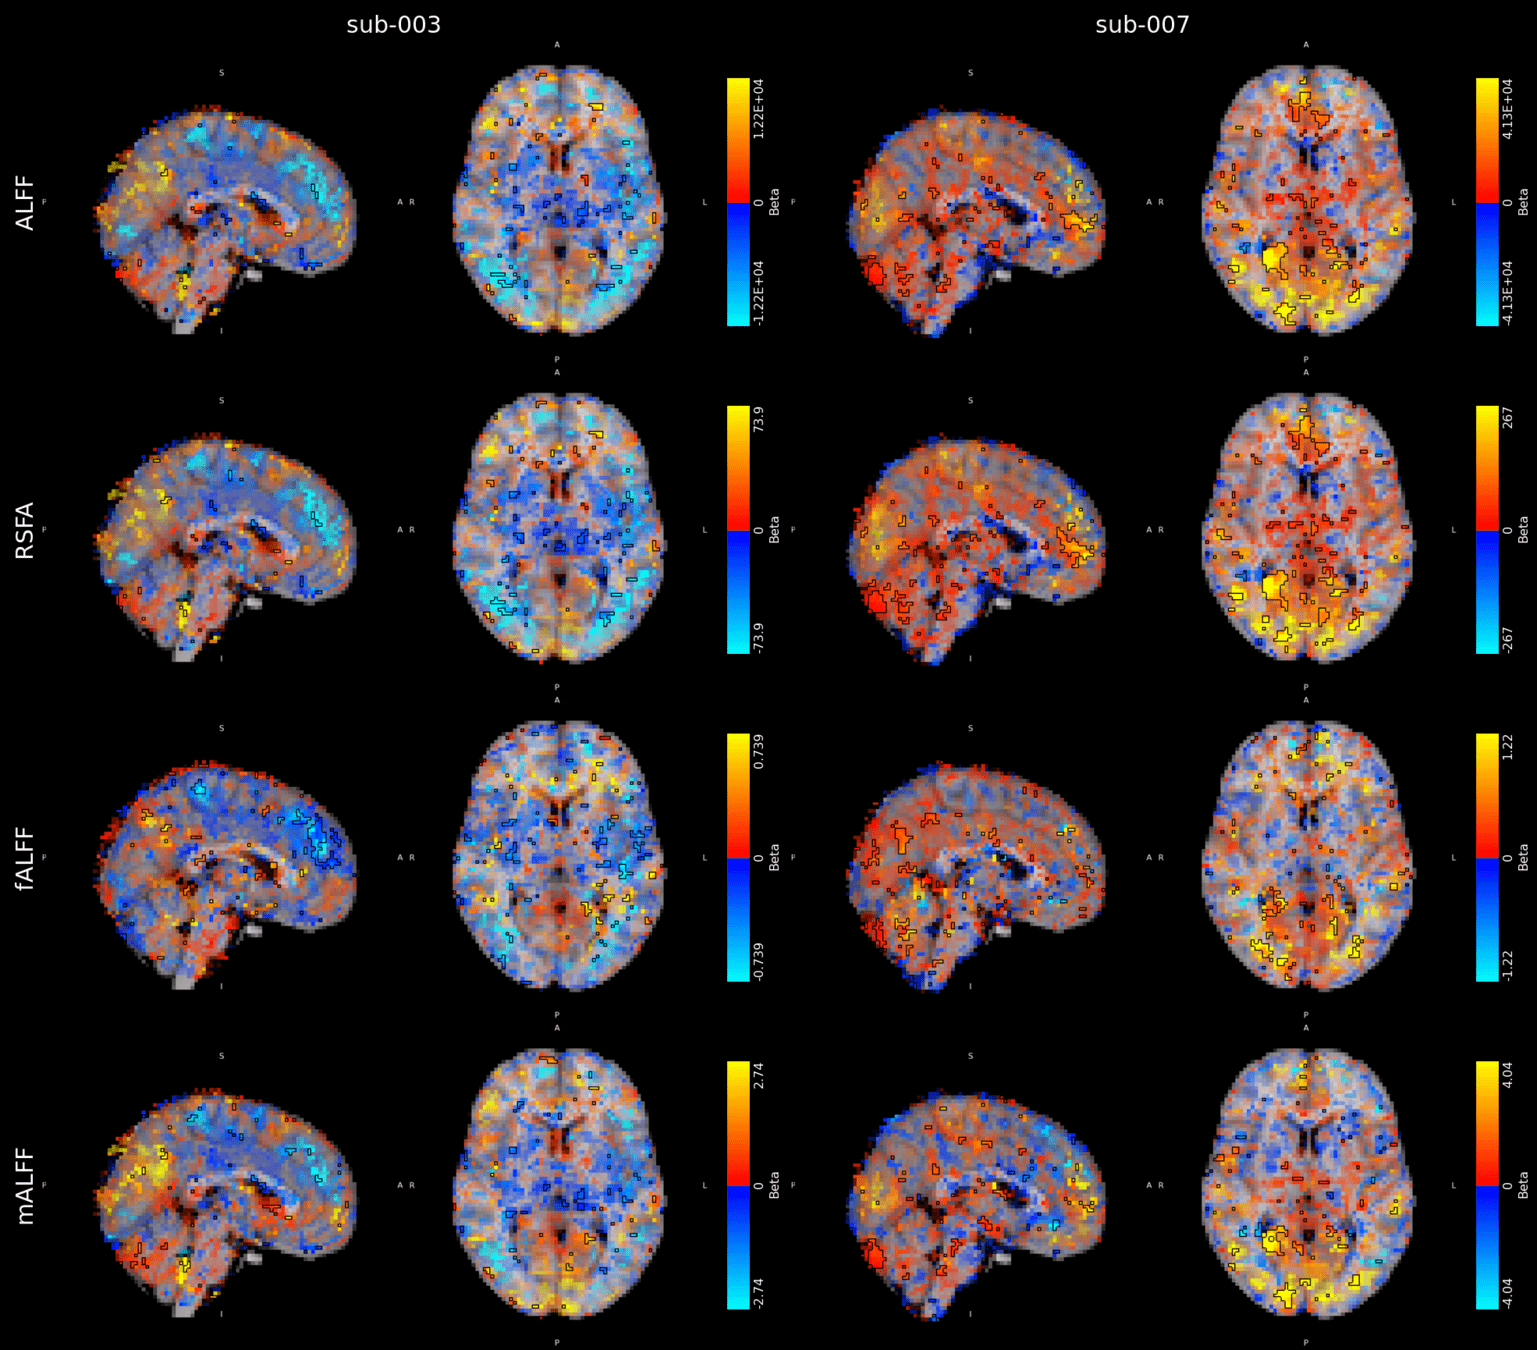
Alternative CVR estimation?
Alternative CVR estimation
- In the same cohort, we selected the most idiosyncratic connections at rest (i.e. \(ICC[1,1] \geqslant P_{99}ICC\)) and we used them to explain the incongruent effect Response Time (RT) in the Simon task
- We observe the same subject-specific relationship between FC and RT
Idiosyncratic functional connectivity and behaviour
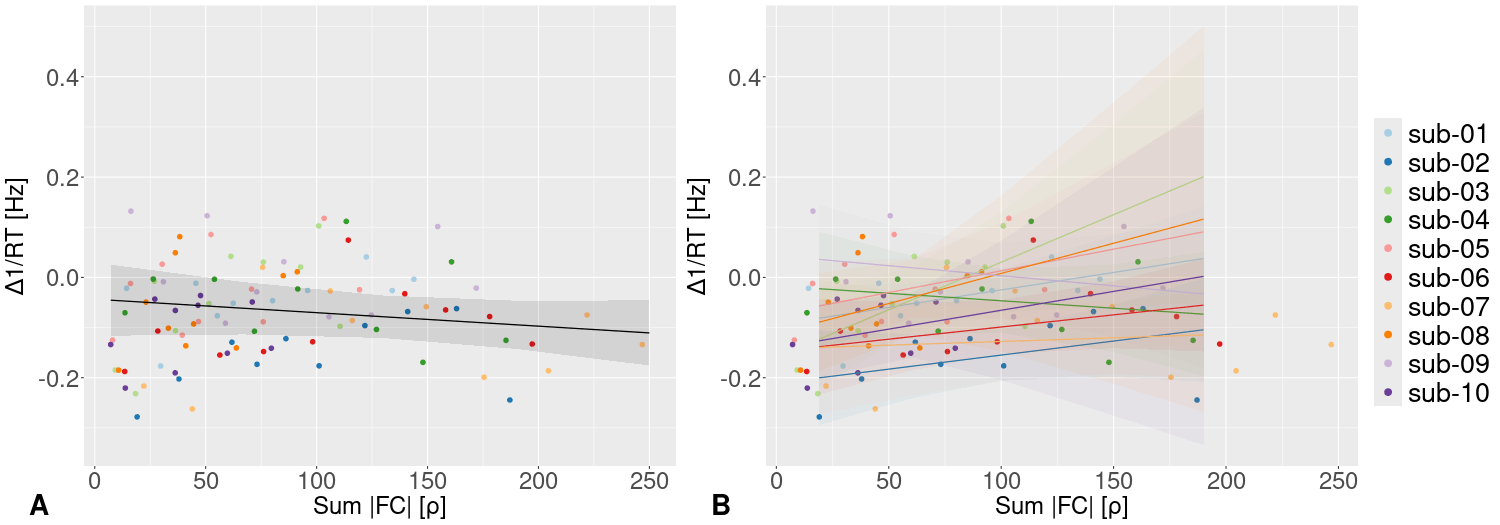
Take home #4
Inter-individual variability reveals variable relationships between CVR and
BOLD fluctuations at rest (Neurovascular Coupling)
as well as between the latter and behaviour.
Vessels
and
Multimodal Imaging
Physiological and vascular networks
BOLD-based fMRI, in conjunction with physiological signals, reveals the existence of physiological and vascular brain networks¹.
1. Bright et al. 2020 (NeuroImage), Chen et al., 2020 (NeuroImage)
- Subject-wise analyses on Breath-Holds
- Data driven algorithms (Self-Organising Maps) to cluster voxels in 15 partitions
Physiological and vascular networks in EuskalIBUR
SOM result, single subject
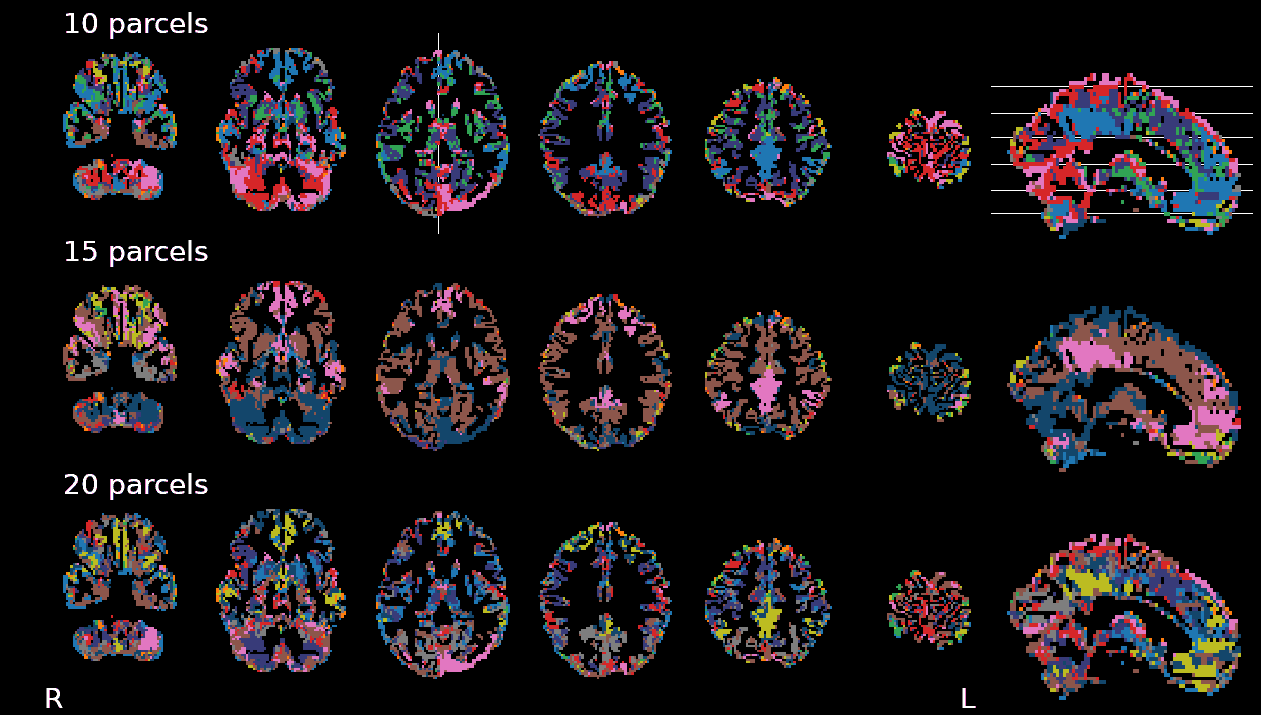
[adapted from] Moia et al. 2021 (Neuroimage)
Respiratory
challenges
Physiological networks
Impact of vessels on structural and functional connectivity
INDIVIDUAL (NSD)
GROUP (HCP)
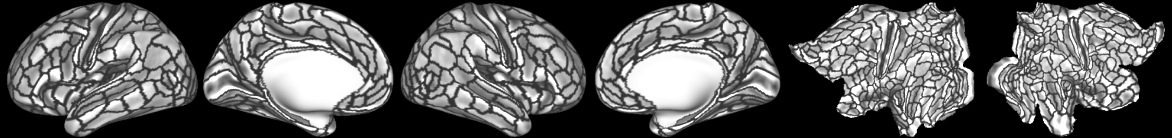
1. Allen et al., 2022 (Nat. Neurosci.) 2. Glasser et al., 2013 (NeuroImage); 3. Huck et al., 2019 (Brain Struct. Func.)
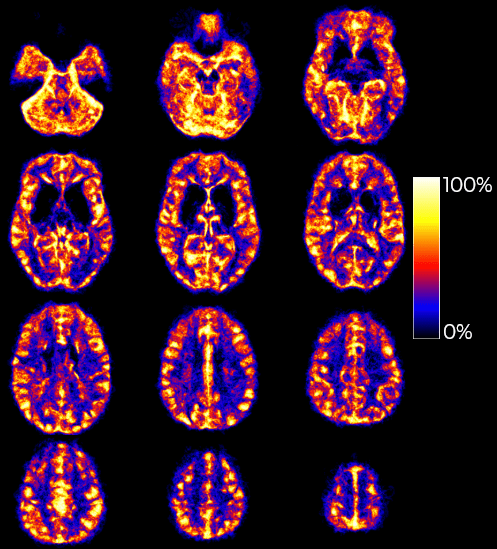
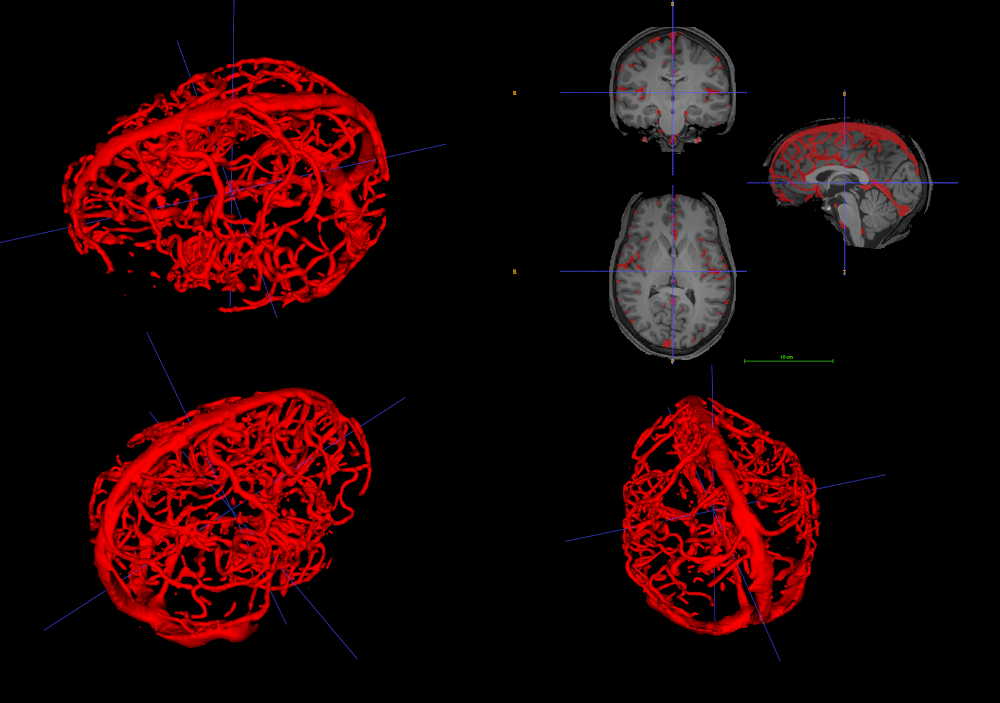
Natural Scenes Dataset (NSD)¹ (T1w, T2w, ToF)
Human Connectome Project (HCP)² and the VENAT atlas³
Impact of vessels on structural and functional connectivity
GROUP & INDIVIDUAL
INDIVIDUAL
Impact of vessels on structural and functional connectivity
1. Glasser et al., 2016 (Nat.); 2. Moia er al., 2023 (Zenodo)
GROUP (HCP)
INDIVIDUAL (NSD)
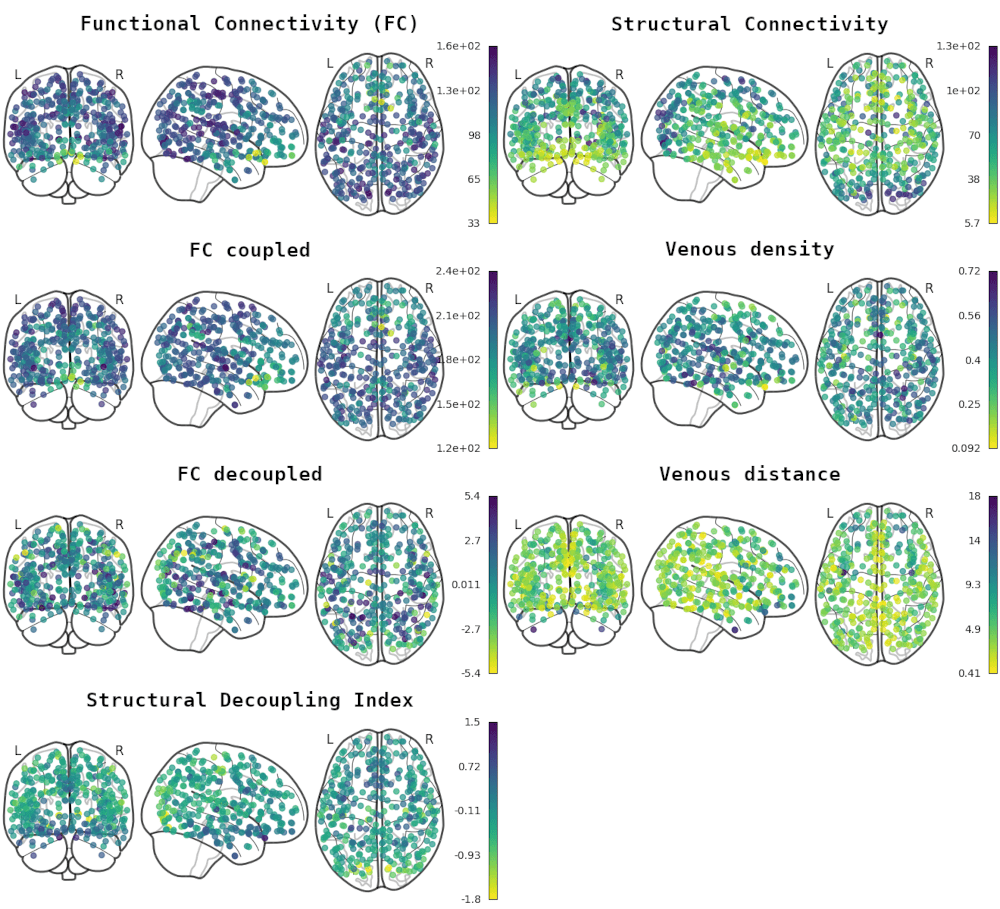
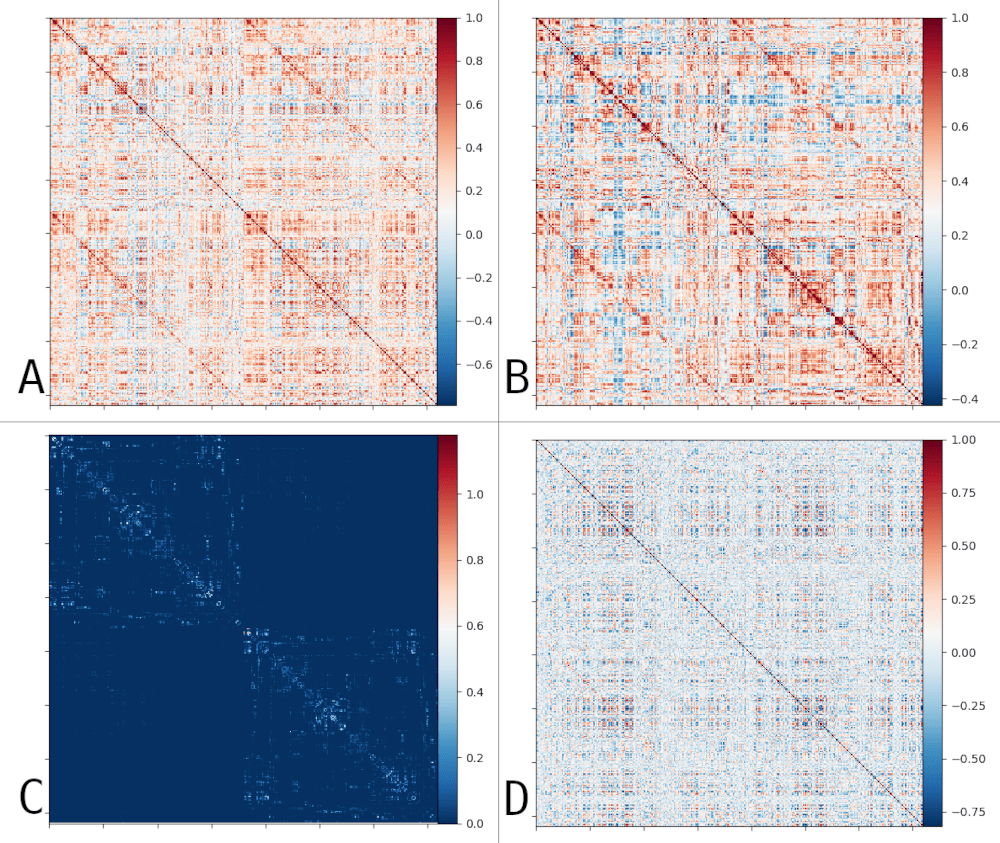
Functional Connectivity
Structural
Connectivity
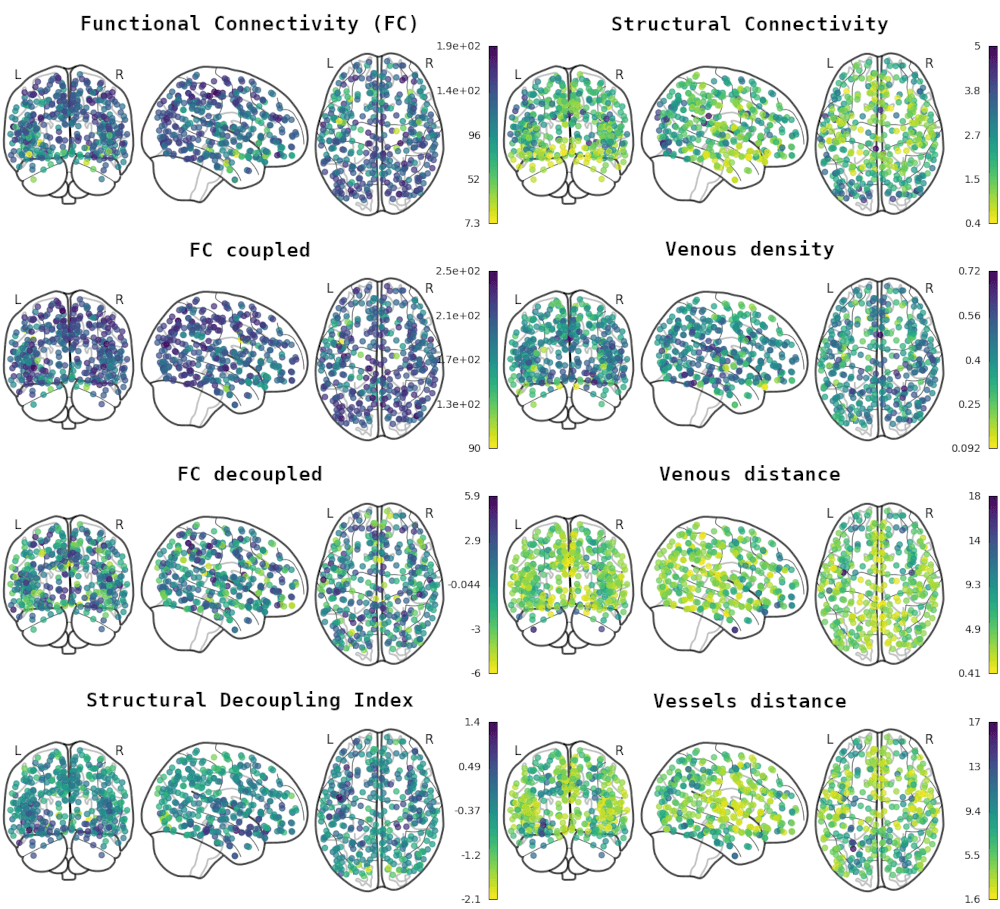
Impact of vessels on structural and functional connectivity
1. Griffa et al., 2022 (NeuroImage), Moia er al., 2023 (Zenodo), Preti & Van De Ville, 2019 (Nat. Commun.)
GROUP (HCP)
INDIVIDUAL (NSD)
Functional Connectivity
Structurally-coupled FC¹
Structurally-decoupled FC¹
Impact of vessels on structural and functional connectivity
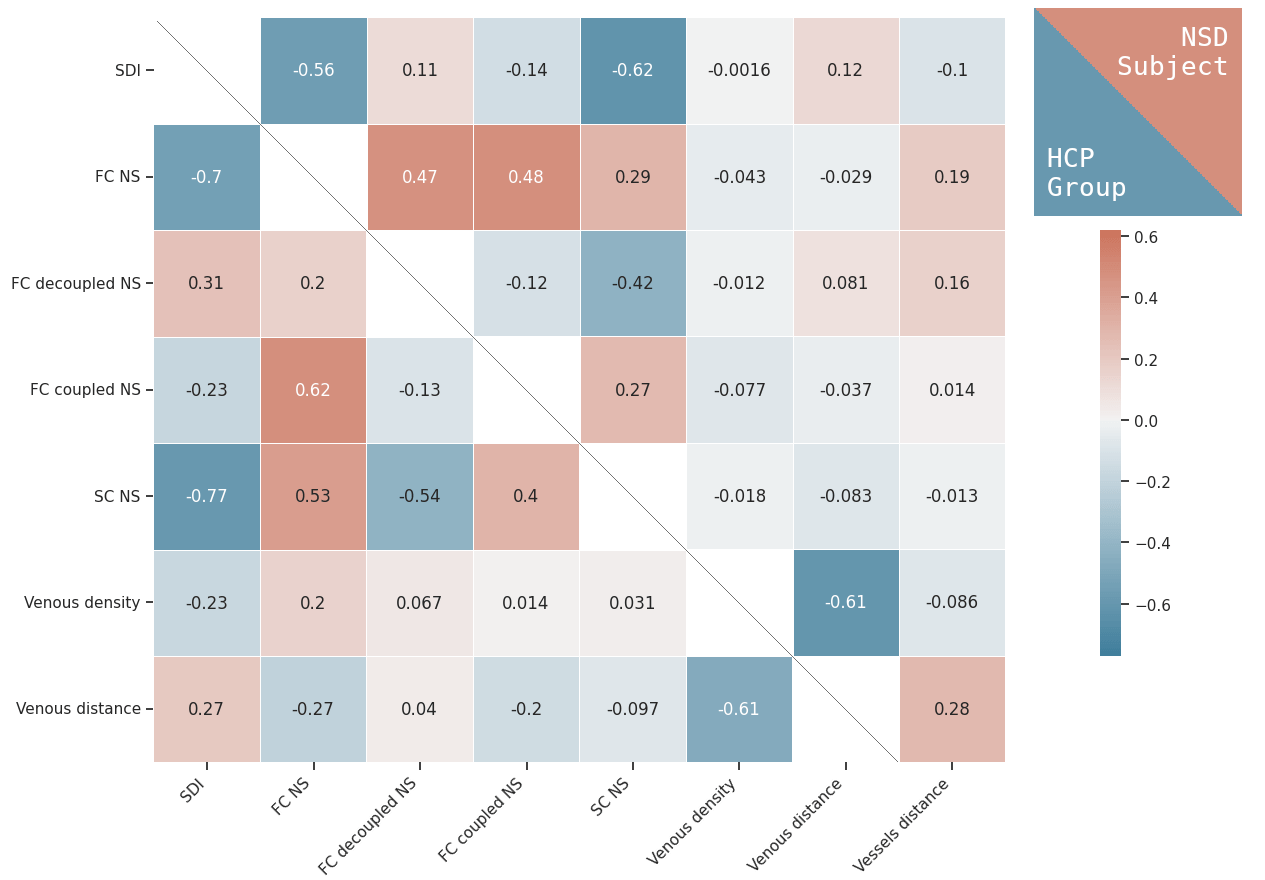
GROUP
INDIVIDUAL
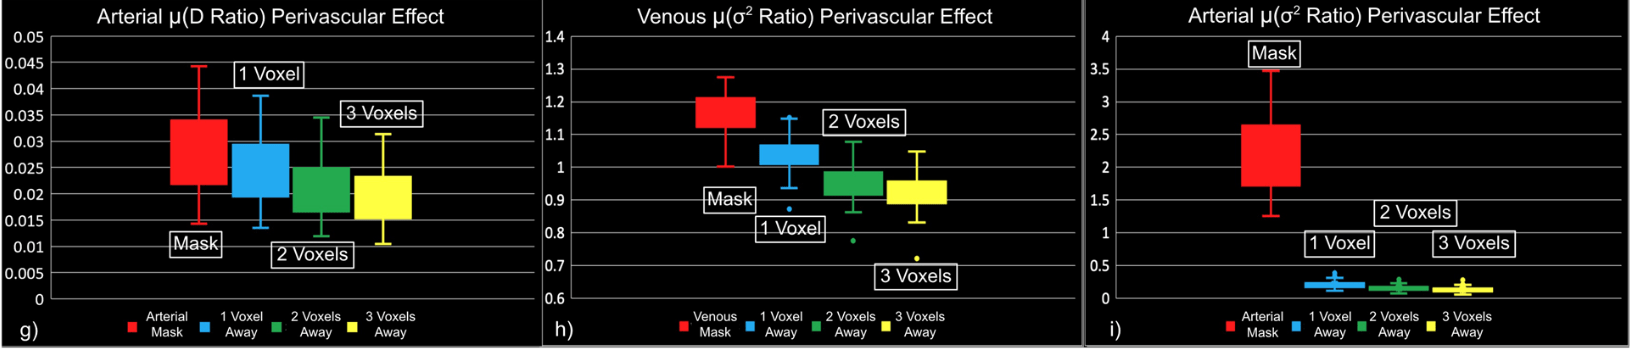
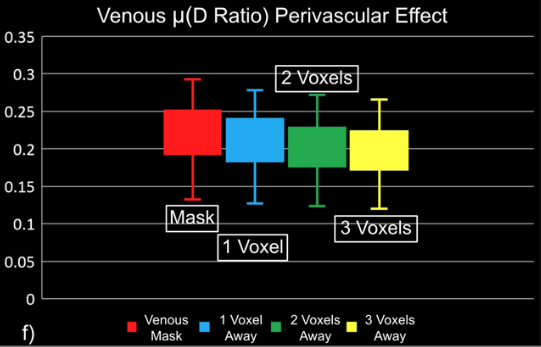
Impact of vessels on structural and functional connectivity
- Weak correlation between vascular properties and structural and functional connectivity at the group level
- Negligible correlation at the individual level, and weak correlation with vessel distance
- Analysis limited to macro scale vessels and non-pial veins.
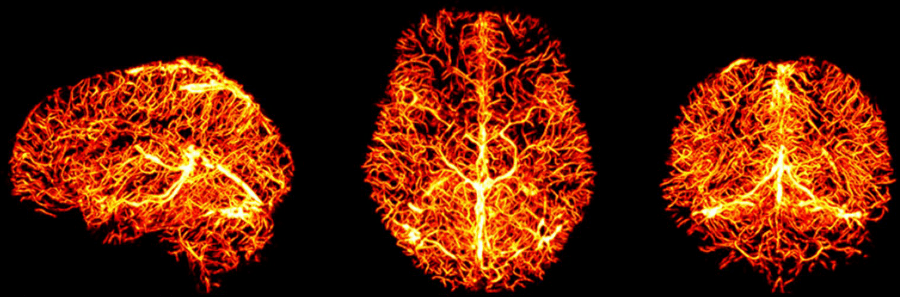
"Static" physiology: vessels
1. Gulban et al., in prep., Gulban et al., 2025 (bioRxiv), image courtesy of Faruk Gulban; 2. Zhong et al., 2024 (Imaging Neurosci.)
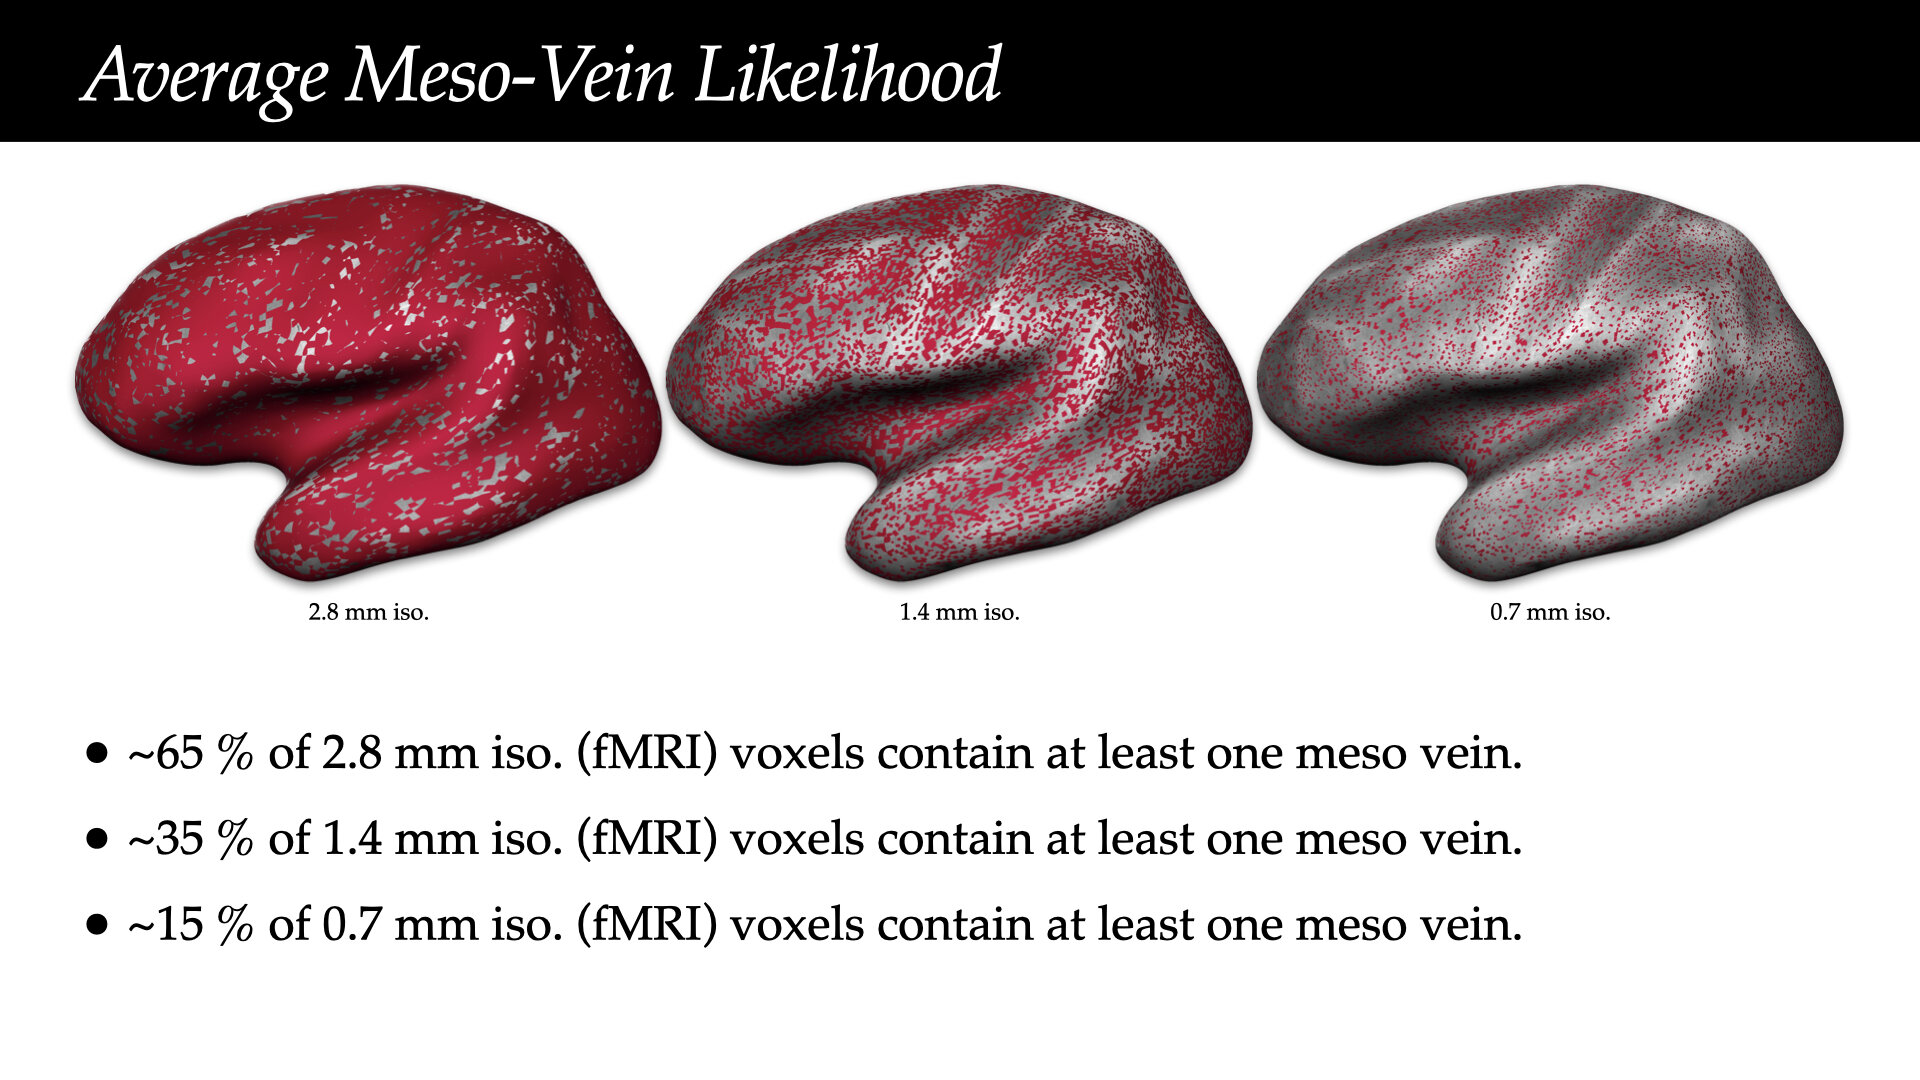
- Meso-scale vessels introduce partial volumes effects
in the grey matter¹ - Macro-scale vessels affect connectivity
in the grey matter²
Take home #5
Macro- (and Meso-) scale vessels affect local (but not global) fluctuations in BOLD responses.
Working with Physiology
Physiopy in a nutshell
A set of easily adoptable toolboxes
Community of users, developers, and researchers interested in physiology
Clear and approachable documentation
Community practices based on consensus
physiopy
Raw data
BIDSification
phys. data preprocessing
(peak detect.)
physiopy's documentation
&
phys. denoising
phys. imaging
BIDS Extension Proposal
Physiopy's Community Practices
QA/QC

| github.com/physiopy | |
| physiopy.github.io physiopy-community-guidelines.rtfd.io |
|
| physiopy.community@gmail.com s.moia.research@gmail.com |
- Toolboxes guarantee reproducibility even in presence of manual steps
- Community guidelines guide new (and old) users in improving the quality and usage of physiological signals in neuroimaging
| physiopy-community-guidelines.rtfd.io |
That's all folks!

Part of this research is supported by the European Union’s Horizon Europe research and innovation programme under the Marie Skłodowska-Curie grant agreement No 101109770


Part of this research supported by the Eunice Kennedy Shriver National Institute of Child Health and Human Development of the National Institutes of Health under award number K12HD073945, the European Union’s Horizon 2020 research and innovation program (Marie Skłodowska-Curie grant agreement No. 713673), a fellowship from La Caixa Foundation (ID 100010434, fellowship code LCF/BQ/IN17/11620063), the Spanish Ministry of Economy and Competitiveness (Ramon y Cajal Fellowship, RYC-2017- 21845), the Spanish State Research Agency (BCBL “Severo Ochoa” excellence accreditation, SEV- 2015-490), the Basque Government (BERC 2018-2021 and PIBA_2019_104), the Spanish Ministry of Science, Innovation and Universities (MICINN; FJCI-2017-31814)


Any question [/opinions/objections/...]?
| smoia | |
| @SteMoia | |
| s.moia.research@gmail.com |

Stefano Moia, 2025
Find the presentation at:
slides.com/smoia/you-re-not-a-brain-in-a-vat-ncku/scroll

You're not a brain in a vat [NCKU]
By Stefano Moia
You're not a brain in a vat [NCKU]
CC-BY 4.0 Stefano Moia, 2025. Images are property of the original authors and should be shared following their respective licences. This presentation is otherwise licensed under CC BY 4.0. To view a copy of this license, visit https://creativecommons.org/licenses/by/4.0/