B-DC 221
Computation in Design
Information Design Project
2020
Week 1
Computation in Design
Data and Code
B-DC 221
Computation in Design
Information Design Project
2020
The guiding principle behind this project is the transformation of numerical data through code and design into visual infor-mation and knowledge.
The Project
When we look at data, we see numbers and complexity that are often inaccessible to the layman. The challenge for a designer is to propose ideas and solutions to how data can be transformed from its raw format into a simple, elegant form in order to synthesise and reveal insights conveyed through meaningful narrative and experience.
In a series of exercises and followed by an individual project, students learn, analyse, visualise and interpret data using a number visualisation techniques and existing or self-generated datasets.
B-DC 221
Computation in Design
Information Design Project
2020
(De)coding Data
Briefing + 4 sessions +
Open Consultation
The Project
(De)coding Data is a self-directed project in which students start from a selected or generated data set to develop visual representations that provide access to and insights into the hidden patterns, details, information and structures of meaning that the dataset can reveal.
Week 8 – 13
B-DC 221
Computation in Design
Information Design Project
2020
Week 1
The Project

Mix of media
Modular
Static/dynamic
Weekly sessions
9
on-campus
(De)coding Data
Project
10
on-campus
(De)coding Data
Project
11
on-campus
(De)coding Data
Project
B-DC 221
Computation in Design
Information Design Project
2020
Project Briefing
In class work and development.
Students to share their project progress
12
on-campus
(De)coding Data
Project
In class work and development.
Feedback and consultation.
In class work and development.
Feedback and consultation.
Weekly sessions
5
on-campus
Data and Code 3
6
on-campus
Data and Code 4
7
on-campus
Data and Code 5
Mouse and keyboard Interactions, in class workshop and activity
To engage with running code interactively
Exercise from week 6 continues.
B-DC 221
Computation in Design
Information Design Project
2020
Reading and displaying Data, in class workshop and activity
To apply simple and elegant aesthetics to a data set
Students to share their progress
8
on-campus
Data and Code 6
Review
Weekly sessions
2
online
Data and Code 1
3
on-campus
Data and Code 1
4
on-campus
Data and Code 2
Code Basics, in class workshop and activity
To develop an understanding of code principles
Review session 1 & 2
B-DC 221
Computation in Design
Information Design Project
2020
Data Processing, in class workshop and activity
To practice formatting, processing and displaying data with code
Weekly sessions
5
on-campus
Data and Code 3
6
on-campus
Data and Code 4
7
on-campus
Data and Code 5
Mouse and keyboard Interactions, in class workshop and activity
To engage with running code interactively
Data in Motion, in class workshop and activity
To apply movement to data over time
Students to share their progress
B-DC 221
Computation in Design
Information Design Project
2020
8
on-campus
Data and Code 6
Review
Data Aesthetics, in class workshop and activity
To apply simple and elegant aesthetics to a data set
B-DC 121
2020
Independent Learning
Make use of resources shared in class
Learn from resources online and the library
Study, learn, practice with classmates
Experiment and practice continuously
Getting stuck
Computation in Design
Information Design Project
B-DC 221
2020
Computation in Design
Information Design Project
Guided
Learning
Data and Code
Independent
Applied
(De)coding Data
B-DC 221
2020
10,000 vs 20
– How long does it take to acquire a new skill?
Computation in Design
Information Design Project
B-DC 221
2020
10,000 vs 20
Break down a skill into its components
Learn enough to know when you are making a mistake
Remove any and all barriers to practice
Practice at least for 20 hours
Computation in Design
Information Design Project
B-DC 221
2020
10,000 vs 20
The Expert
The Curious

Computation in Design
Information Design Project
B-DC 221
2020
Week 1


Computation in Design
Information Design Project
B-DC 221
2020
Computation in Design
Information Design Project
#creativecodeart
#generativedesign
Inspiration, what others are doing.
B-DC 221
2020
Computation in Design
Information Design Project
References for Week 3
What others are doing with data and code.
Moritz Stefaner
Moritz Stefaner lives and breathes data visualization as an independent designer, consultant and researcher.
He helps organizations, researchers and businesses to find truth and beauty in relevant and meaningful data.
Senseable City Lab
The Senseable City Laboratory, a research initiative at the Massachusetts Institute of Technology, looks at the transformation of cities through design, science and data.
Giorgia Lupi
Giorgia Lupi is an information deisgner and a partner at Pentagram advocating for Data Humanism.
She is the co-author of Dear Data, a year-long analog data drawing project.


B-DC 221
2020
Computation in Design
Information Design Project
Visualizing Data
Dataviz Project
The Dataviz Project is a website trying to present all relevant data visualizations, so you can find the right visualization and get inspired how to make them.
By ferdio, an infographic and data visualization agency in Copenhagen.
Information is Beautiful
B-DC 221
2020
Week 1
Computation in Design
Information Design Project


B-DC 221
2020
Computation in Design
Information Design Project
Data and Code
– The objective of the Data and Code exercises is to introduce basic coding concepts and to then translate numeric data into a series of coded data visualisations.
week 2 – 6
B-DC 221
2020
Computation in Design
Information Design Project
Data and Code
Weekly overview
Overview
B-DC 221
2020
Computation in Design
Information Design Project
Data and Code
Weekly overview: archived
Overview
B-DC 221
2020
Week 1
Computation in Design
Information Design Project
Introduction to Code
The Sketch
Week 1
B-DC 221
2020
Week 1
Computation in Design
Information Design Project
Introduction to Code
The Canvas
Width
Height
Origin
0 / 0
B-DC 221
2020
Week 1
Computation in Design
Information Design Project
Shapes
B-DC 221
2020
Week 1
Computation in Design
Information Design Project
Coding Tufte and Albers
In the following you will find a series of images taken from Edward Tufte's Visual Display of Quantitative Information and the exhibition catalog for Anni Albers at the Tate Modern. Let's re-create some of them using code.
Hand out briefing document
B-DC 221
2020
Week 1
Computation in Design
Information Design Project
Coding Tufte and Albers


beginShape
endShape
fill
vertex
fill
rect
1
2
B-DC 221
2020
Week 1
Computation in Design
Information Design Project
Coding Tufte and Albers


ellipse
for-loop
random
stroke
strokeWeight
fill
for-loop
if else
pop
push
random
translate
triangle
3
4
B-DC 221
2020
Week 1
Computation in Design
Information Design Project
Coding Tufte and Albers


beginShape
endShape
stroke
vertex
beginShape
bezierVertex or curveVertex
endShape
stroke
5
6
B-DC 221
2020
Week 1
Computation in Design
Information Design Project
Coded solution for
Coding Tufte and Albers

beginShape
endShape
fill
vertex
1
A solution for 1
B-DC 221
2020
Week 1
Computation in Design
Information Design Project
Coded solution for
Coding Tufte and Albers
beginShape
endShape
stroke
text
vertex
5
A solution for 5

B-DC 221
2020
Week 1
Computation in Design
Information Design Project

ellipse
for-loop
random
stroke
strokeWeight
A solution for 3
3
Coded solution for
Coding Tufte and Albers
B-DC 221
2020
Week 1
Computation in Design
Information Design Project

fill
for-loop
if else
pop
push
random
translate
triangle
4
A solution for 4
Coded solution for
Coding Tufte and Albers
B-DC 221
2020
Week 2
Computation in Design
Information Design Project
Editor checklist
Week 2
Did you create an account?
When logged in with your account you are able to
– save
– duplicate
– load
sketches.

Sketch URL
Sketch name
Open, save, duplicate
Canvas
B-DC 221
2020
Week 2
Computation in Design
Information Design Project
Data and Code 1
Transformations
Variables
Arrays
Loops
Week 2
B-DC 221
2020
Week 2
Computation in Design
Information Design Project
Recap Shapes
Week 2
B-DC 221
2020
Week 2
Computation in Design
Information Design Project
Data and Code 1
Transformations
Your p5js canvas works like a piece of graph paper. When you want to draw something, you specify its coordinates on the graph. Here is a simple rectangle drawn with the code rect(20, 20, 40, 40)


If you want to move the rectangle 60 units right and 80 units down, you can just change the coordinates by adding to the x and y starting point: rect(40 + 60, 40 + 80, 40, 40) and the rectangle will appear in a different place.
But there is a more interesting way to do it: move the graph paper (the coordinate-system) instead. If you move the graph paper 60 units right and 80 units down, you will get exactly the same visual result. Moving the coordinate system is called translation.

push();
translate(60,80);
rect(20,20,40,40);
pop();rect(20,20,40,40);Transformations let you group visual elements enclosed within push() and pop(). All elements inside this group can be moved translate(), rotated rotate() and scaled scale() at once and together.
B-DC 221
2020
Week 2
Computation in Design
Information Design Project
Data and Code 1
Transformations
function setup() {
  createCanvas(400,400);
}

function draw() {
  // draw a rectangle by translating
  // the origin to location 80,100
  push();
  translate(80,100);
  rect(0,0,40,40);
  pop();
}
Benefits
Lets you group visual elements enclosed within push() and pop(). All elements inside this group can be moved translate(), rotated rotate() and scaled scale() at once and together.
B-DC 221
2020
Week 2
Computation in Design
Information Design Project
Data and Code 1
Variables
// declare a variable
let val;
// assign value 0 to variable val
val = 0;
// make changes to val
val = val + 1; // increases val by 1
// (val was 0 then we add 1 so val is now 1)
Variables are containers that store values. You start by declaring a variable with the let keyword, followed by the name you give to the variable. (sometimes you might see the keyword var which is similar to let but let is preferred)
B-DC 221
2020
Week 2
Computation in Design
Information Design Project
Data and Code 1
Variables
Commands
// declare a global variable with name val
// a global variable can be accessed
// from anywhere here
let val;

function setup() {
  // assign value 0 to variable val
  val = 0
}

function draw(){
  // increase the value of val
  // by 1 for each frame and assign
  // this new value to variable val
  val = val + 1;
}
Benefits
Lets you store a value (number, string, letter, boolean, etc.) in memory, assigned to a name, which you can then query and change while the program is running.
B-DC 221
2020
Computation in Design
Information Design Project
Data and Code 1
Arrays
// declare a variable
let arr;

// assign array to variable arr
arr = [];

// assign an array with predefined values
arr = [10,20,30,40];

// read a value from arr at index 0
// program will replace arr[0] with 10
// (arrays start counting from 0)
rect(arr[0], 10, 50, 50);
An Array is a storage containers for a list of values. Each element of data in an array is identified by an index number representing its position in the array. Arrays are zero based, which means that the first element in the array is [0], the second element is [1], and so on.
B-DC 221
2020
Computation in Design
Information Design Project
Data and Code 1
Arrays
Benefits
Compared to a variable with a single value, Arrays are special variables that can store multiple values as a list. When working with data this is very useful.
// declare an array with name arr
let arr;

function setup() {
  // assign an array and initialise
  // with 3 numbers
  arr = [20,40,60];
  // console.log prints the array and the number
  // of elements contained into the console
  console.log(arr, arr.length);
}

function draw(){
  rect(20, arr[0], 50, 10);// read at index 0
  rect(20, arr[1], 50, 10);// read at index 1
  rect(20, arr[2], 50, 10);// read at index 2
}B-DC 221
2020
Computation in Design
Information Design Project
Data and Code 1
Arrays: alternatively use push to add values
// declare an array with name arr
let arr;

function setup() {
  // assign an empty array to arr
  arr = [];
  arr.push(20); // add 1st value
  arr.push(40); // add 2nd value
  arr.push(60); // add 3rd value
  // print the array and the number of
  // elements contained into the console
  console.log(arr, arr.length);
}

function draw(){
  rect(20, arr[0], 50, 10);// query value at 0
  rect(20, arr[1], 50, 10);// query value at 1
  rect(20, arr[2], 50, 10);// query value at 2
}Benefits
Compared to a variable with a single value, Arrays are special variables that can store multiple values as a list. When working with data this is very useful.
B-DC 221
2020
Computation in Design
Information Design Project
Data and Code 1
Loops
for(let i=0; i<10; i++) {
  rect(20, i*10, 60, 5);
}
The basic functionality of a for loop:
A for loop allows us to execute code multiple times in a row by incrementing (or decrementing) a variable – often called i – until an expression is no longer true and the loop stops.
In the above example, we initialise a variable with the number 0, iterate as long as our variable is lower than 10, and increment our variable by one between each iteration. The result is a loop that iterates ten times with our variable incrementing from zero to nine, drawing ten rectangles on the screen.

B-DC 221
2020
Computation in Design
Information Design Project
Data and Code 1
Loop
for(let i=0; i<10; i++) {
  rect(20, i*10, 60, 5);
}
rect(20, 0, 60, 5);
rect(20, 10, 60, 5);
rect(20, 20, 60, 5);
rect(20, 30, 60, 5);
rect(20, 40, 60, 5);
rect(20, 50, 60, 5);
rect(20, 60, 60, 5);
rect(20, 70, 60, 5);
rect(20, 80, 60, 5);
rect(20, 90, 60, 5);No Loop
B-DC 221
2020
Computation in Design
Information Design Project
Data and Code 1
Loops
Commands
// declare an array with name arr
let arr;

function setup() {
  createCanvas(400,400);
  // assign an empty array to arr
  arr = [];
  // use a loop to populate array once
  for(let i=0; i<10; i++) {
    arr.push(random(100)); // add ith value
  }
  // print the array into the console
  console.log(arr, arr.length);
}

function draw(){
  for(let i=0; i<arr.length; i++) {
    // use i*20 to stack rects vertically
    rect(20, i*20, arr[i], 10);
  }
}
B-DC 221
2020
Computation in Design
Information Design Project
Data and Code 1
Nested Loops
function setup() {
  createCanvas(400,400);
}

function draw(){
  // draw a grid of 10x10 rectangles
  for(let i=0; i<10; i++) {
    for(let j=0; j<10; j++) {
      // use translate transformation
      // to position rectangles
      push();
      translate(i*20, j*20);
      rect(0, 0, 10, 10);
      pop();
    }
  }
}
Commands

B-DC 221
2020
Computation in Design
Information Design Project
Data and Code 1
Exercise
1 Shape, Repetition, Transformation
2 Array, Loop, Graph


B-DC 221
2020
Computation in Design
Information Design Project
Data and Code 1
Exercise
1 Shape, Repetition, Transformation
The reference image to the right is taken from Ellen Lupton and Jennifer Cole Phillips book Graphic Design: the New Basics page 186-187 and looks at the repetition of simple visual elements/shapes.
Within your group, discuss which of the visual patterns in the reference image can be re-created using a for-loop and which requires a nested for-loop.
Re-create one of the patterns using a for-loop and one using a nested for-loop.
The coding concepts to use are addressed and outlined in the previous slides:
→ Shapes
→ Transformation
→ (nested) Loop
for-loop
shapes
transformations
variables
Each group member to keep a copy of the two sketches they created together and save them to their p5js sketch folder.
B-DC 221
2020
Computation in Design
Information Design Project
Data and Code 1
Exercise
2 Loop and Arrays
The website Dataviz Project provides a comprehensive overview of data visualisation types, some more complex than the other, but each with its own specific characteristics and purpose. To the right you see two charts taken from the website.
For this exercise we will focus on the bar chart and the line chart.
Within your group discuss and create a bar chart and a line chart in code for a dataset of 20 random numbers using the following concepts:
→ Shapes
→ Transformation
→ Array
→ Loop
for-loop
random
Array
beginShape
endShape
vertex
rect


Each group member to keep a copy of the two sketches they created together and save them to their p5js sketch folder.
B-DC 221
2020
Week 3
Computation in Design
Information Design Project
Data and Code 1 Revisited
Shapes
Transformations
Variables
Arrays
Loops
Week 3
B-DC 221
2020
Week 3
Computation in Design
Information Design Project
Week 3
Interactive 8-steps tutorial
Shapes
Transformations
Variables
Arrays
Loops
B-DC 221
2020
Week 3
Computation in Design
Information Design Project
2 Array, Loop, Graph
Week 3
Exercise 1 & 2 solutions


B-DC 221
2020
Computation in Design
Information Design Project
Week 3
What others are doing with data and code.
Moritz Stefaner
Moritz Stefaner lives and breathes data visualization as an independent designer, consultant and researcher.
He helps organizations, researchers and businesses to find truth and beauty in relevant and meaningful data.
Senseable City Lab
The Senseable City Laboratory, a research initiative at the Massachusetts Institute of Technology, looks at the transformation of cities through design, science and data.
Giorgia Lupi
Giorgia Lupi is an information deisgner and a partner at Pentagram advocating for Data Humanism.
She is the co-author of Dear Data, a year-long analog data drawing project.


B-DC 221
2020
Week 4
Computation in Design
Information Design Project
Data and Code 2
Week 4
Data
Arrays
Functions
In this session we will look at drawing graphs from data we read from a .csv file. We will use Google Spreadsheets to organise our data and export it to .csv format, Comma Separated Values, which we will load into p5js using loadTable.
We will then use p5js to read and visually display data using line, bar or donut graphs.

B-DC 221
2020
Week 4
Computation in Design
Information Design Project
Recap Week 3
Week 4
Shapes
Transformations
Variables
Arrays
Loops


B-DC 221
2020
Week 4
Computation in Design
Information Design Project
Data and Code 2
Week 4
Store and format data with Spreadsheets
Load data from file with p5js
Display data when loaded from file
Use functions to display data and better organise code
B-DC 221
2020
Week 4
Computation in Design
Information Design Project
Data and Code 2
Week 4
Store and format data with Spreadsheets
1. Google Spreadsheets walkthrough
2. What is csv
3. how to export to csv
A dataset is simply a collection of data. A simple and common format for datasets is a spreadsheet or a .csv formatted file. csv stands for Comma Separated Values and is very useful when reading datasets programmatically in code.
A .csv file has a simple structure, it is a list of data separated by commas. The simplicity of .csv files makes it fairly easy to parse the contained data into other code readable formats like arrays.
Why use Spreadsheets to edit or convert data?
Often data is provided as spreadsheets, it is the tool most are familiar with. See for example this rather detailed Covid-19 spreadsheet which contains many data sets addressing many different data points and formats, have a look (navigate to sheet The Fatality Rate Varies By Country for a daily breakdown of cases).
B-DC 221
2020
Week 4
Computation in Design
Information Design Project
Data and Code 2
Store and format data with Google Spreadsheets

Header
Rows
Columns
A Spreadsheet
B-DC 221
2020
Week 4
Computation in Design
Information Design Project
Data and Code 2
Store and format data with Google Spreadsheets
1. create a Google Spreadsheet
2. populate spreadsheet with data
3. export to csv
4. rename downloaded .csv file to data.csv
5. upload data.csv file to p5js sketch
6. run sketch
B-DC 221
2020
Week 4
Computation in Design
Information Design Project
Data and Code 2
From a spreadsheet to .csv

Spreadsheet
Comma Separated Values
.csv

B-DC 221
2020
Week 4
Computation in Design
Information Design Project
Data and Code 2
From a spreadsheet to .csv to code

Spreadsheet
Comma Separated Values
.csv
Code
p5js code and data printed into the console with


B-DC 221
2020
Week 4
Computation in Design
Information Design Project
Data and Code 2
Load data from file with p5js
1 open dropdown menu


2 upload file
B-DC 221
2020
Week 4
Computation in Design
Information Design Project
Data and Code 2
Functions
Organise code with functions to better handle drawing procedures
B-DC 221
2020
Week 4
Computation in Design
Information Design Project
Data and Code 2
Functions
Commands
function setup() {
  createCanvas(400,400);
}

function draw() {
 background(40);
 drawRect();
}

function drawRect() {
  fill(200,200,250);
  push();
  translate(100,100);
  rect(0,0,50,100);
  pop();
}
Benefits
Functions can be used to split code and organise it better. Instead of a long linear sequence of commands, functions can be associated with a mind map or network, with function calls making the connections between functions.
B-DC 221
2020
Week 4
Computation in Design
Information Design Project
Data and Code 2
A Function Example
Commands
This example demonstrates how to use a function to encapsulate drawing procedures from function draw() by transferring them to function drawLineGraph(). This is to help us organise and modularise our code for better readability and coding.
B-DC 221
2020
Week 4
Computation in Design
Information Design Project
Data and Code 2
Load data from a .csv file and display data using three types of graphs
B-DC 221
2020
Computation in Design
Information Design Project
Practice continues
Data and Code 2
Based on your current experience with data and code, select one of the above graph types, use a data set of at least 20 data points (single or multiple columns data)and design a graph with code, making your own visual decisions (eg. color changes, shape properties, text, labels) in code.
Take inspiration from the links below
B-DC 221
2020
Week 5
Computation in Design
Information Design Project
Data and Code 3
Week 5
Data
Colors
In this session we will continue to work with data and .csv files. We will use graph types including line, bar and donut graphs to visually display data and we will look at how to use and apply colors and color palettes.
B-DC 221
2020
Computation in Design
Information Design Project
Data and Code 3


.csv data: Single and multiple columns data
Colors and
color palettes


B-DC 221
2020
Computation in Design
Information Design Project
.csv data: Covid dataset, single data column
Data and Code 3
Continuing from last weeks .csv exercises, we will look at real-world data today.
The data-resource we will use is based on a spreadsheet with data collected from different Covid-19 sources.
When working with real-world data-sets we often face value-ranges that will not translate to pixels at a 1-to-1 scale. For example a number that represents population will most definitely be larger than the number of pixels we have available to render for example a bar graph. Therefore we must scale these numbers in code so we can display within the space we have available.

When dealing with very high-value numbers, we need to scale them to size and we can do so by using the map() function to translate a set of numbers from one range to another.
Here is a link to a sketch that illustrates this in code.
map()
use the map function to change a value from one range of numbers to another.
what is a range? A range is a number space with a minimum limit and a maximum limit, all numbers of that space exist within that range.
to determine the minimum limit and the maximum limit of numbers inside an array, use min(array) and max(array). How to use map(), min(), max() is demonstrated in code if you follow the link below.

B-DC 221
2020
Computation in Design
Information Design Project
.csv data: Single data column
Data and Code 3
Week 5
This video shows how to transfer and format data from one spreadsheet to another.
In this example the resulting .csv fill contains 2 columns, the first contains labels (country), the second the actual data (value).
After the transfer is completed, the newly generated spreadsheet can be downloaded as .csv file.
The .csv file can then be uploaded to your p5js sketch and loaded as previously demonstrated and practiced.
Source
B-DC 221
2020
Computation in Design
Information Design Project
.csv data: Multiple data column
Data and Code 3
Week 5
This video shows how to transfer and format data from one spreadsheet to another.
In this example the resulting .csv fill contains 4 columns, the first contains labels (country), the following 3 columns contain actual data for 3 different days.
After the transfer is completed, the newly generated spreadsheet can be downloaded as .csv file.
The .csv file can then be uploaded to your p5js sketch and loaded as previously demonstrated and practiced.
Source
B-DC 221
2020
Computation in Design
Information Design Project
.csv data: Single and multiple columns data
Data and Code 3


B-DC 221
2020
Computation in Design
Information Design Project
.csv data: Single column data Example code
Data and Code 3
Week 5


B-DC 221
2020
Computation in Design
Information Design Project
.csv data: Multiple columns data Example code
Data and Code 3
Week 5


B-DC 221
2020
Computation in Design
Information Design Project
Colors
Data and Code 3
Single color
Color palette
for multiple graphs
Gradients


Pay good attention to contrast so that data is well readable.
Learn more about handling colors in code in this code tutorial.
Pay good attention to contrast between foreground, background and graph colors so that data is well readable. Avoid color conflicts that might for example have an effect on color blindness.
Learn more about handling colors in code in this code tutorial.
Handling gradients in code is more challenging than single colors or color palettes but can be useful to add additional visual information to distinguish between high and low values in a bar graph for example.
Learn more about handling gradients (and palettes) in this code example.
B-DC 221
2020
Computation in Design
Information Design Project
Colors
Data and Code 3
Week 5
B-DC 221
2020
Computation in Design
Information Design Project
Colors
Data and Code 3
Week 5


B-DC 221
2020
Computation in Design
Information Design Project
Colors
Data and Code 3


B-DC 221
2020
Computation in Design
Information Design Project
Practice continues
Data and Code 3
Based on your current experience with data and code, select one of the above graph types, use a data set of at least 20 data points (single or multiple columns data)and design a graph with code, making your own visual decisions (eg. color changes, shape properties, text, labels) in code.
Take inspiration from the links below
B-DC 221
2020
Computation in Design
Information Design Project
Data and Code 3
At this point the code understanding, skill level and knowledge might be different for each of you.
Some take smaller steps and need to repeat the concepts and examples covered in class, for others the pace may be too slow and they want to progress faster.
I have included many links to example sketches with varying difficulty levels, sketches are marked with a little colored dot. Do challenge yourself as you see fit.
Take inspiration and motivation from the links provide to other designers, data and code projects.
B-DC 221
2020
Computation in Design
Information Design Project
Guided
Learning
Data and Code
Independent
Applied
(De)coding Data
Data and Code 3
B-DC 221
2020
Computation in Design
Information Design Project
Week 5 Recap
Week 6
Interactive tutorials
B-DC 221
2020
Week 6
Computation in Design
Information Design Project
Data and Code 4
Week 6
Interactions
if-else Statements
In today's session we will look at two concepts that are often linked: Mouse-keyboard interactions and if-else statements. if-else statements (often referred to conditionals) are used in a program to make decisions. User interaction is often achieved by reading mouse and keyboard events.
Interactive inputs can be viewed as another form of data, namely real-time data. This is data that we need to access and respond to dynamically, compared to the previous data exercises that were static and read from a file.
B-DC 221
2020
Computation in Design
Information Design Project
Data and Code 4
Interactions
Mouse and Keys
if-else Statements
B-DC 221
2020
Computation in Design
Information Design Project
Data and Code 4
Mouse
B-DC 221
2020
Computation in Design
Information Design Project
Data and Code 4
Keys
B-DC 221
2020
Computation in Design
Information Design Project
Data and Code 4
if-else Statements
==
<
>
<=
>=
!=
Conditional Operators
equals
lesser
greater
lesser or equal
greater or equal
not equal
a == b
a < b
a > b
a <= b
a >= b
a != b
function setup() {
  createCanvas(400,400);
  noStroke();
}

function draw() {
  // Check the x-and-y-position of the
  // mouse to determine the foreground
  // and background colors.
  if(mouseX < width * 0.5) {
    background(40);
  } else {
    background(220);
  }

  if(mouseY < height * 0.25) {
    fill(255,200,200);
  } else if (mouseY < height * 0.5) {
    fill(200,255,200);
  } else {
    fill(200,200,255);
  }
  rect(100,100,200,200);
}B-DC 221
2020
Computation in Design
Information Design Project
Data and Code 4
Examples: Interactions
B-DC 221
2020
Computation in Design
Information Design Project
Data and Code 4
Examples: if-else Statements

B-DC 221
2020
Computation in Design
Information Design Project
Data and Code 4
Exercise
2
Make use of one or more inputs for the user to interact with your sketch. Use other concepts we have covered so far.
1
In a group of 2-4, create a sketch that illustrates one of the topics to the right.
Climate Change
Happiness
Pollution
Weather
Virus
Topics
3
As a group document your thoughts and process in a short written reflection that addresses issues, achievements and outcome.
Requirements
p5js sketch in 16x9 format eg. 960x540 pixels.
B-DC 221
2020
Computation in Design
Information Design Project
Data and Code 4
B-DC 221
2020
Week 7
Computation in Design
Information Design Project
Data and Code 5
Week 7
In today's session we will continue to look at concepts introduced in previous sessions and apply them to an exercise you will continue working on in a small group.
This exercise not only looks at how well you can express an idea through code but emphasises on developing ideas in a team, sketching ideas on paper, planning and translating ideas in code, while paying good attention to aesthetics and user experience.
B-DC 221
2020
Computation in Design
Information Design Project
Data and Code 5
Exercise continues from week 6
2
Make use of one or more inputs for the user to interact with your sketch. Use other concepts we have covered so far.
1
In a group of 2-4, create a sketch or more that illustrates one of the topics to the right.
Climate Change
Happiness
Pollution
Weather
Virus
Topics
3
As a group document your thoughts and process in a short written reflection that addresses issues, achievements and outcome.
Requirements
p5js sketch in 16x9 format eg. 960x540 pixels
B-DC 221
2020
Computation in Design
Information Design Project
Data and Code 5
Exercise, second round.
4
Do a second round with the same topic, but this time plan your sketch on paper and in your team. Make an informed choice of shapes, colours, aesthetics, interactions and user experience.
Climate Change
Happiness
Pollution
Weather
Virus
Topics
Requirements
p5js sketch with adaptable canvas dimension using windowWidth and windowHeight.
createCanvas(windowWidth, windowHeight);
5
Get another team to test your sketch and gather feedback. Consider to have a couple of questions for your testing.
6
As a group document your thoughts, feedback and process in a short written reflection that addresses testing, issues, achievements and outcome.
B-DC 221
2020
Computation in Design
Information Design Project
Data and Code 5
Sketching on Paper
Form
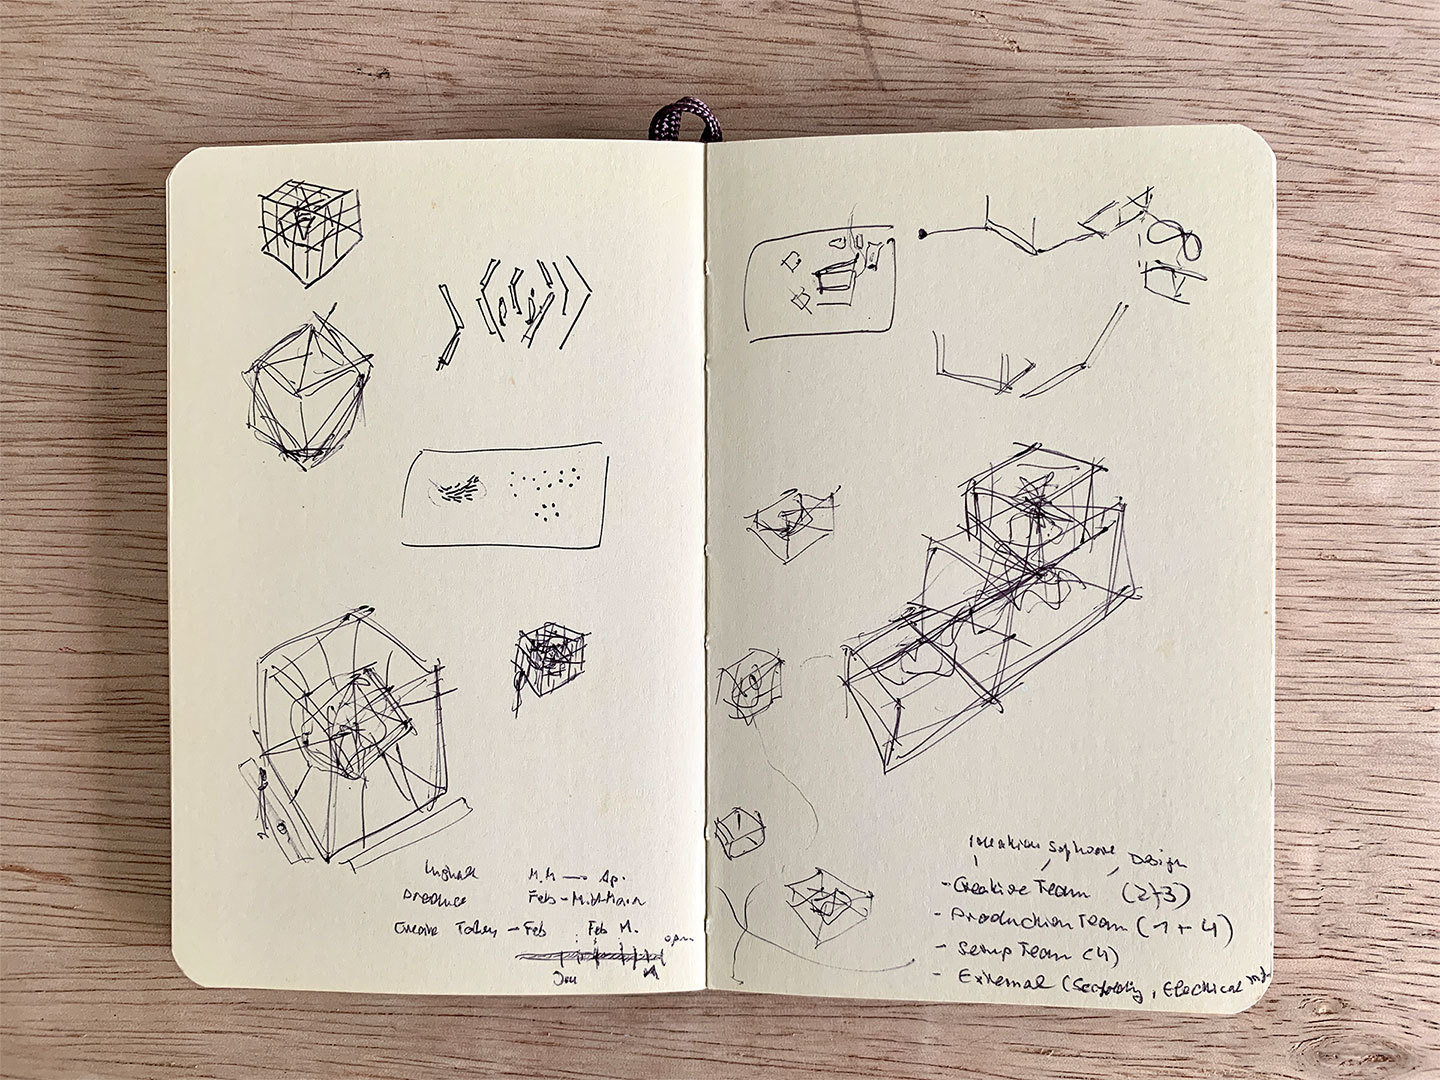
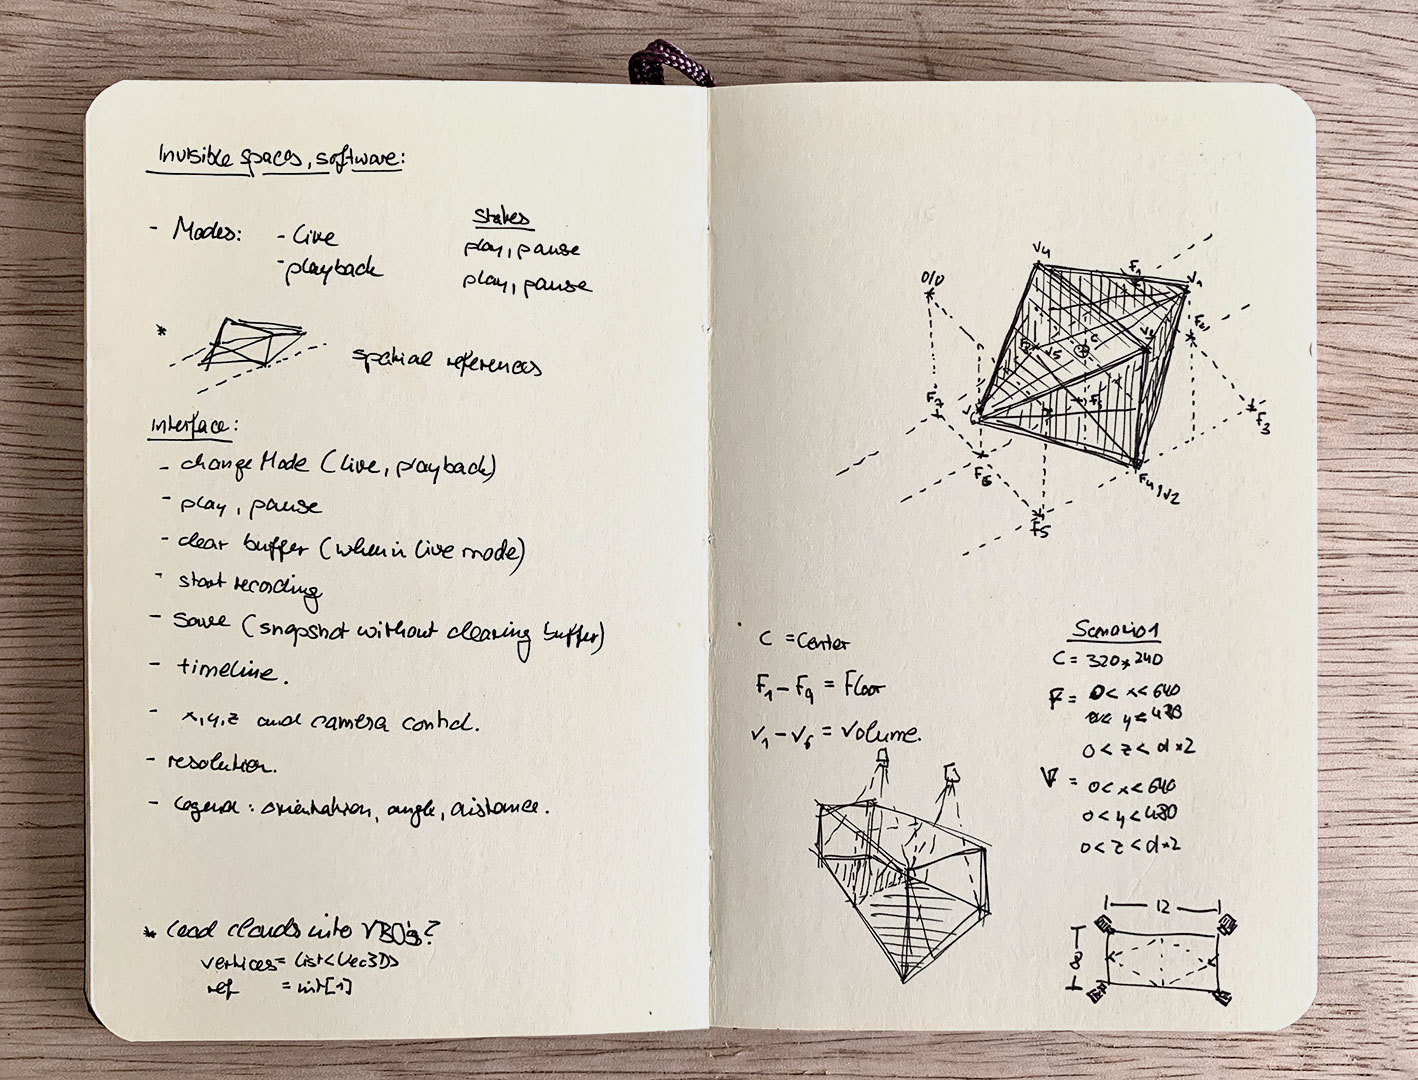
B-DC 221
2020
Computation in Design
Information Design Project
Data and Code 5
Sketching on Paper
Structure
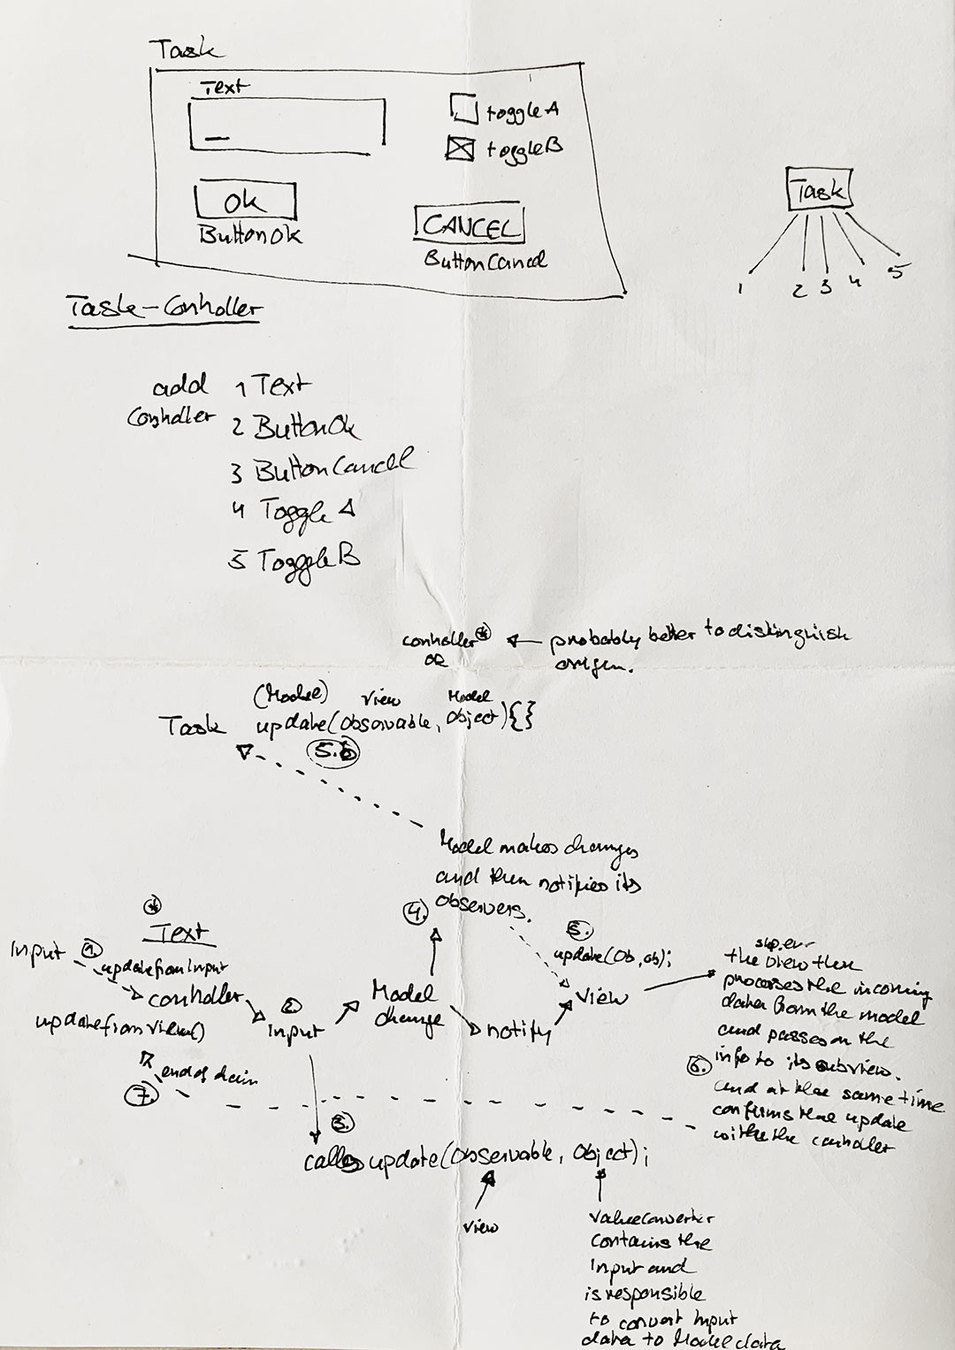
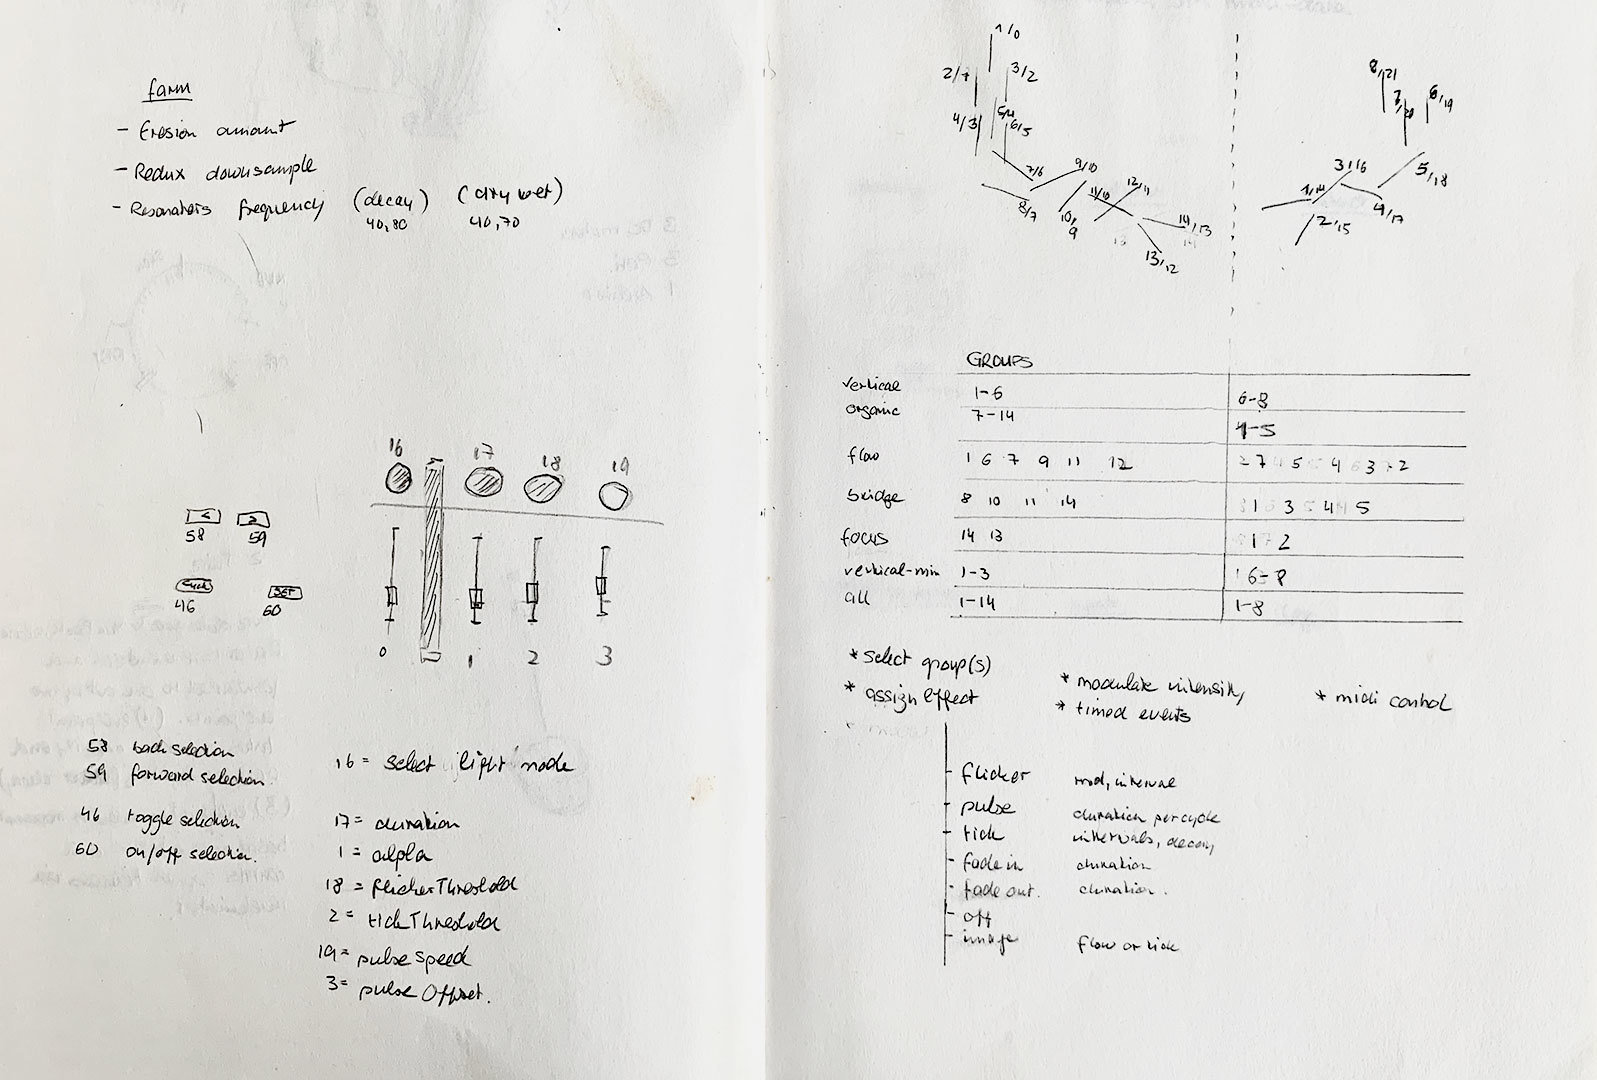
B-DC 221
2020
Computation in Design
Information Design Project
Data and Code 5
Sketching on Paper
Flow
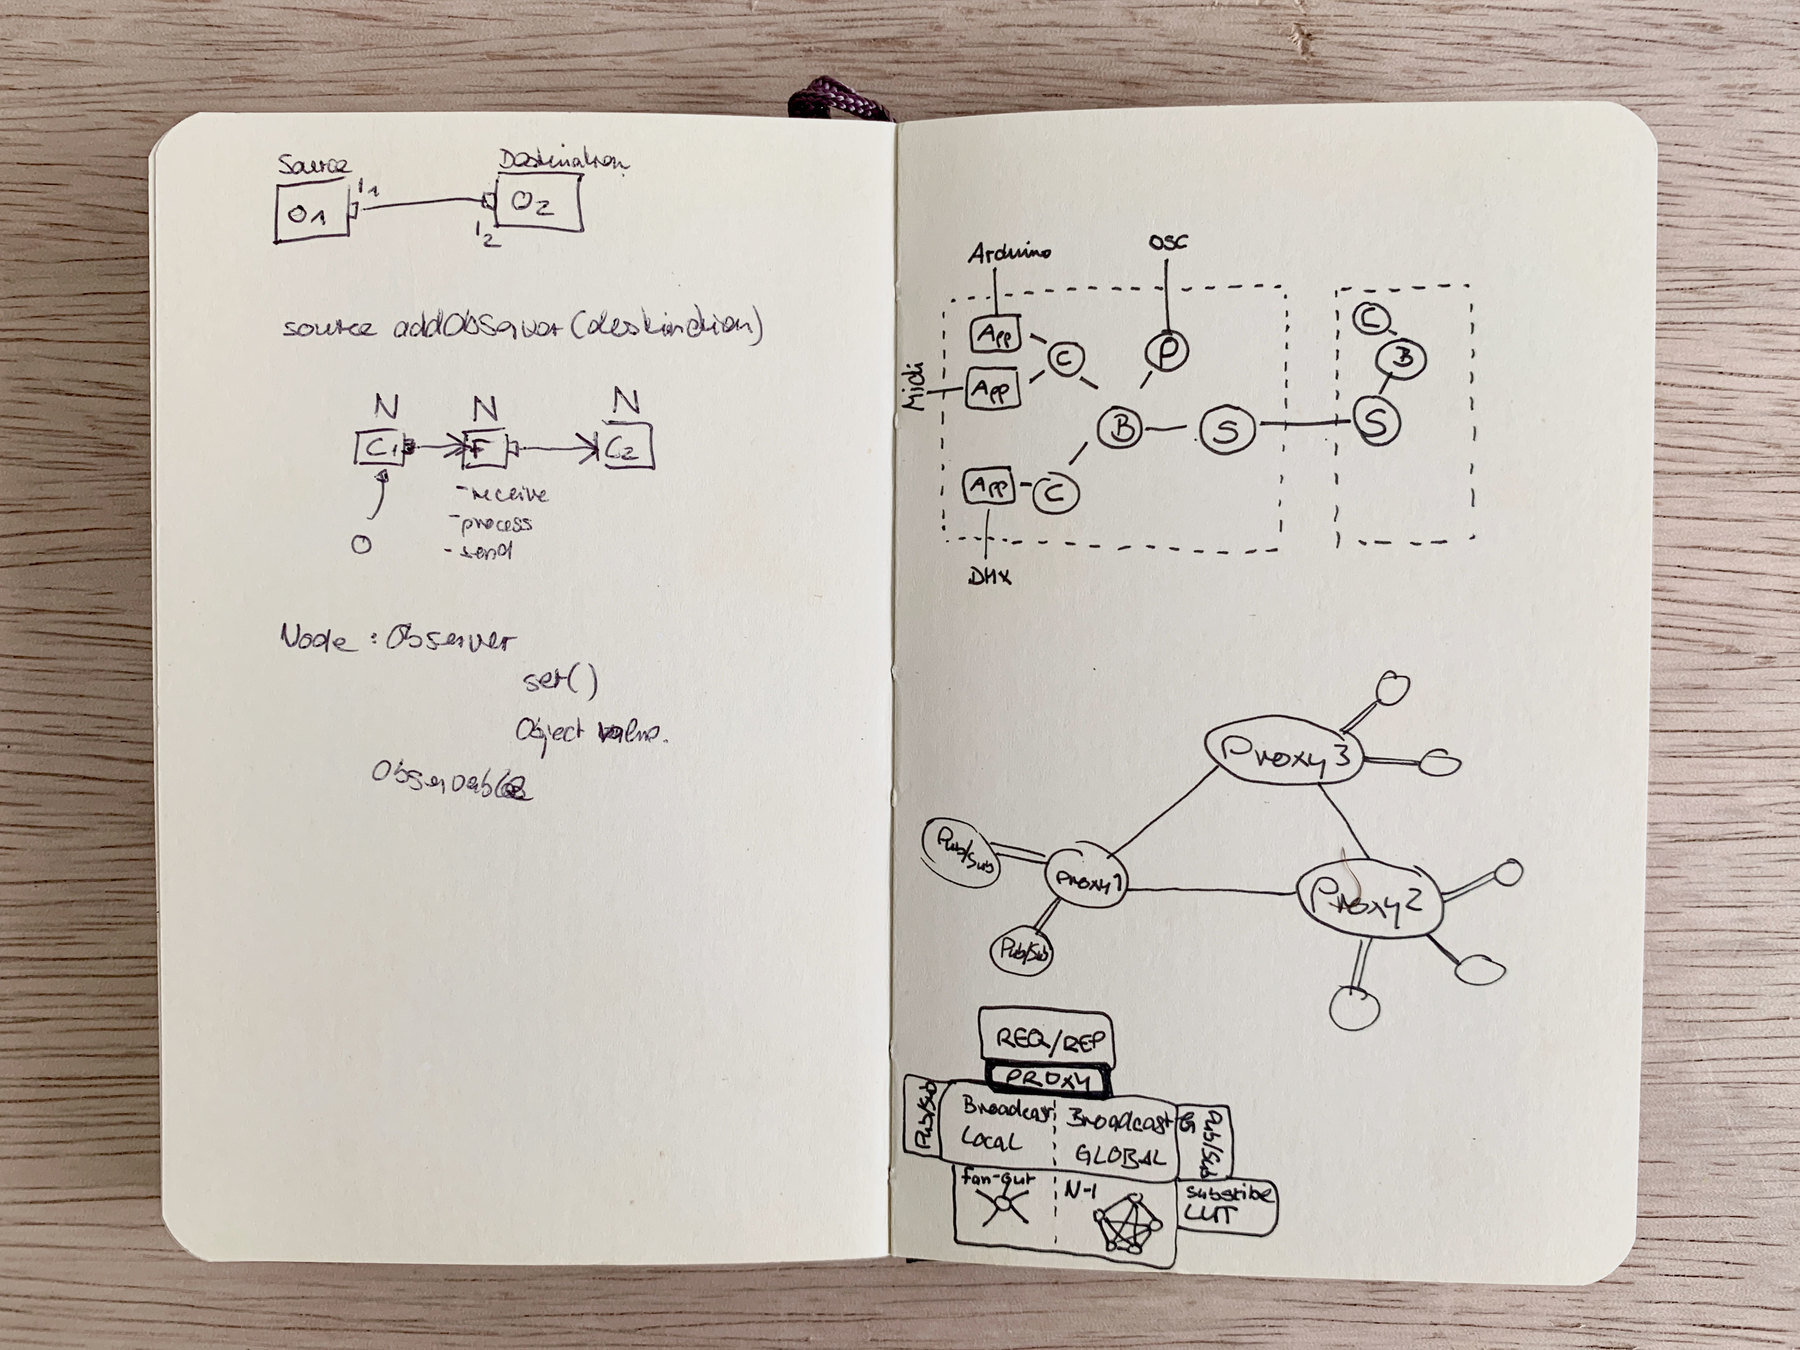
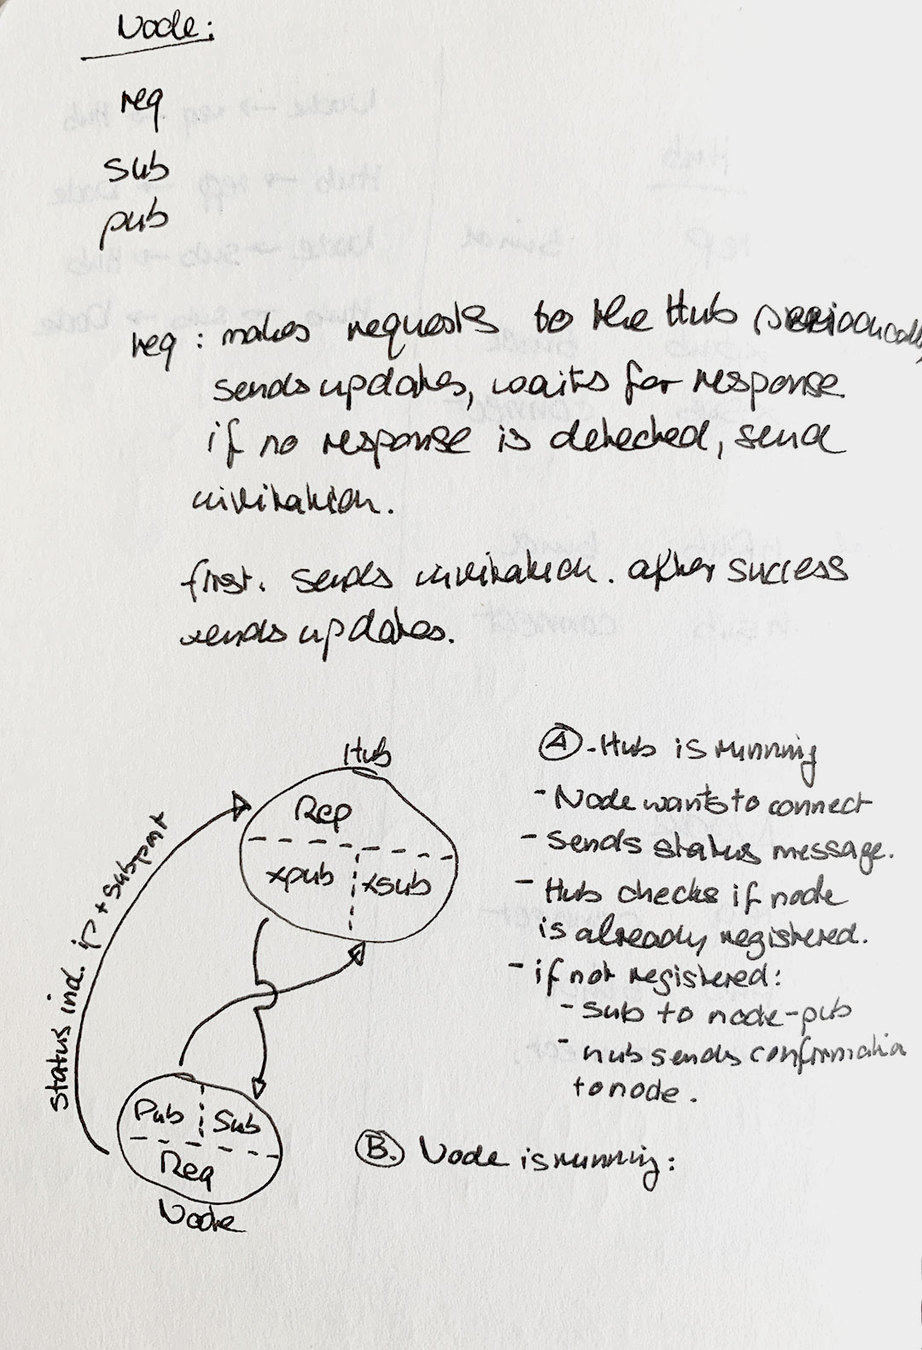
B-DC 221
2020
Computation in Design
Information Design Project
Data and Code 5
Sketching on Paper
Form, Structure, Flow
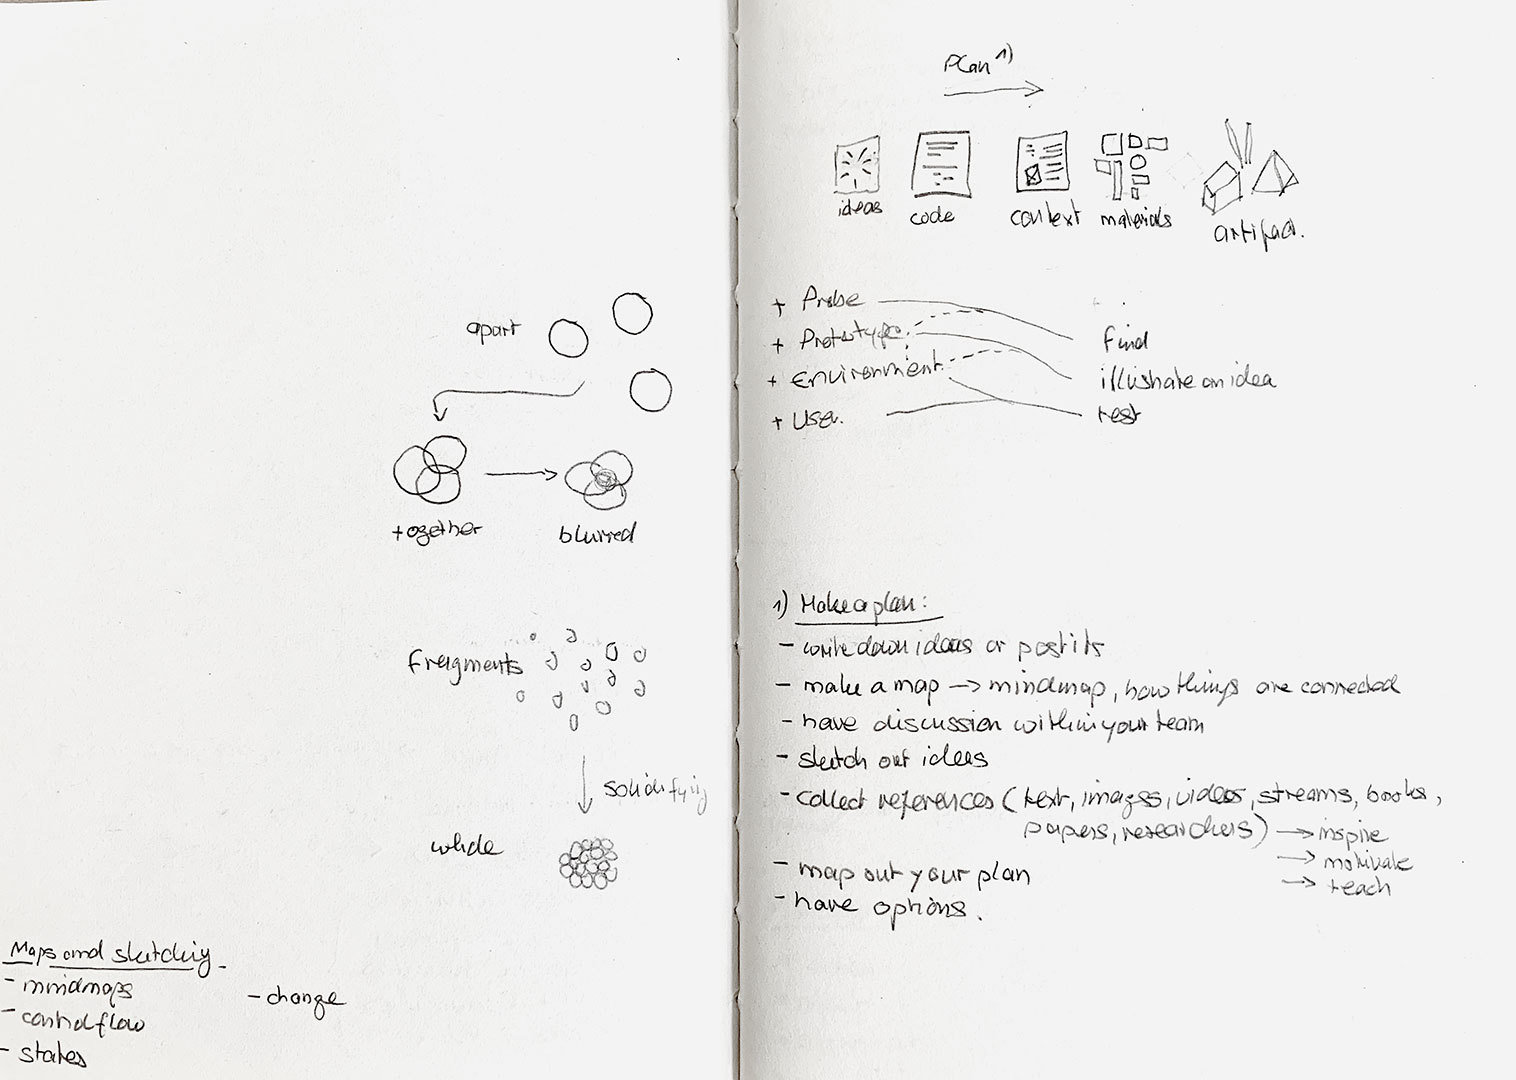
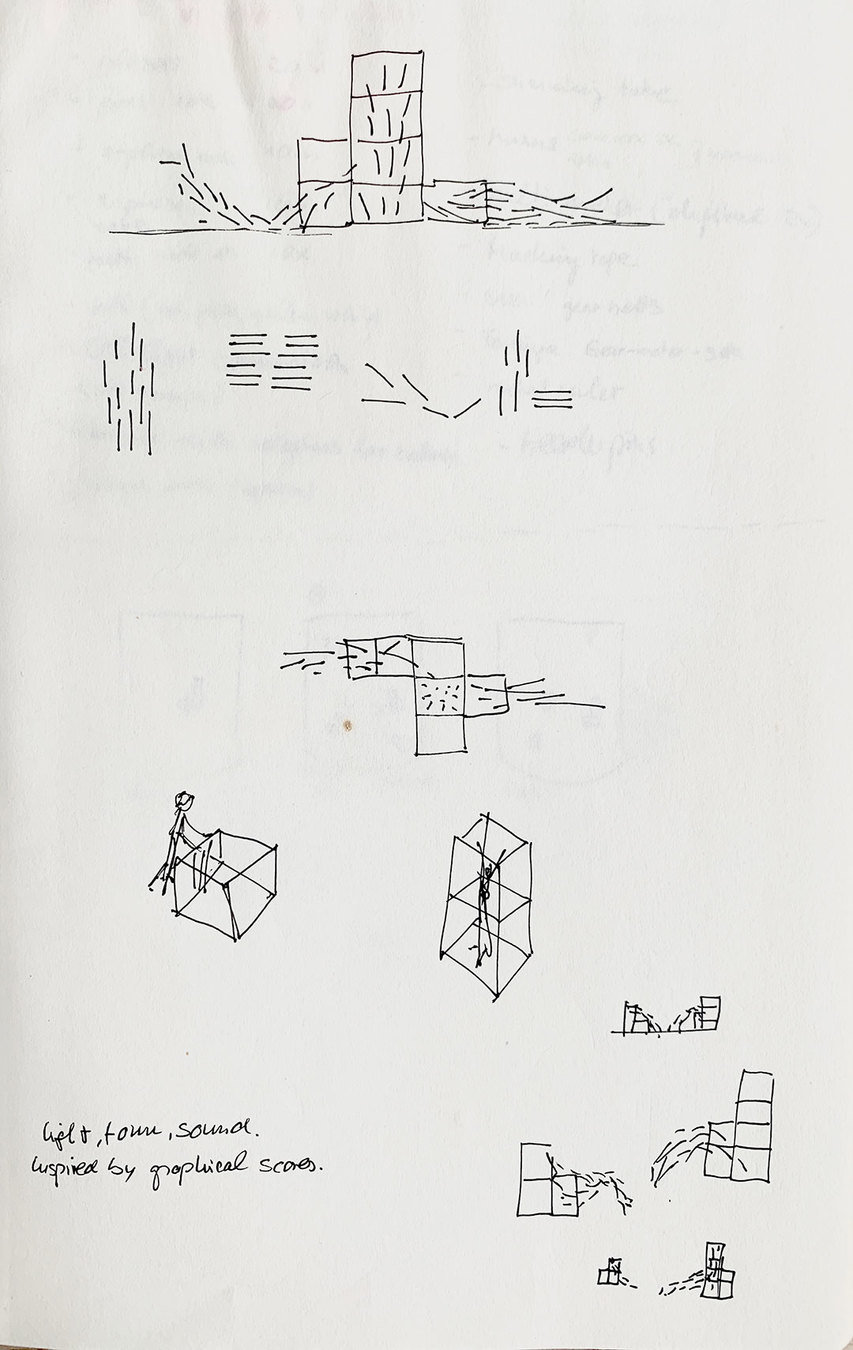
B-DC 221
2020
Computation in Design
Information Design Project
Data and Code 5
Sketching on Paper
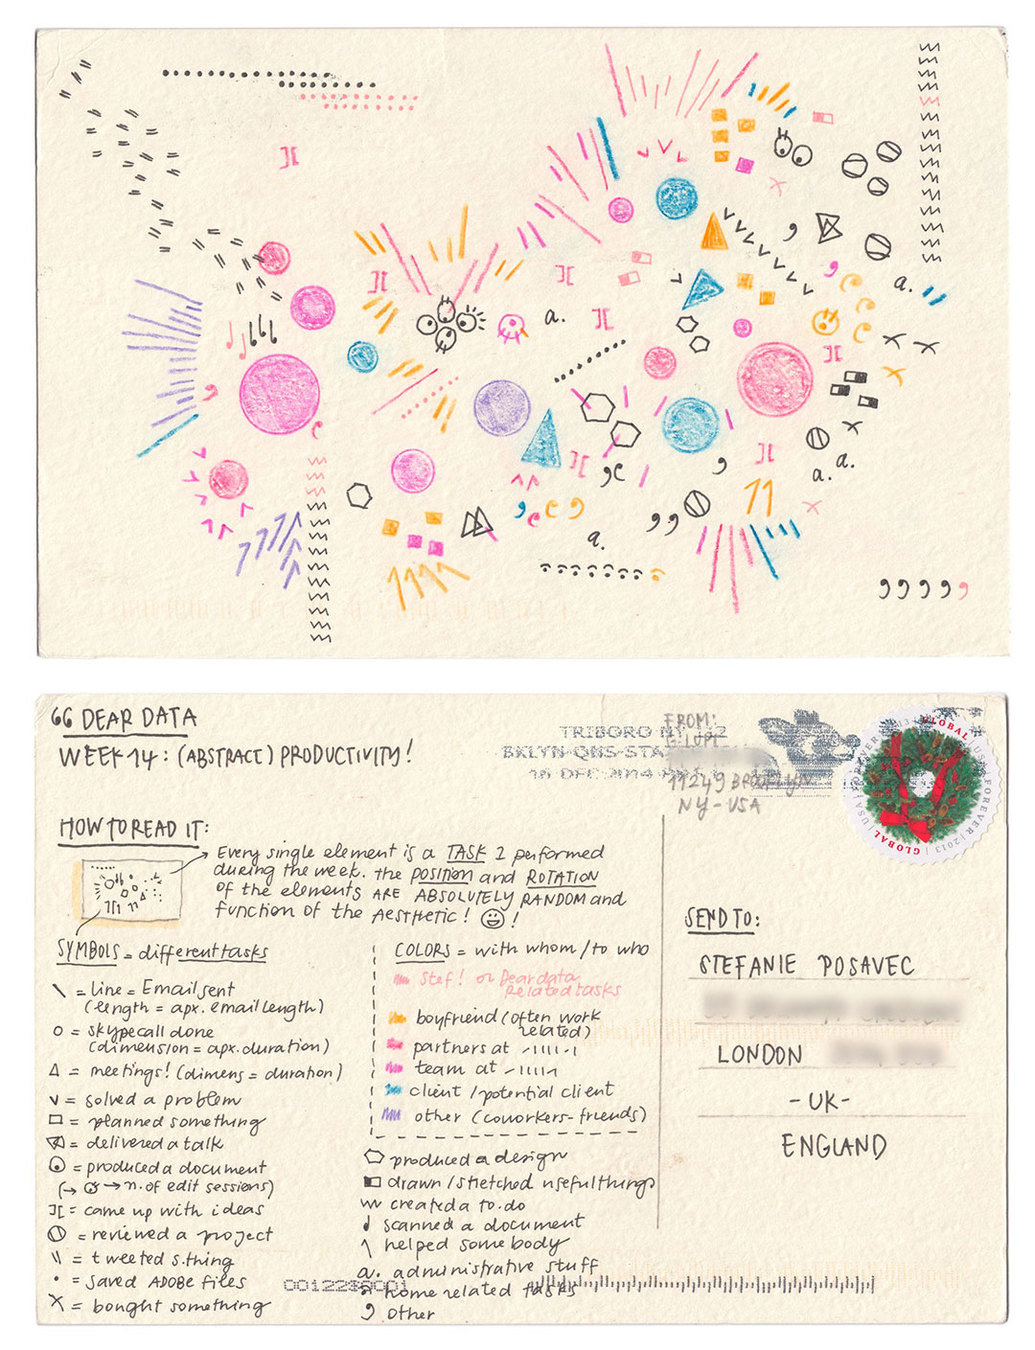
Giorgia Lupi & Stefanie Posavec
Dear Data

B-DC 221
2020
Computation in Design
Information Design Project
Data and Code 5
Sketching in Code
Variations and evolution of a sketch


Notice that the name of the sketch remains the same, but the ending changes to indicate the version.
B-DC 221
2020
Computation in Design
Information Design Project
Data and Code 5
Testing


B-DC 221
2020
Computation in Design
Information Design Project
Data and Code 5
Testing
1
Get another team to test your sketch and gather feedback.
Consider to have a couple of questions prepared for your testing.
3
Does the user understand what to do? Did you give enough hints?
Remember when your work goes online you are not able to assist the user in person.
4
How does the user respond to form, aesthetics, and user experience?
2
Allow the user to explore on their own first.
5
Try to find out from the user what works well and what needs improvement. Note done the feedback.
B-DC 221
2020
Computation in Design
Information Design Project
Data and Code 5
Exercise Outcomes
1
Code Sketches
2
Written Reflection
3
Sketches on Paper


B-DC 221
2020
Computation in Design
Information Design Project
Data and Code 5
Food for Code
B-DC 221
2020
Week 8
Computation in Design
Information Design Project
Data and Code 6
Week 8
Wrapping up Exercise 3
In today's class we will conclude Exercise 3 based on the brief given in week 7. After you have completed the tasks required, the last step is to add your final p5js sketch, written reflection and images to a single page website template.
Work as a team, assign tasks to each other.
This concludes Exercises 3.

B-DC 221
2020
Computation in Design
Information Design Project
Data and Code 6
Wrapping up Exercise 3
1
Make sure your p5js sketch is finished and complete.
2
As a group document your thoughts, feedback and process in a short written reflection that addresses testing, issues, achievements and outcome.
3
Present your outcomes as a single page website from the website template provided.
B-DC 221
2020
Computation in Design
Information Design Project
Week 8
Using Brackets to edit html and css
This video shows how to download the brackets.io app to open and edit html and css files. Changes can then be viewed in the browser using bracket's live preview option (top right corner flash-icon).
View the video in fullscreen mode for better readability.
B-DC 221
2020
Computation in Design
Information Design Project
Data and Code 6
Wrapping up Exercise 3
1
Make sure your p5js sketch is finished and complete.
Minimum changes that need to be made to the website template
1 replace placeholder text with your project details and reflection.
2 replace placeholder p5js sketch with your final Exercise 3 sketch
3 replace placeholder images with your images
Requirements
2
As a group document your thoughts, feedback and process in a short written reflection that addresses testing, issues, achievements and outcome.
3
Present your outcomes as a single page website from the website template provided.
B-DC 221
2020
Computation in Design
Information Design Project
Data and Code 6
Download exercise 3 website template


B-DC 221
2020
Computation in Design
Information Design Project
Data and Code 6
Share p5js link and embed as iframe in html
B-DC 221
2020
Computation in Design
Information Design Project
Data and Code 6
Brackets to Browser


Live Preview Button
Make changes to index.html
B-DC 221
2020
Computation in Design
Information Design Project
Data and Code 6
Deploy website to public server
This video demonstrates how to use Netlify to host your website.
After signing up for a free account you can upload your website folder to your account and host it publicly as a sub-domain on netlify.
Netlify
Website template on netlify
B-DC 221
2020
Computation in Design
Information Design Project
Week 9
In-class
Upload to shared folder
- Create a .zip file from your exercise-3 website folder
- Rename .zip file to exercise-3-studentId.zip
- Upload .zip file to the shared-folder on Google Drive
- place .zip file into folder that opens
Upload Exercise 3
B-DC 221
2020
Computation in Design
Information Design Project
Week 9
(De)coding Data
Project Briefing
(De)coding Data is a self-directed project in which students start from a selected data set to develop visual representations that provide access to and insights into the hidden patterns, details, information and structures of meaning that the data set can reveal.
B-DC 221
2020
Computation in Design
Information Design Project
Week 9
Project Brief
For this project you will create a single page website that visualises, contextualises and illustrates a data set which you can choose from a list of provided data topics.
Data will be visualised using code and your first p5js sketch. In earlier sessions different data visualisation types have been introduced to you and which you should apply here.
In a second p5js sketch you will visually interpret the chosen data topic in code. This links back to exercise 3.
In a brief written reflection you then contextualise and share your thoughts addressing why you have chosen a particular topic and data set, what informed your design decisions, what the data tells you and what you intend to communicate to your viewer with your project.
B-DC 221
2020
Computation in Design
Information Design Project
Week 9
Project Brief
Sketch 2
Visualise Data
Sketch 1
Visually Interpret Data Topic
Written Reflection
Website
Single Page
B-DC 221
2020
Computation in Design
Information Design Project
Week 9
Data Sets
Project Brief
Pollution
Happiness
Virus
Climate Change
Select one data set from the above data resources that you want to work with for your project.
Waste
B-DC 221
2020
Computation in Design
Information Design Project
Week 9
Data Set
Project Brief

First column: Label
consecutive columns: Data
B-DC 221
2020
Computation in Design
Information Design Project
Week 9
Sketch 1
Visually Interpret Data Topic
Project Brief
For this sketch p5js sketch you will visually interpret the chosen data topic in code. This links back to exercise 3.
B-DC 221
2020
Computation in Design
Information Design Project
Week 9
Sketch 2
Visualise Data
Project Brief
For this p5js sketch create a visualisation from the data set you have chosen to work with. Revisit session Data and Code 3.


B-DC 221
2020
Computation in Design
Information Design Project
Week 9
Written Reflection
Project Brief
In a brief written reflection you contextualise and share your thoughts addressing why you have chosen a particular topic and data set, what informed your design decisions, what the data tells you and what you intend to communicate to the viewer with your project.
Design decisions can address for example aesthetics, colours, type of graph, typography and fonts used, animation or interactivity.
B-DC 221
2020
Computation in Design
Information Design Project
Week 9
Website Template
Project Brief
Use the template shared with you. Changes to be made to the template's html and css files, e.g. changing colours, fonts, font sizes, etc. Replace the placeholder images and p5js sketches with your own. Extend the page as you see fit.

B-DC 221
2020
Computation in Design
Information Design Project
Week 9
References
Project Brief
B-DC 221
2020
Computation in Design
Information Design Project
Week 9
References
Project Brief
B-DC 221
2020
Computation in Design
Information Design Project
Week 9
Project Brief
References
Open Processing
A community of creative coders, educators, and designers that explore, experiment and play.
Studio Dumbar
Studio Dumbar creates meaningful brands at the intersection of creativity, technology and data.
B-DC 221
2020
Computation in Design
Information Design Project
Week 9
Deliverables
Project Brief
Sketch 2
Visualise Data
Sketch 1
Visually Interpret Data Topic
Written Reflection
Website
Single Page
B-DC 221
2020
Computation in Design
Information Design Project
Week 9
Steps you might want to take
Project Brief
B-DC 221
2020
Week 1
Digital Portfolio
Helps to document your process and outcomes weekly
Archives and organises materials for deliverables
Keep(s) your work organised
Computation in Design
Information Design Project
B-DC 221
2020
Week 1
Digital Portfolio
Computation in Design
Information Design Project
Available for download as .zip from Google Drive, please follow the link attached to the screenshot on the right.
B-DC 221
2020
Week 4
Computation in Design
Information Design Project
Data and Code 2
Display data when loaded from file
https://editor.p5js.org/sojamo/sketches/K8rVc3VGS
Another more advanced sketch to load the spreadsheet from previous slide
B-DC 221
2020
Week 4
Computation in Design
Information Design Project
Data and Code 2 Notes
Week 4
Some notes
Quantitative Data ↗
- discrete data (countable, numbers, values with clear "space" between then like 1,2,3,4 = how many students are there in class?, number of .. )
- continuous data (measurable, numbers, decimal, continuous sequence 1.2, 1.201, 1.203 etc. includes any value within range; age, time, height, etc.)
Data visualisation Examples
Senesable City Lab
Moritz Stefaner
Giorgia Lupi
Dear Data
recap last week
How did the homework go?
Show solutions.
What did we cover so far and why?
Demo concepts that are not clear.
- Demo 1 Google Sheets > example sheet 1
Header, column, row, number vs string
- export to .csv
- import to p5js
- load data into an array (explain table commands)
- we can then loop through the array, read data points and then display them using a rect shape for example.
- Demo 2 Copy data from one data sheet to the other, clean and format data, then save and export as csv
Today we will look at drawing graphs from data that we read from a .csv file. We will use Google Spreadsheets to organize and export our data.
In p5js we will read and use that data so that we can display it as different graphs visually.
B-DC 221
2020
Computation in Design
Information Design Project
Data and Code 4
Project Briefing
The project:
my proposal is for students to create a one-page website including at least 1 data visualisation sketch, text and images (optional: a second and more illustrative / creative / playful sketch).
In a short description they provide details about the data-set they have chosen, so that the viewer knows what they are looking at.
In a brief reflection they share their thoughts addressing why they have chosen a particular data-set and what informed their design decisions (colours, type of graph, etc).
Templates will be provided for:
- Data sketch
- Data-set
- Website
Optionally students can add a second sketch to visually interpret the topic of the data-set through code in an illustrative/creative/playful way.
B-DC 221
2020
Wrapping up
Homework
Review and Practice
Computation in Design
Information Design Project
2020-CiD-L2-w2-w14
By Andreas Schlegel
2020-CiD-L2-w2-w14
- 2,837


