introduction
TO
Cartodb
Steve Bennett
Sign up: cartodb.com
Slides: cartodb.researchmaps.net

Housekeeping
Computers, not tablets
Work in teams - share what you learn
Video & photos - you can opt out
Toilets
Slides: cartodb.researchmaps.net
Sign up: cartodb.com/academic
Sign up: cartodb.com/academic
Objectives
By the end of today, you will be able to:
-
Turn
data
with latitudes & longitudes...
- that you provide as a spreadsheet
- or get from somewhere else
- or make from addresses
- into
dots
...
- that you can click on for more info
- that are colour coded
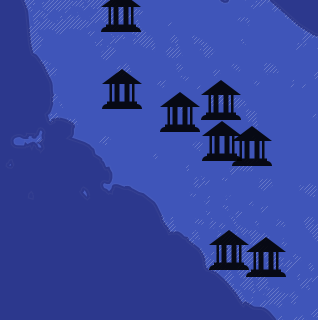
- or icon-coded
- ...on a
map...
- that you choose from a lovely selection
- which you can share with the world.
Introduction
Data visualisation
(CartoDB)
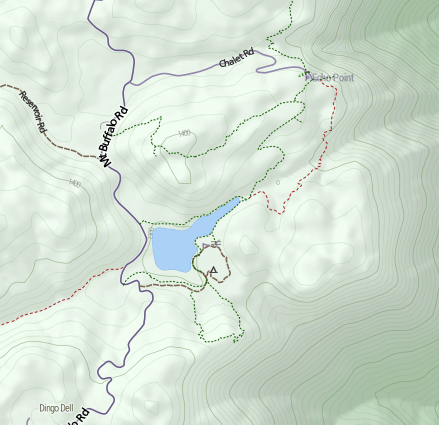
Basemap
(Tilemill)
(Tilemill)
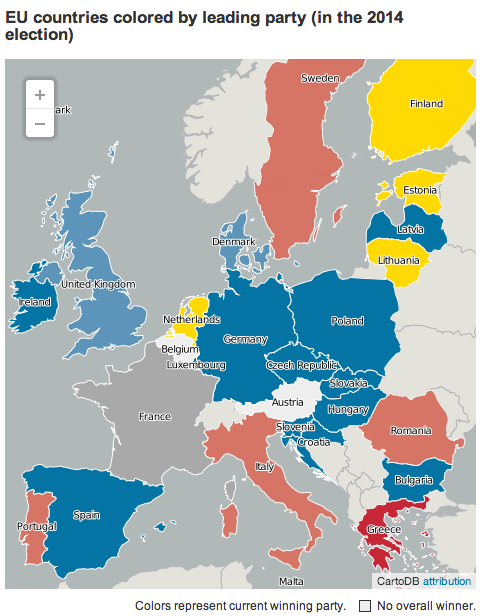
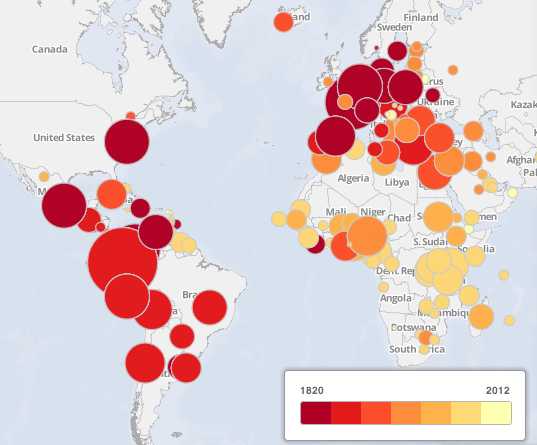
CartoDB - Example 1
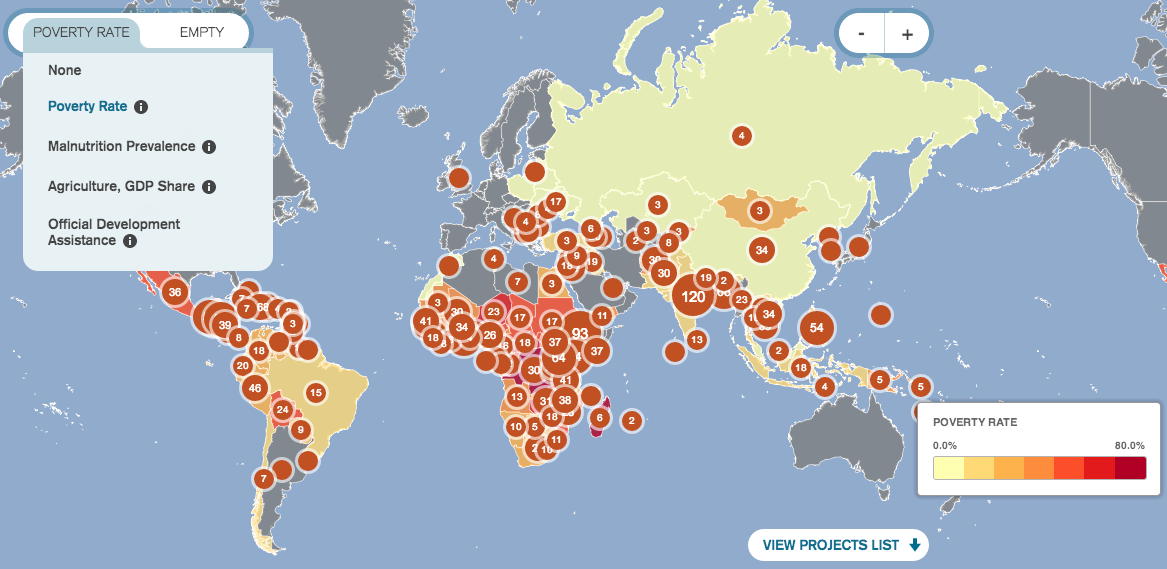
Example 2
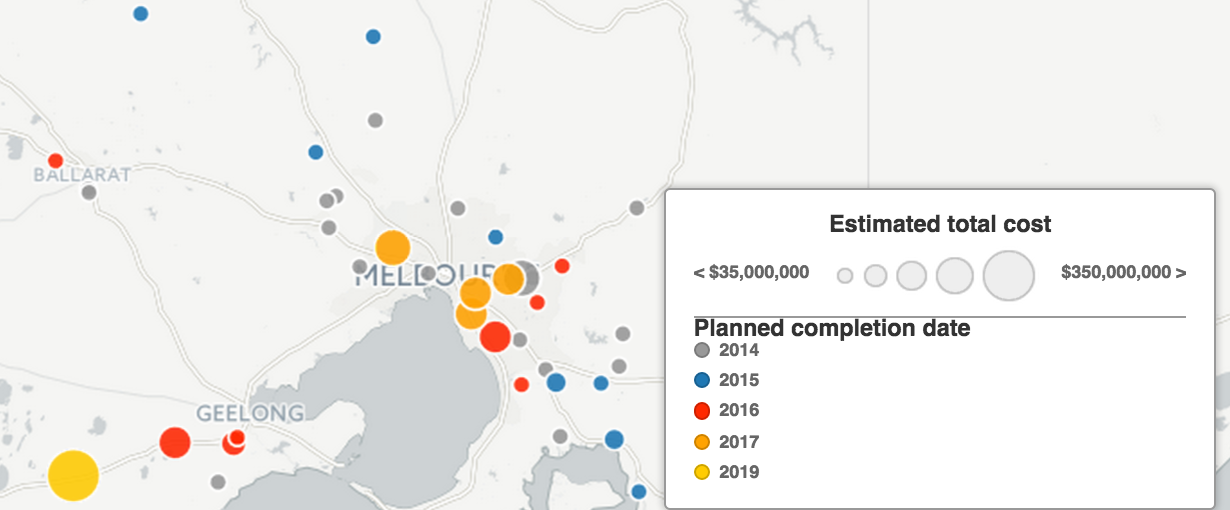
Example 3
VicRoads Projects
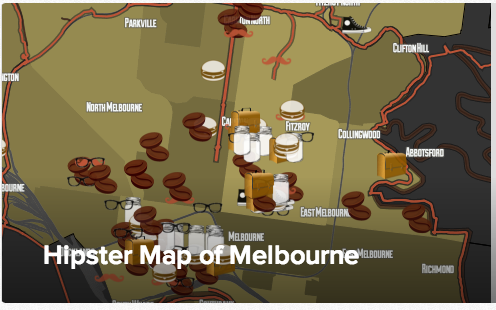
And more
Not enough? cartodb.com/gallery
Get an account
cartodb.com
All data is public
All maps are public
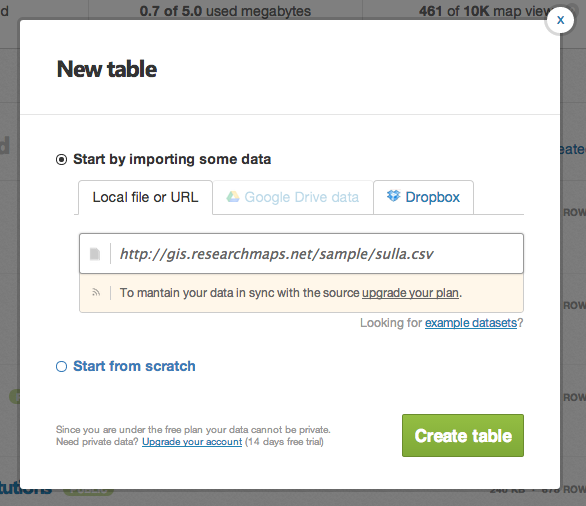
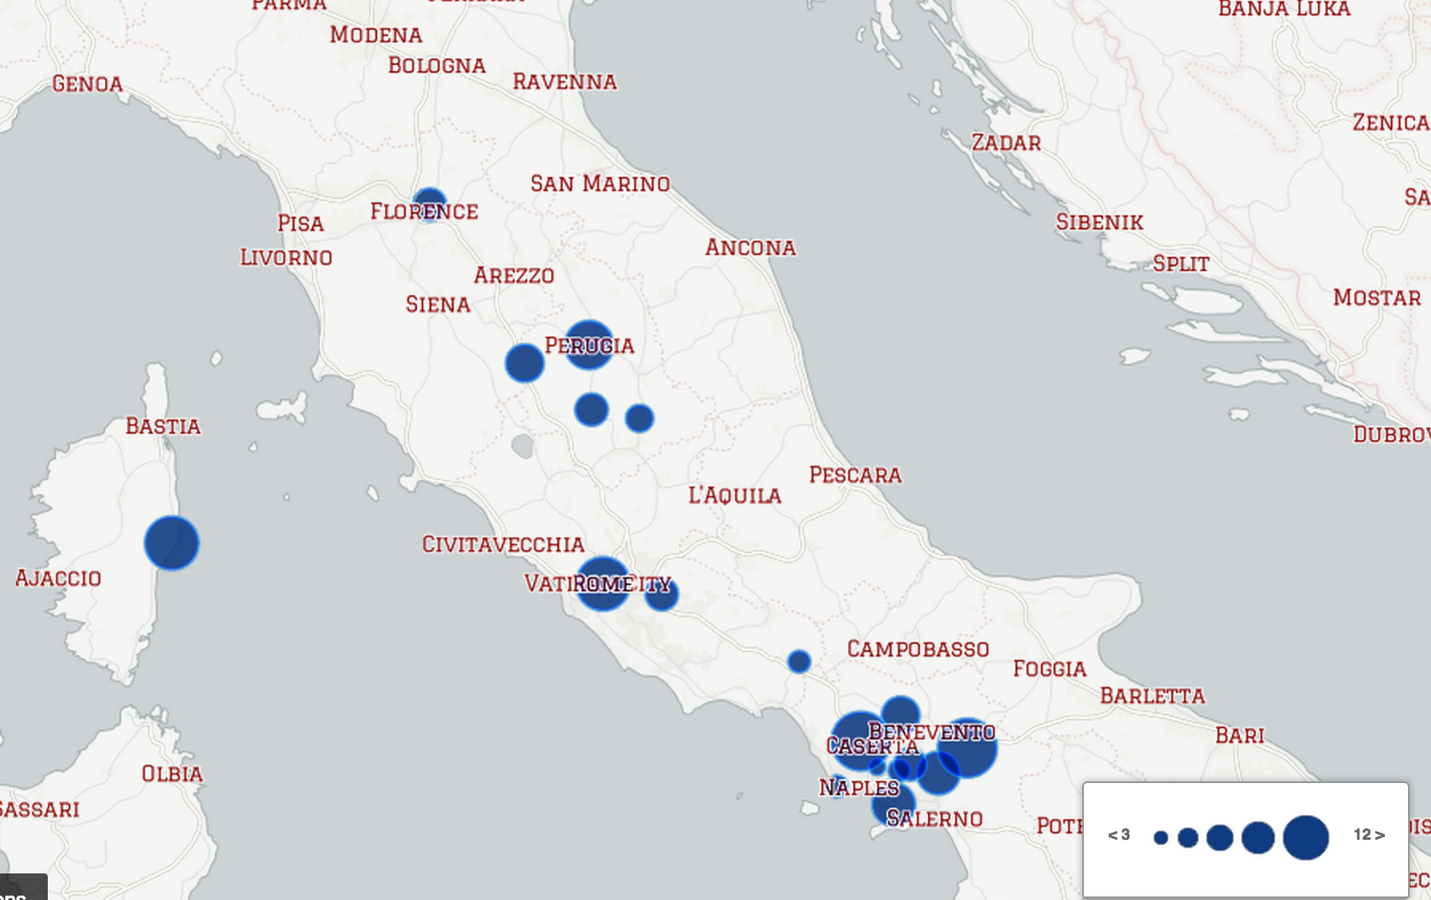
Fiona's fictitious Roman dig (exercise)
http://gis.researchmaps.net/sample/sulla.csv
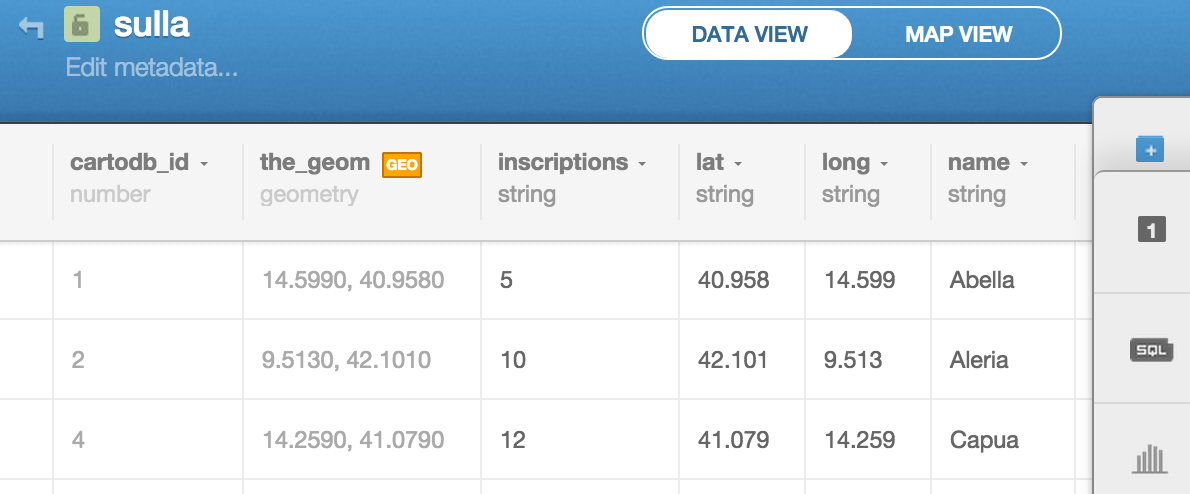
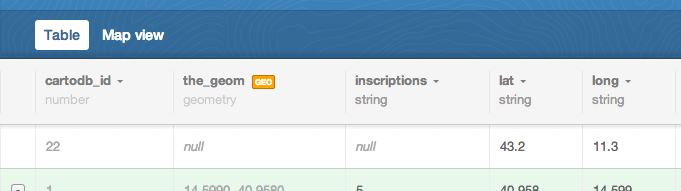
About sulla.csv
22 rows
Lat & Long (for geocoding)
Name (string - good for labels)
Inscriptions (numeric - good for choropleths)
Type (fixed vocab - good for categories)
Tables: How do I...?(EXERCISE)
-
Change inscriptions column type to "number"
-
Edit a cell
- Add a row
- Delete a row
-
Sort by a column
- Add a column
When finished, help someone else.
basemap (EXERCISE)
Pick a basemap. Any basemap.
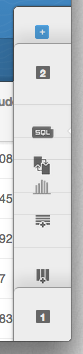
What the buttons do
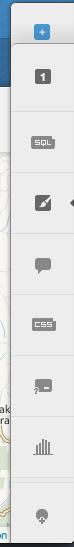
New layer
Select this layer
Custom SQL (advanced queries)
Wizards (visualisation type)
Info windows (when you click)
Custom CSS (advanced styling)
Legends (HTML required)
Filters
Add row
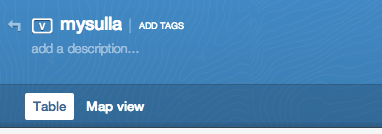
Info windows
...are easy
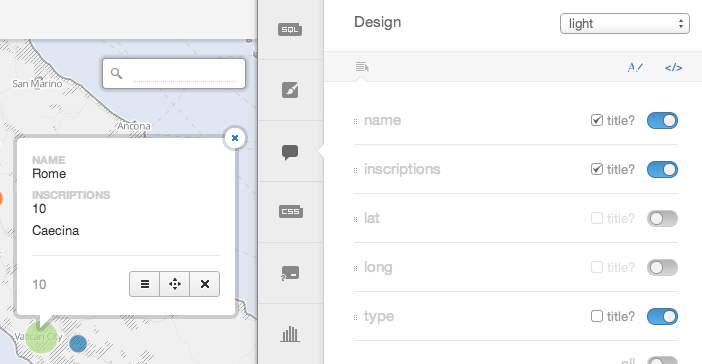
EXERCISE: make an appropriate info window
Visualisations for small data
"Simple" visualisation
Make this. Hint: 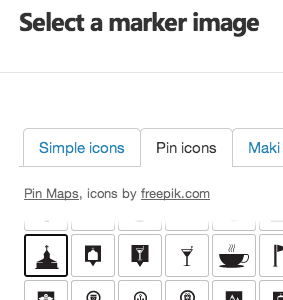
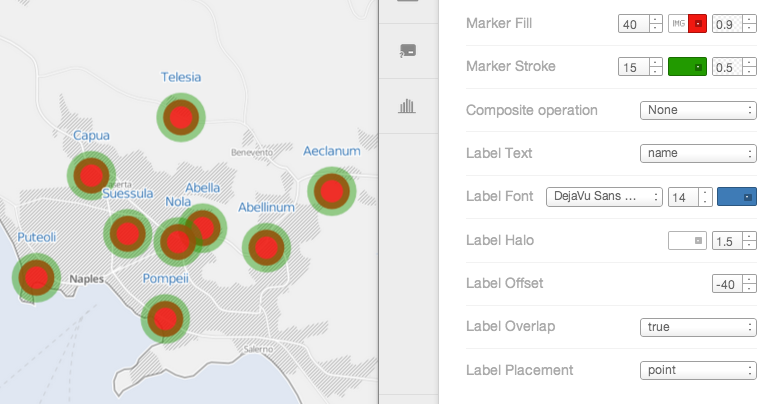
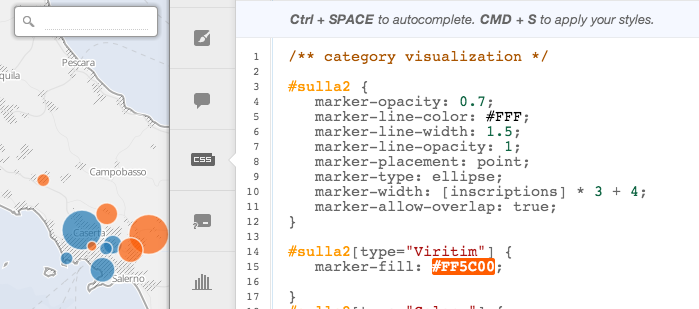
Category visualisation
Make this.
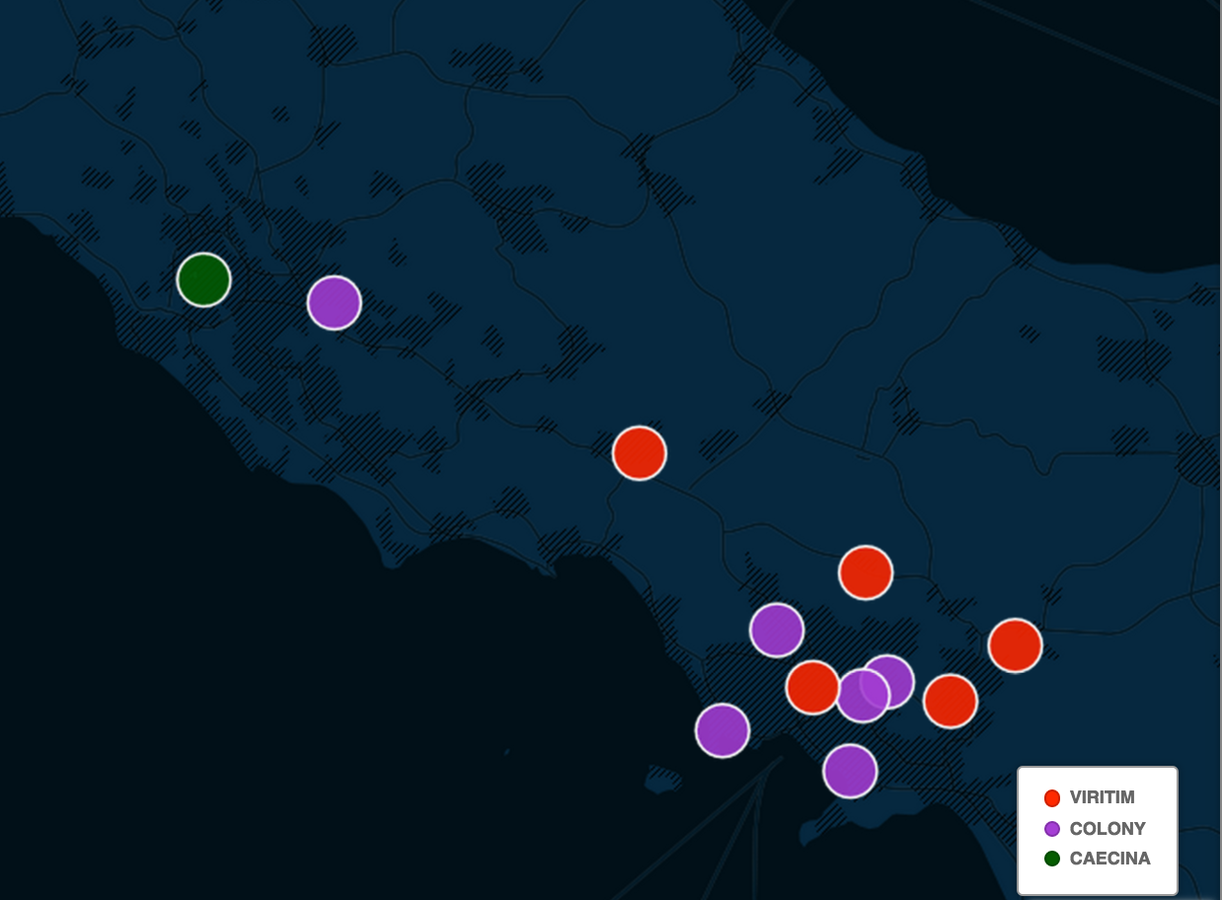
Hint: 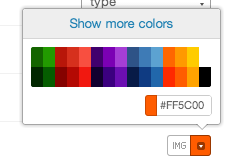
Labels
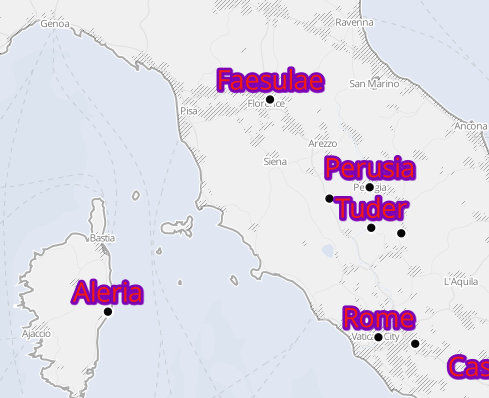
Can you make this?
Hint: Only some visualisation types support labels.
Fill & Stroke
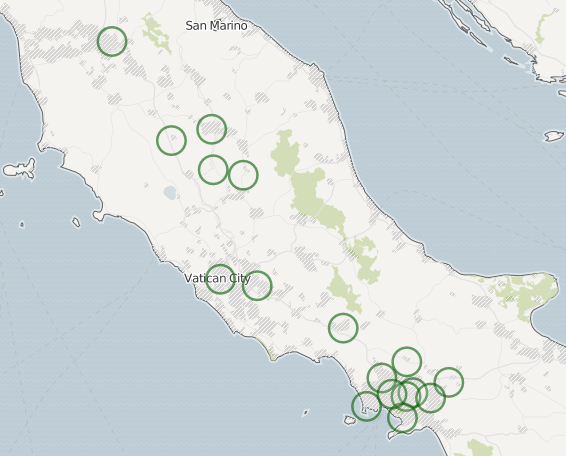
Can you create these rings?
Stroke/Fill/LABEL
Challenge: make the ugliest visualisation of 'sulla'
Add another layer
With each visualisation, you can:
Share
Re-order layers
Combine styles
Present the same data differently
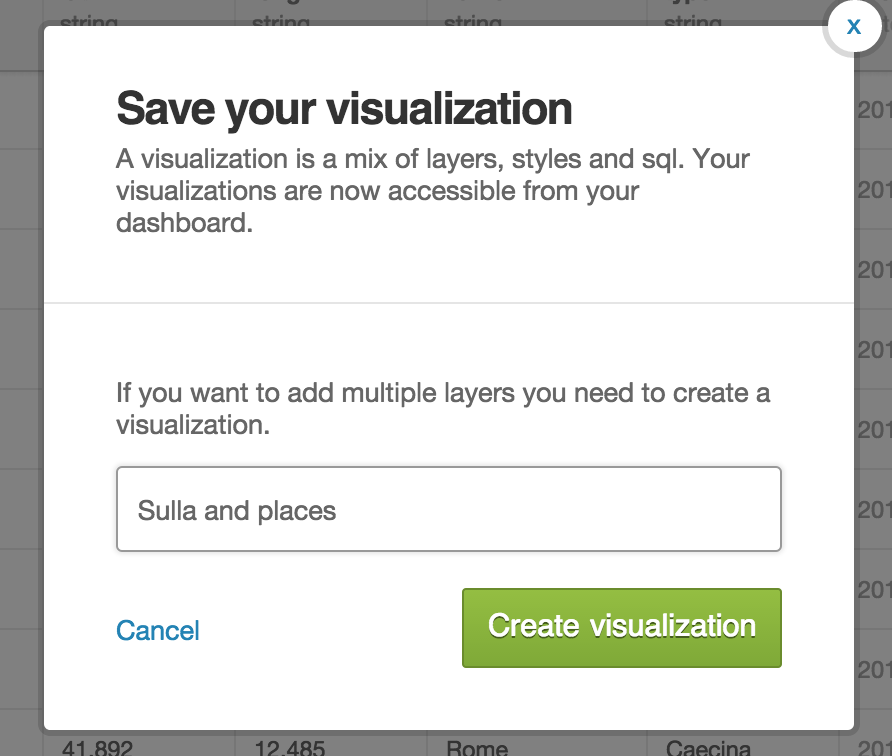
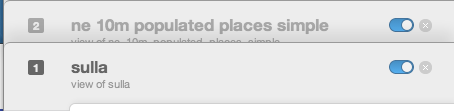
One visualisation has 1+ datasets.
One dataset has 1 map view, 0+ visualisations
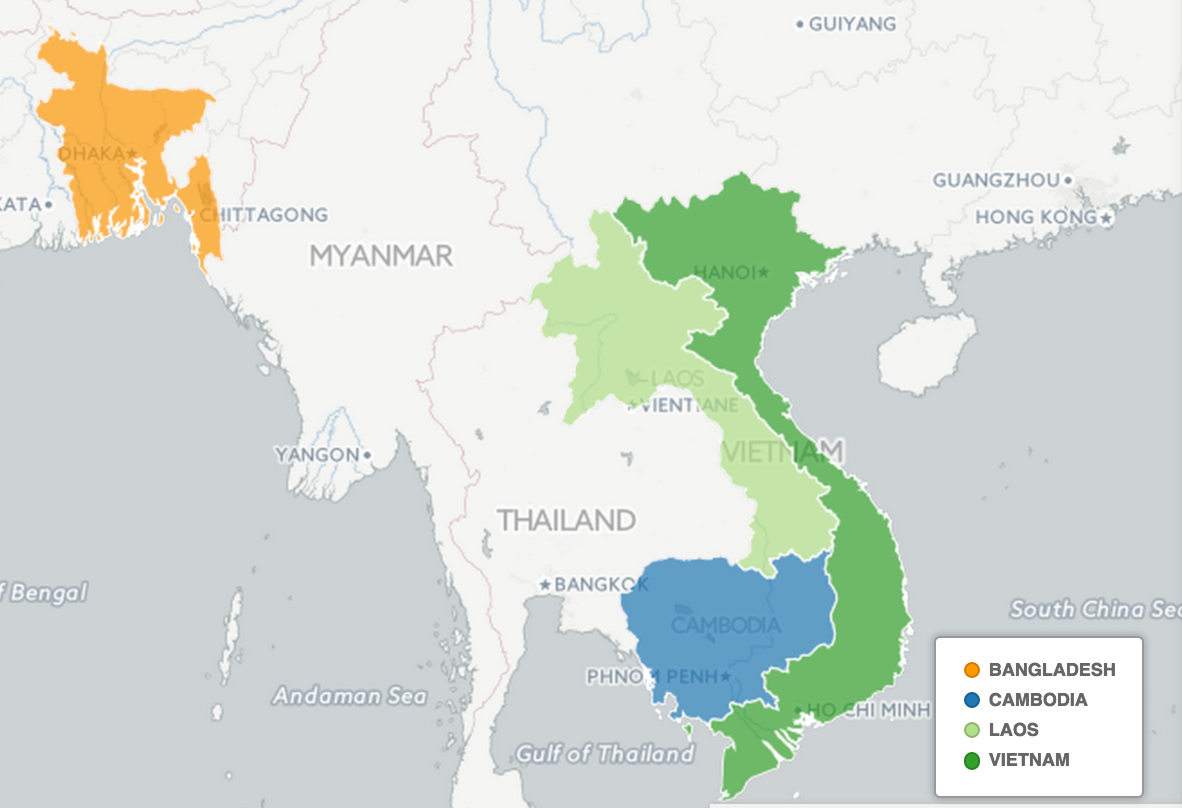
More sample data! (exercise)
1. Leave your map, then:
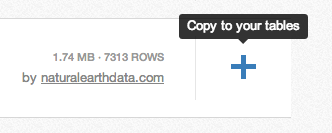
2. Go back to your map, then:
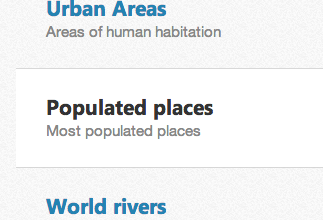
 >Cultural datasets>
>Cultural datasets>Your first visualisation
Working with layers
Exercise:
1. Turn each layer on/off
2. Change the order of layers
3. Change the style of the new layer
Two layers at once
Challenge. You know the drill. :)
Visualisation
1 visualisation = 1+ layers
1 layer: 1 map
1, 2 = switch layers
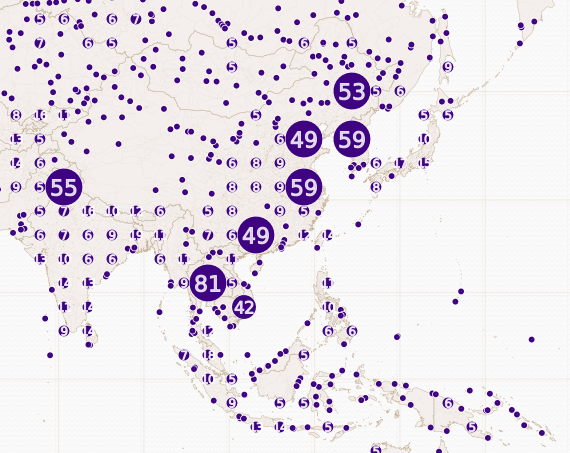
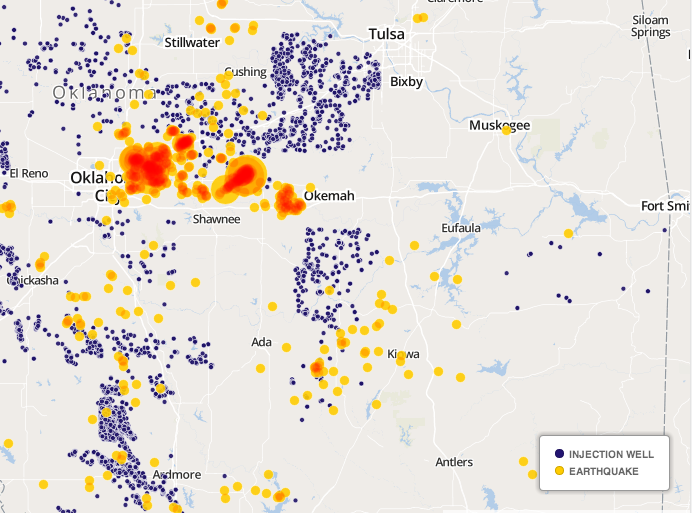
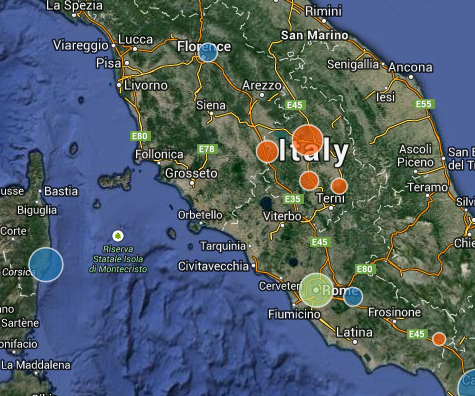
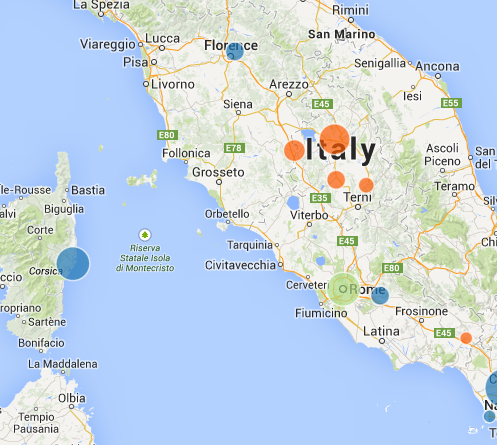
visualisations for bigger data
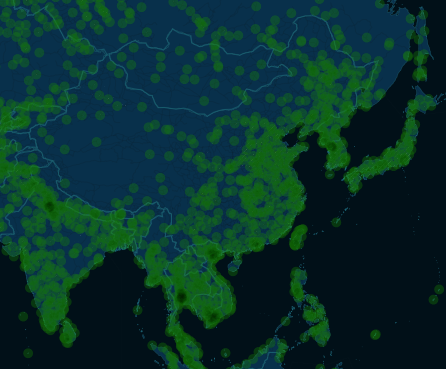
Intensity
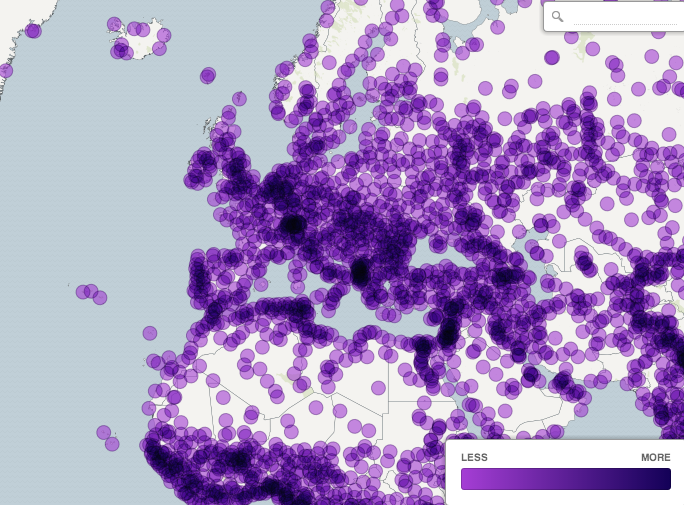
Density
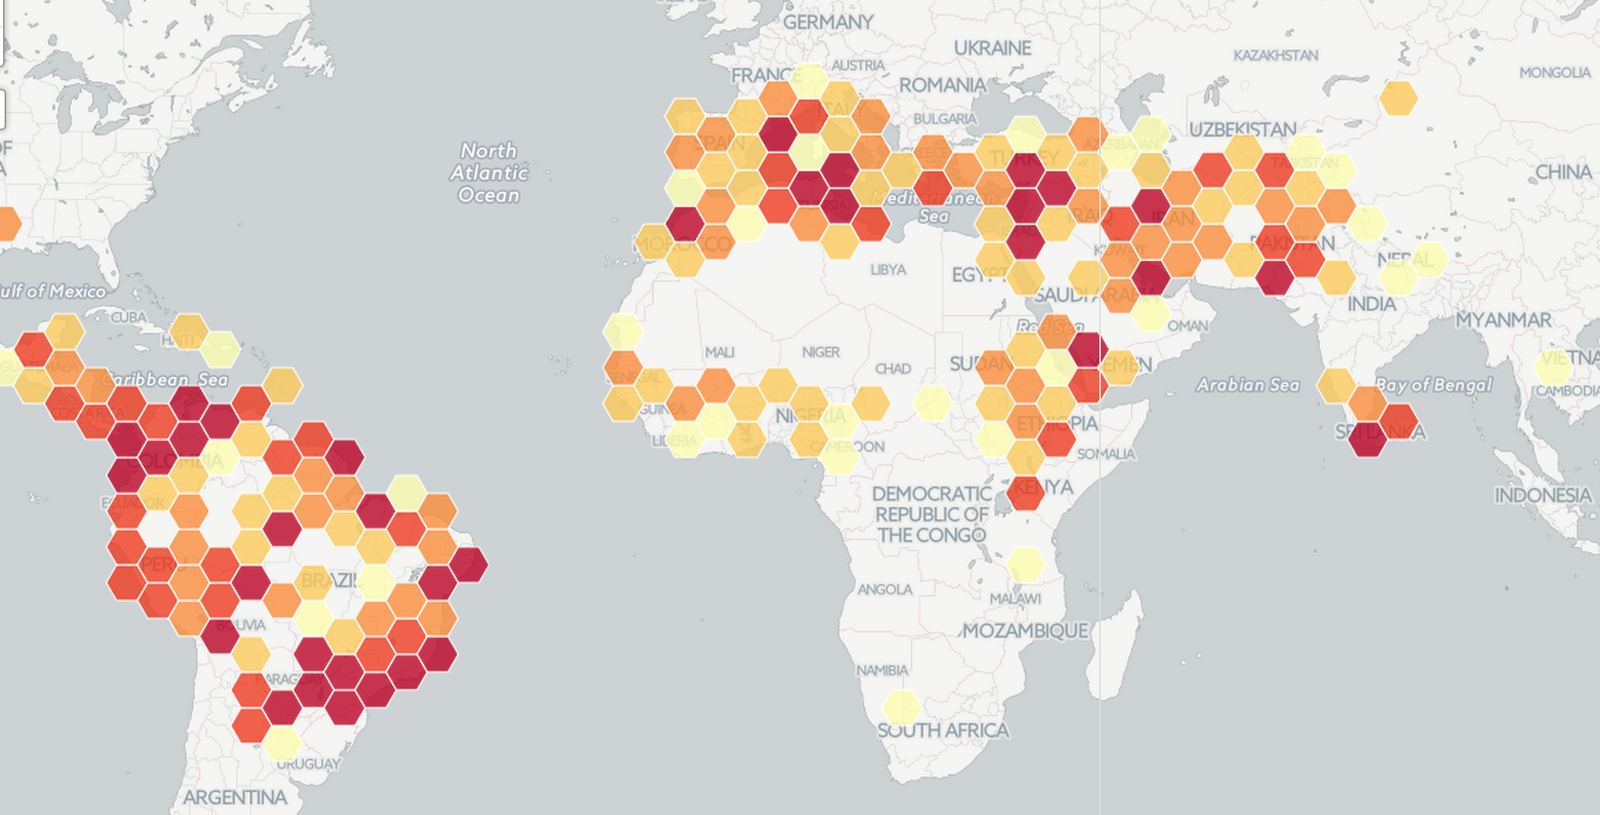
Category or Choropleth?
"Bronze", "Copper", "Stoneware" → Category
1.2, 5.3, 2.4 → Choropleth
Cluster, Intensity or Density?
Experiment!

Buckets
1,2,3,4,5,6,7,8,9,10
3 buckets
1,2,3 4,5,6,7 8,9,10
(sort of)
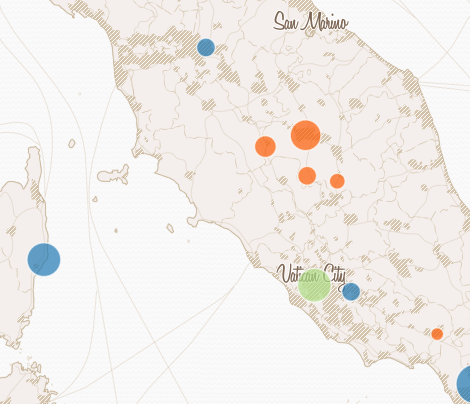
Custom styling
CartoCSS
CartoCSS doc:
https://www.mapbox.com/carto/api/2.3.0/ Geocoding
Creating lat/longs
Where before there were none

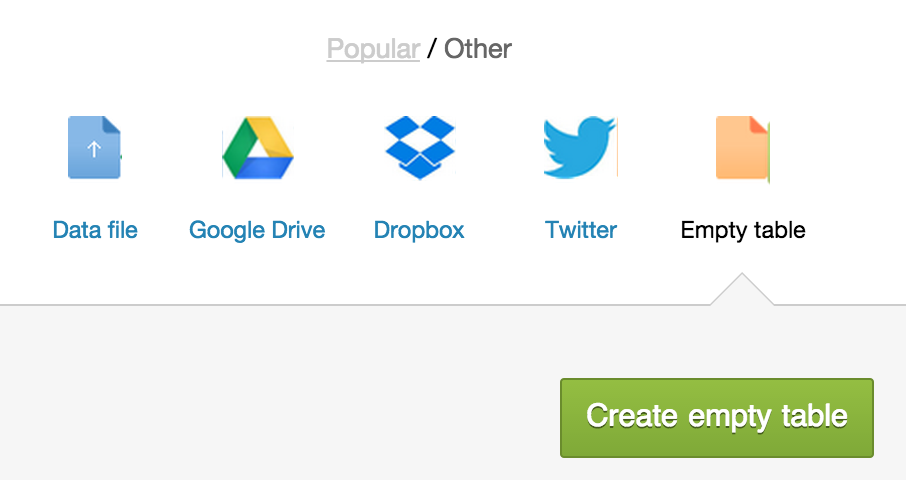
Make a new table
Add some addresses or place names
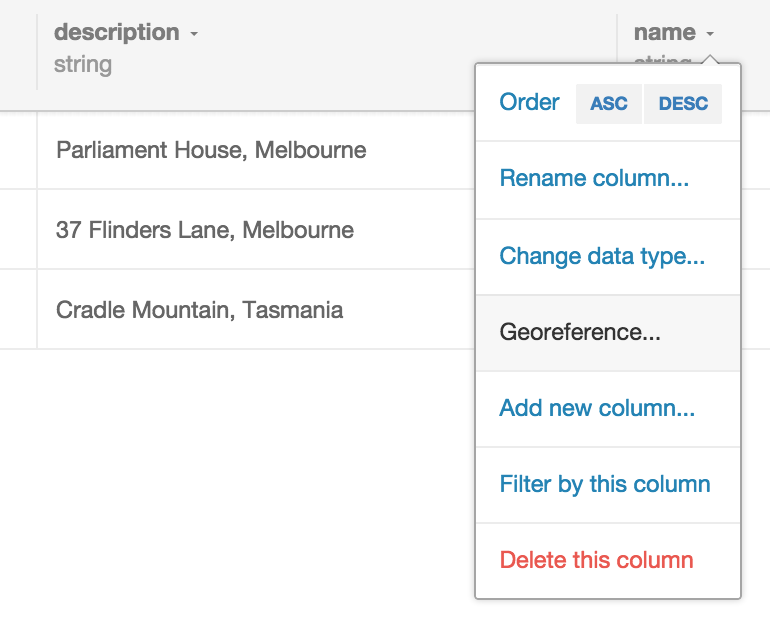
Georeferencing
Works better with context: Victoria, Australia
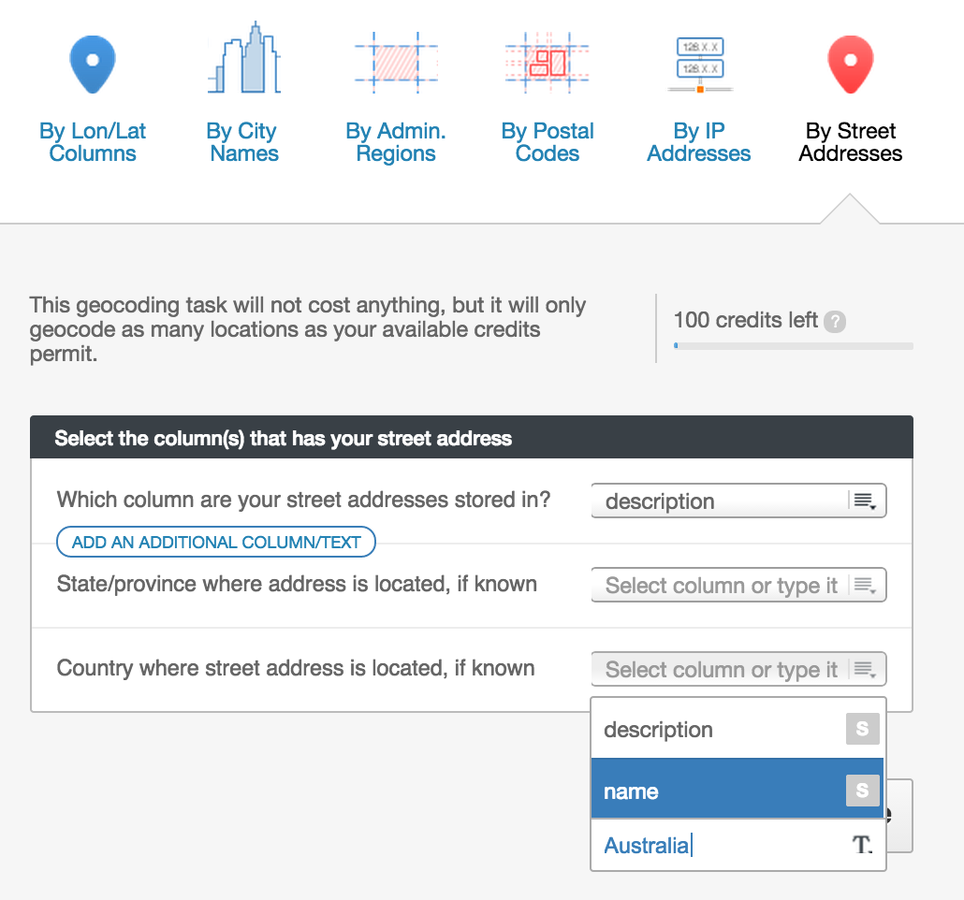

addresses cost $$$
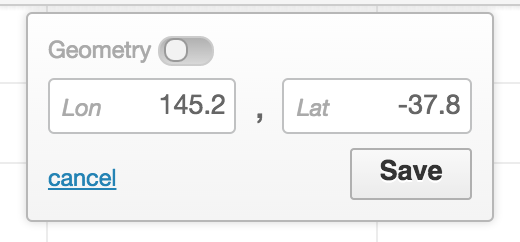
Instead, provide your own lat/lon:
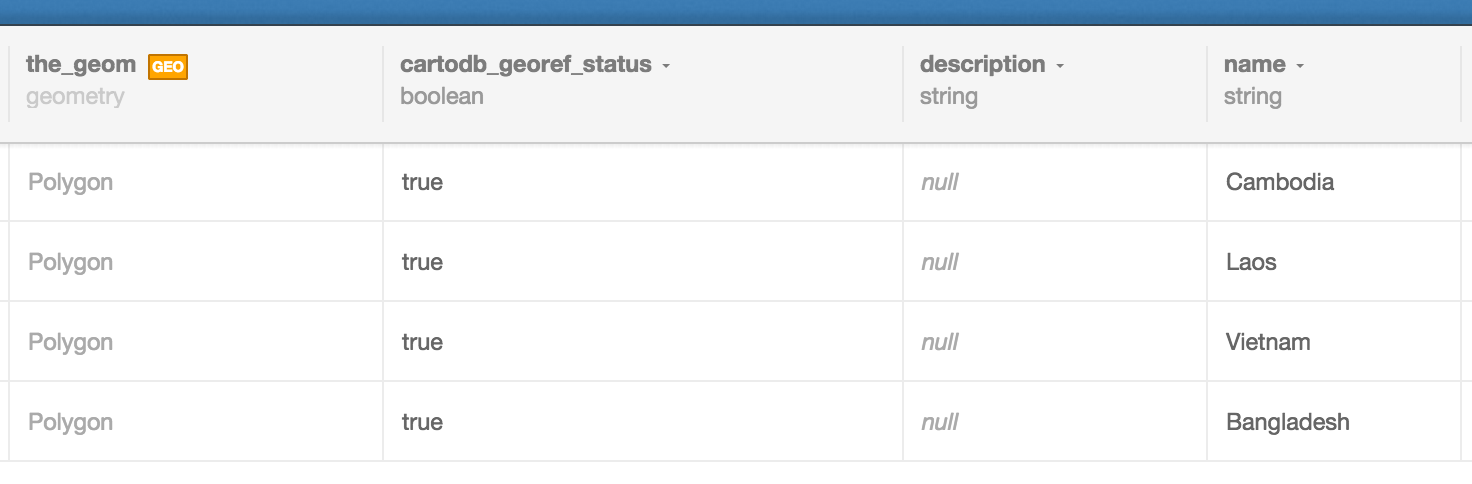
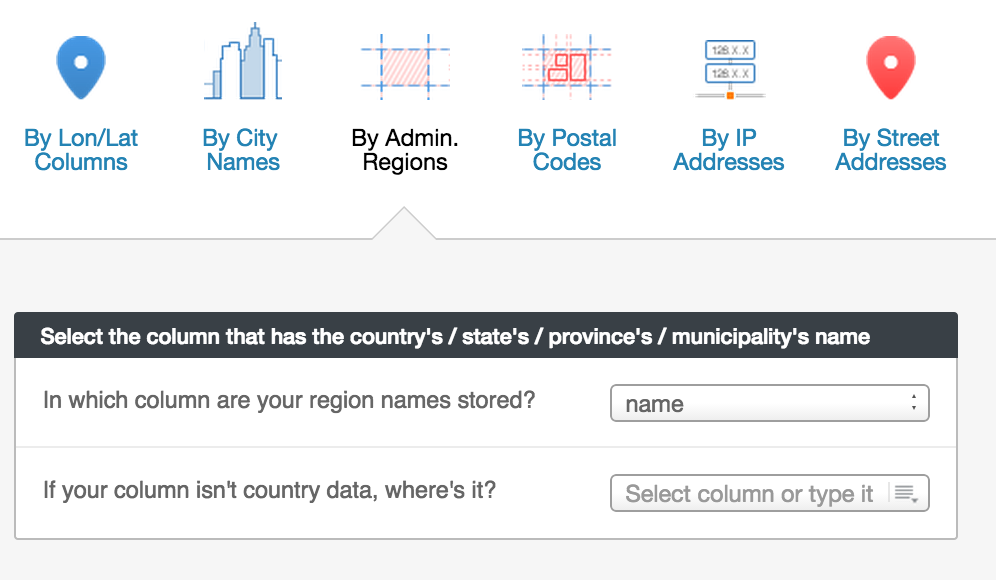
Or: Match admin regions (polygons) *
Match admin regions
a free way with GOogle sheets
1. Follow all instructions here:
https://github.com/mapbox/geo-googledocs 2. Geocode stuff in Google Sheets
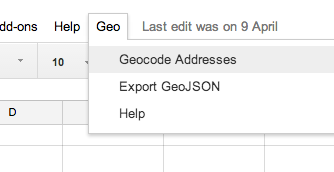
3. Import
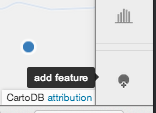
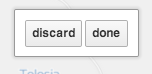
Adding data
Add feature. Click. Done. Click. Edit data. Save and close.
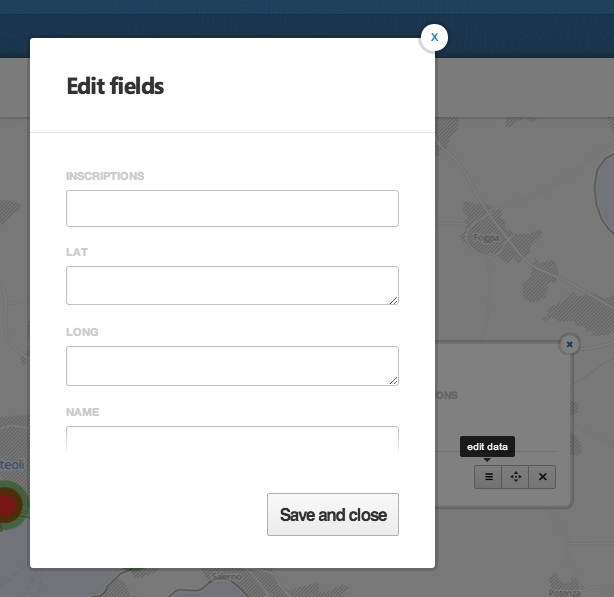
Or...
Add row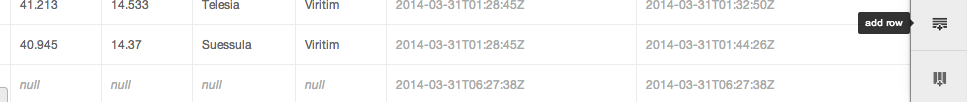
Then lat/long
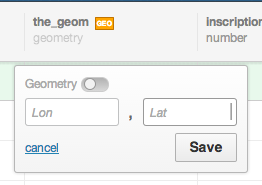
More data!
CartoDB supports:
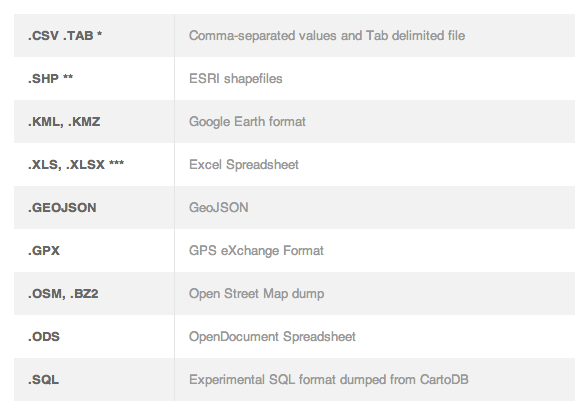
AURIN, data.gov.au, CartoDB "common data", Google...
Advanced
Basic SQL
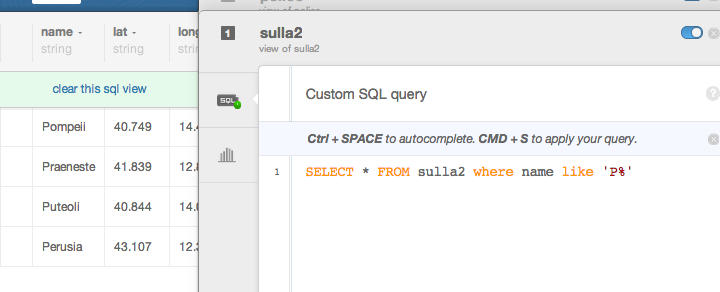
Filter, group, aggregate, calculate
SELECT * FROM sulla WHERE name LIKE 'P%'
SELECT * FROM sulla WHERE name LIKE 'P%'
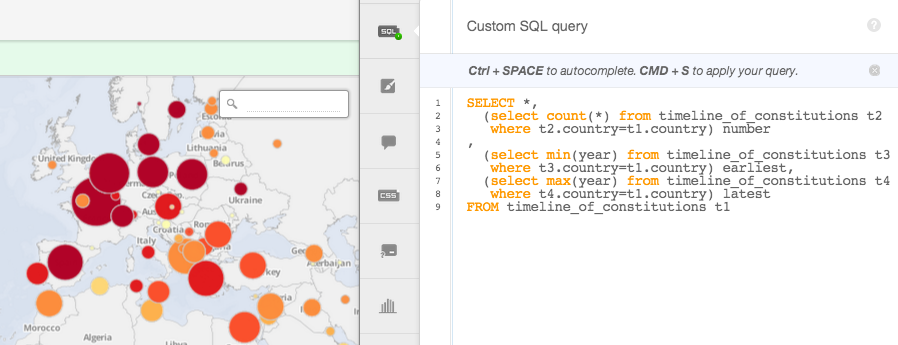
Not basic SQL
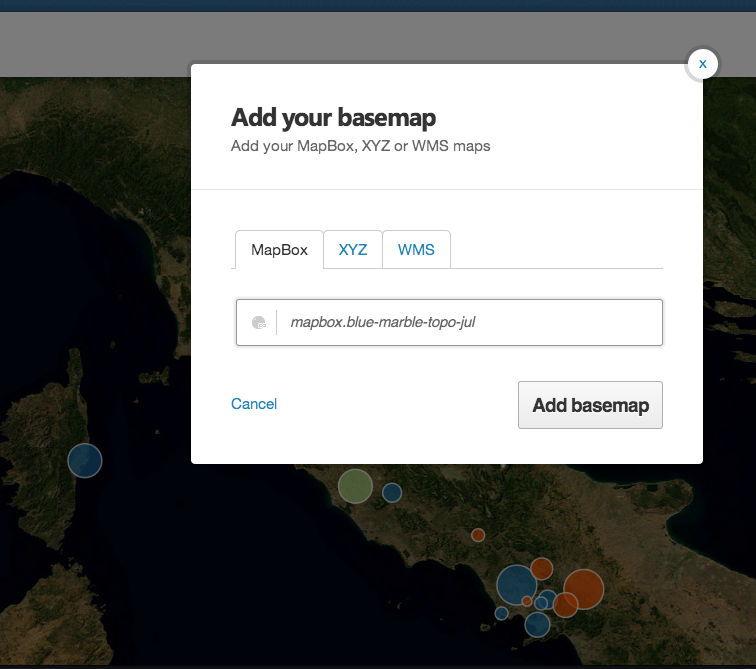
Any basemap

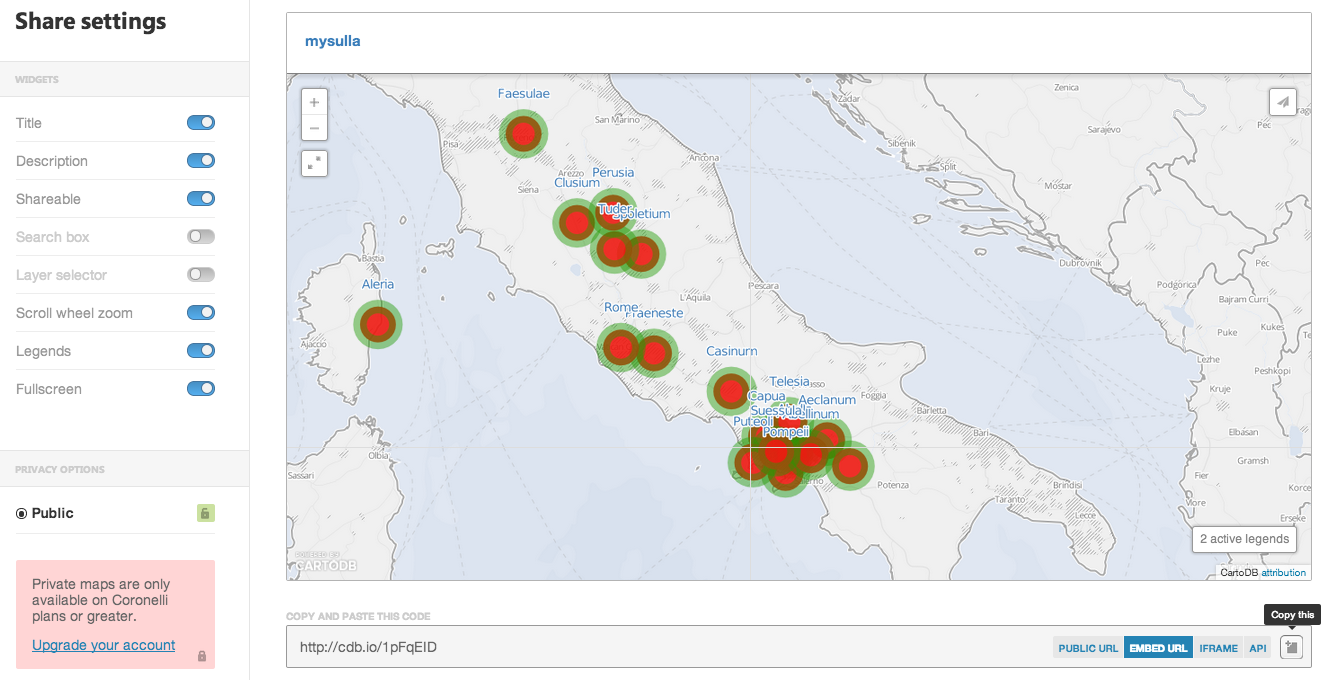
Sharing
More help?
CartoDB documentation
gis.stackexchange.com
steve.bennett@unimelb.edu.au
Drop-in sessions
Feedback please!
intro to Cartodb
By stevage