A whirlwind tour of Data Science
Steve Ash
@steve_ash
manycupsofcoffee.com
About Me
- BA, MS, PhD (almost) Computer Science
- 10 years building banking and healthcare software
- 5 years leading "skunkworks" R&D team
- Poor speller (relevant)
What's this talk?
- Broad, shallow tour of data science tasks and methods
- Intuition, not math*
- Biased to a computer science pov
- Sorry statisticians, physicists, signal processing folk
- Necessarily incomplete
* ok it turns out there is a little math
What's a Data Science?
- No pedantic definitions here, but themes:
- Tools to extract meaning from lots of data
- Explore structure and relationships in data
- Multi-disciplinary, yay!
- Statistics
- Computer Science
- Electrical/Computer Engineering
- Econometrics
- Multi-disciplinary, boo!
- Different names for same thing
- Math notation, conventions
Data Science
Data Mining
Machine Learning
Predictive Analytics
Artificial Intelligence
Knowledge Discovery
Obligatory Graphics


Tour Outline
- Process
- Exploration
- Single points of data
- Structure of data
- Modelling themes
- Task Families
- Method families
- Learning, Optimization
- Now the bad news
It's an iterative process
- Problem definition - who cares about this?
- Data preparation - easy systematic access
- Data exploration - signal vs noise, patterns
- Modelling - noisy inputs -> something useful
- Evaluation - what is good?
- Deployment - from science to end users
Exploration
Data Exploration
- Data types
- Discrete: Categorical: Red, Blue,...
- Continuous: Numerical: [0, 1], x > 0
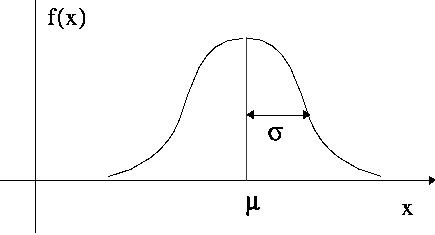
- Exploring single attributes
- Mean, Variance
- Skew, Kurtosis
- Mode


Data Exploration
- Exploring Single Values (cont)
- Median, quantiles, box-plots
- Histograms
- Exploring Pairs of Values
- Co-variance - how two attributes change together
- Pearson correlation coefficient - how two attributes change together vs how change individually
- t/z-test, ANOVA


Data Exploration
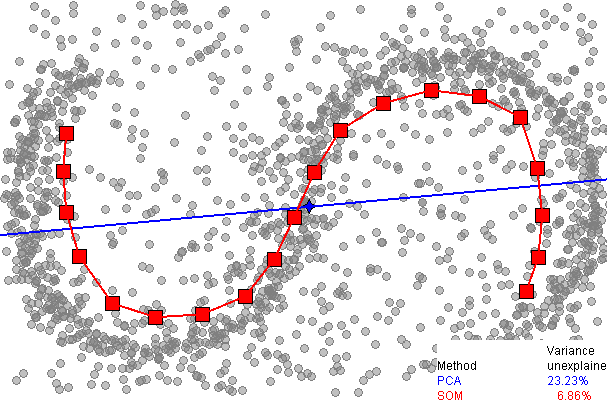
- Exploring structure of data aka dimensionality reduction
- Principle component analysis
- what directions explain the most variance
- Linear method
- Kernel tricks + linear methods
- Manifold learning
- Assume there is some lower dimensional structure
- Auto-encoders
- Neural Networks trained on the identity function
- Principle component analysis


Modelling Themes
Modelling Themes
- Model? Explain/predict some output by some inputs
- Minimize error
- Why build models at all?
- Incomplete noisy data
- Discover some latent, hidden process
- Describe phenomena in more compact form
- Themes
- Bias vs Variance
- Parametric vs non-parametric
- Frequentist vs Bayesian

Bias vs Variance
- Bias vs Variance: two sources of error
- Bias - how much does this model differ from true answer on average
- Variance - if I build a lot of models using the same process how much will they vary from one another
- Want low+low, but often they're antagonistic
- Intuition: predicting election results
- Only poll people from phone book, that model is biased towards home-phone owning folks -- doesn't matter how many people you poll
- Only poll 30 people from phone book and you do it multiple times--each time the results might vary. If you increase the number of people, variance will go down
Bias vs Variance
- Generally the challenge of model fitting: do not want to over-fit or under-fit
- In machine learning, we use a methodology of cross-validation
- train vs test
- train vs dev vs test
- n-fold validation

Bias vs Variance
- Variance via model complexity
h_0(x) = b
h_1(x) = a x + b


\theta
Parameters =
Parametric vs Non-parametric
- A few ways to say the same thing?
- Is there a hidden process that can be described by finite, fixed parameters and can explain the observed data?
- Can the data or process be described by a shape that has convenient math properties?
- Parametric statistical tests assume distributions
- Non-parametric make fewer assumptions but are often harder to interpret and less powerful

Frequentist vs Bayesian
- Philosophical difference over interpretation of probability - we'll skip that
- How it matters to the everyday data scientist?
- Bayesian treatments
-
Quick probability review:
- % chance of clouds at any moment
- % chance of rain, given its cloudy
- Bayes rule:
P( \text{Rain} | \text{Clouds} ) = \frac{P( \text{Clouds} | \text{Rain} ) P( \text{Rain} )}{P( \text{Clouds} )}
P( \text{Clouds} )
P( \text{Rain} | \text{Clouds} )
\text{Posterior} \propto \text{Likelihood} \times \text{Prior}
P( \text{Stroke} | \text{Headache} ) = \frac{P( \text{Headache} | \text{Stroke} ) P( \text{Stroke} )}{P( \text{Headache} )}
Frequentist vs Bayesian
- Our models have parameters, θ, which we set via machine learning based on training data, D
- Allows us to engineer some expert knowledge about the parameters to combat problems with data sparsity, noise, etc.
- Learning process doesn't find a set of specific parameter values, it finds a distribution over all possible parameter values
- Google for maximum a posteriori estimation (MAP) vs maximum likelihood estimation (MLE) if you're interested in more
P( \theta | D ) = \frac{P( D | \theta ) P( \theta )}{P( D )}
Task & Method Families
Task Families
- Regression
- Classification
- Structured Prediction
- Clustering
- Others
Method Families
- Linear models
- Probabilistic methods
- Decision Trees
- Support Vector Machines
- Neural Networks
- Stochastic/Evolutionary methods
Task Families
- Regression
- Predict a continuous output value given some input
- E.g. How many inches of water will fall for cloudy may day?
- Classification
- Predict a categorical output value given some input
- E.g. Is this credit card transaction fraudulent?

Task Families
- Structured Prediction
- Given this sequence of inputs, predict a sequence of outputs
- E.g. Assign Parts-of-speech tags to each word
- Clustering
- Group data points in some way that provides meaning
- E.g. discovering customers that have similar purchasing habits
Task Families
- Others
- Object extraction, identification in images
- Planning, optimization
- Time series prediction
Model Families
- Linear Methods
- no exponents in terms
- Linear Regression
- each input variable has a parameter representing the weight of how much that input contributes to the output
- multiply weight * input and add 'em up to get output
- Regularization - try and encourage the parameter values to stay within a given range
- Lot's of math tricks that work with this constraint
y(x, \theta) = \theta_0 + \theta_1 x_1 + \theta_2 x_2 + \cdots + \theta_n x_n
Model Families
- Probabilistic models
- Generative vs Discriminative
- Discriminative: model the desired target variable directly
- Generative: model a conditional process that generates values then use bayes rule
- Naive Bayes
- Simplest, generative classifier
- Logistic Regression
- Powerful discriminative method of classification
- Weights the "log odds" of each input
- Powerful discriminative method of classification
- Generative vs Discriminative
P(C_1|x) = \frac{P(x | C_1) P(C_1)}{P(x | C_1) P(C_1) + P(x | C_2) P(C_2)}
Model Families
- Probabilistic Graphical Models
- E.g. bayes nets, markov random fields, factor graphs
- Framework for encoding dependence relationships
- Hidden Markov Model (generative)
- Conditional Random Fields (discriminative)


Model Families
- Decision Trees
- C4.5, C5 popular; especially good at categorical data
- Typically used for classification, but CART does regression in the leaves
- Each node in the tree represents the best way to split the data so each sub-tree is more homogenous than the parent
- At test time, follow tree from root to leaf
- Random Forests
- Build lots of trees from resampled training data
- Average or vote the results
- Reduces overfitting
- Example of the technique: bagging
Model Families
- Support Vector Machines (SVM)
- Find an optimally separating plane
- Math tricks (finding support vectors, kernel trick)
- Excellent discriminative method, commonly limited to binary classification
- Neural Networks
- Feed forward, recurrent, hopfield, ARTMap, boltzmann machines, oh my!
- Deep learning: stacking networks + clever training
- Stochastic/Evolutionary
- When all else fails, search forever
- Particle Swarm (PSO) et al
Learning, Optimization
Learning, Optimization
- Convex optimization
- Many methods deliberately assume distributions or constrain the function such that it is convex
- Calculus tricks (gradients, line search, LBFGS)
- Stochastic optimization
- Problems
- Curse of dimensionality
- Tractable inference
- Large graphical models with lots of dependence
- Incomplete training data
- Semi-supervised learning
- Imputation
- Expectation constraints, posterior regularization
Now the bad news
- Data Science is hard
- Which methods, which constraints on methods
- Mathematical details of model leads to intuition
- Mind boggling amount of information, growing quickly
- Multi-disciplinary history -> overlapping concepts, words, notation -> confusion
- Tools are maturing quickly but there is still large gap between day to day exploration and modelling and production end-user value
- Hard to hire
- Unicorns are hard to find
- Easy for ignorant charlatans to convince otherwise unsuspecting non-technical people that they know how to data science
The End
A brief, whirlwind tour of data science
By Steve Ash