Data Science & Machine Learning
Artificial Intelligence
Sumendar
What I do:
-
Certified Big Data Analyst, Data Science
-
Analytics.CLUB Hyderabad - co-organiser
-
Thought Leadership, Data Journelism
Deep Dive
-
What is Data Science?
-
Why? &
-
What Data Science Can Do?
-
Market Research & Analysis
-
Job Demand & Future
-
Tools, Technologies & Skills
-
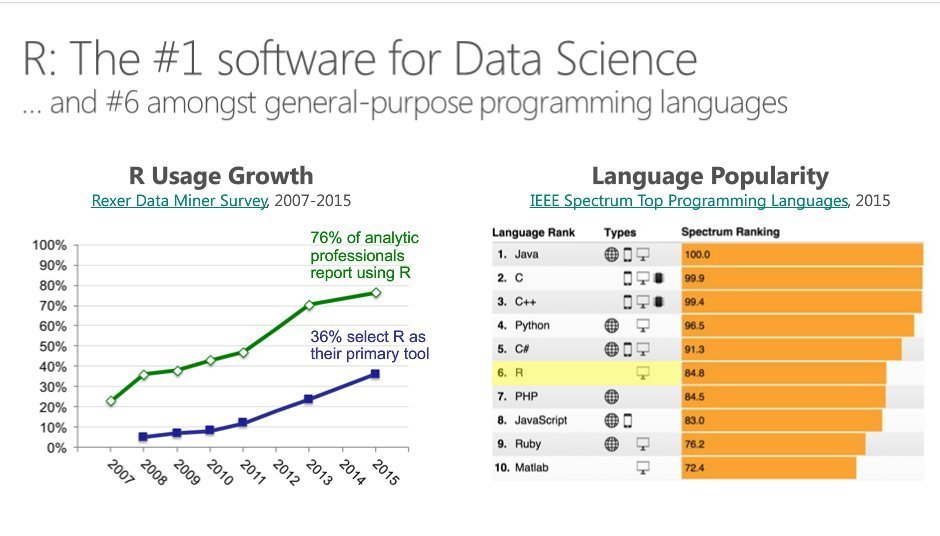
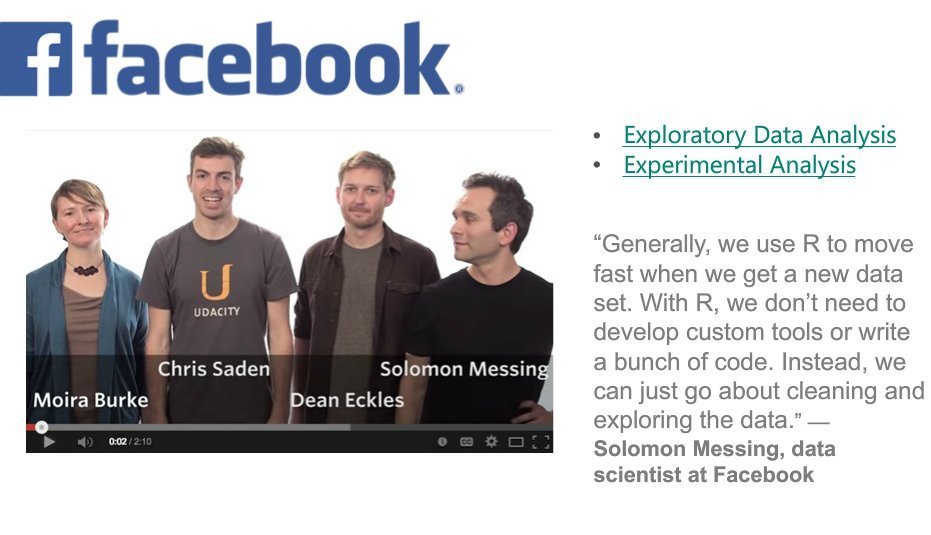
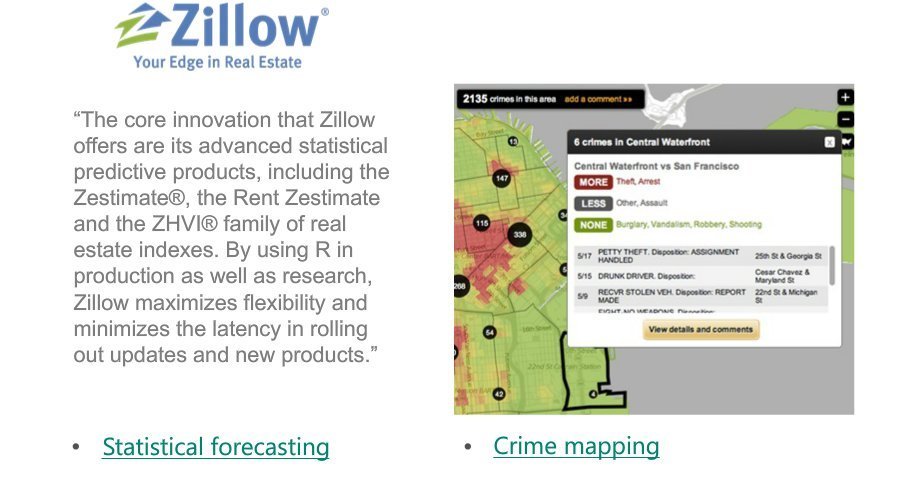
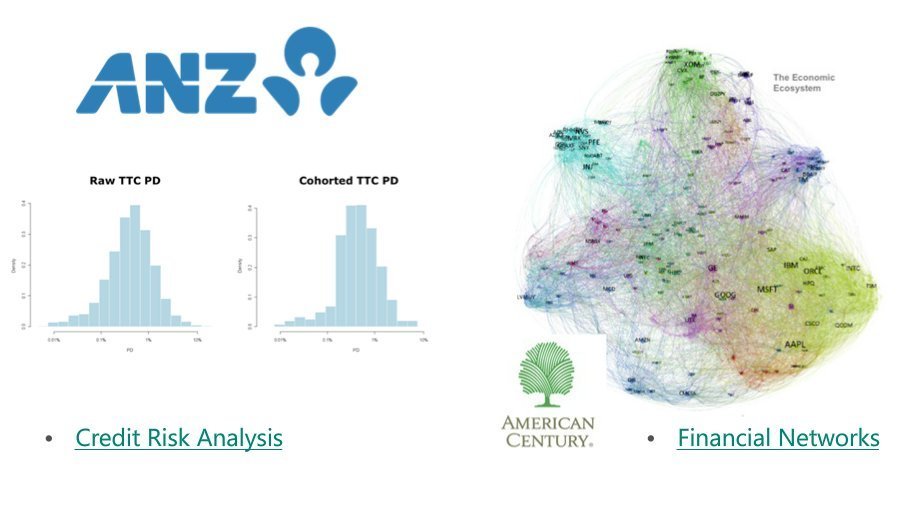
Power of R Programming
-
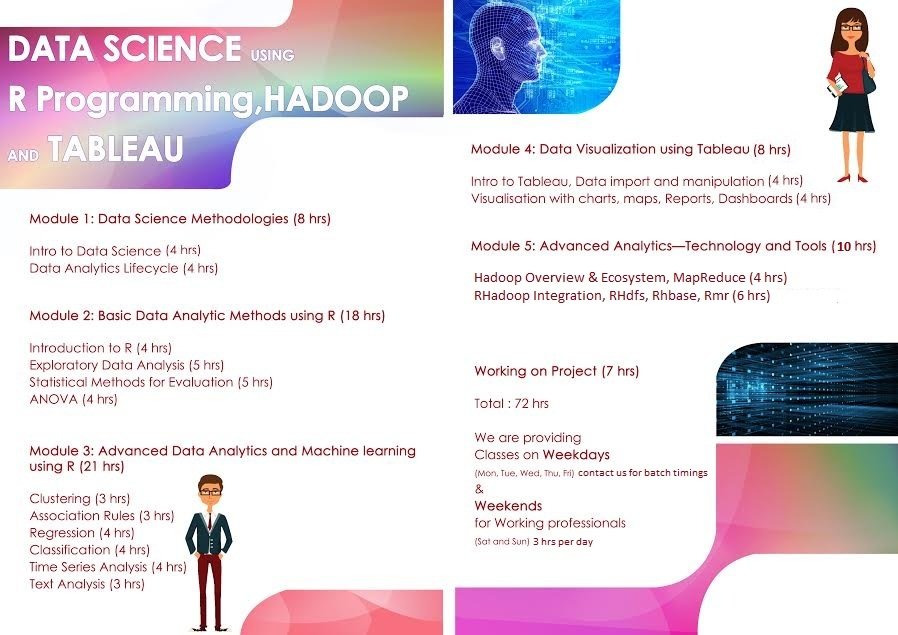
Neo Cursor Curriculum
-
Micro-Internship Program
-
Q & A
What is Data Science?
To gain insights into data through computation, statistics and visualization
The ability to take data—to be able to understand it, to process it, to extract value from it, to visualize it, to communicate it—that’s going to be a hugely important skill in the next decades - Hal Varian
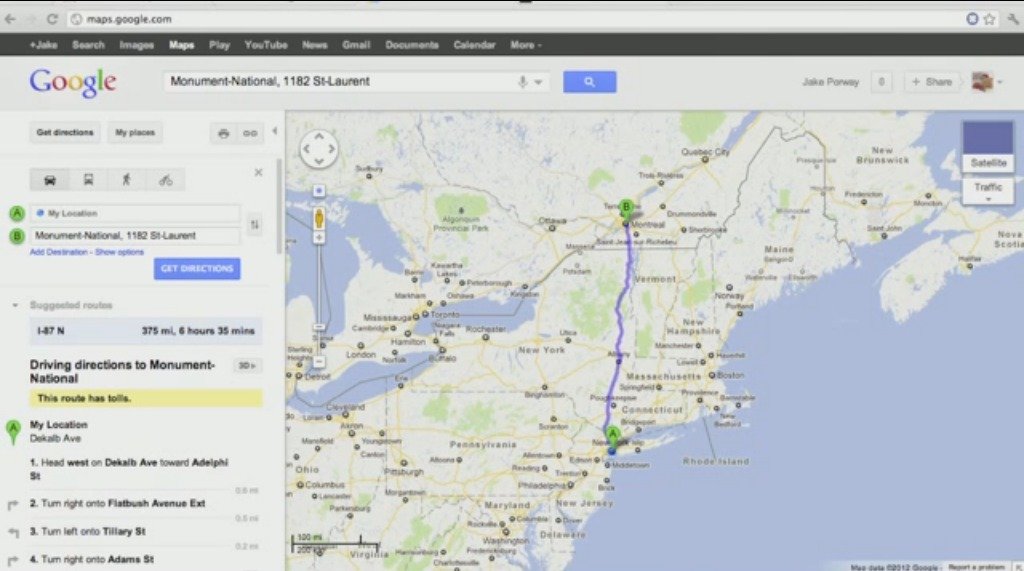
Why?
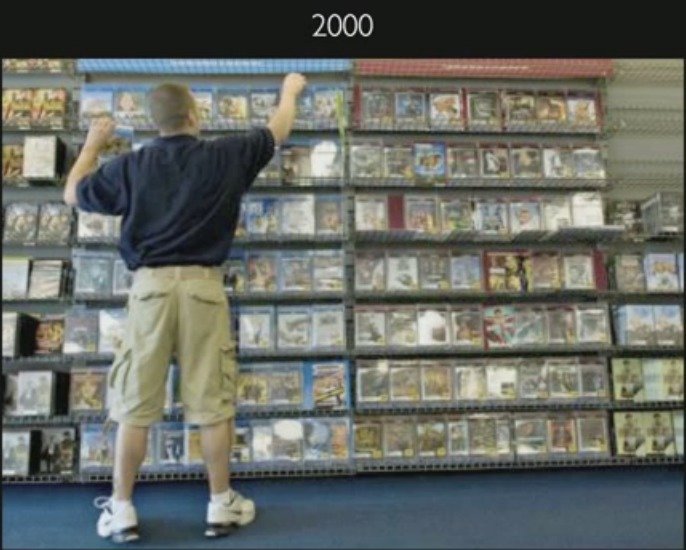
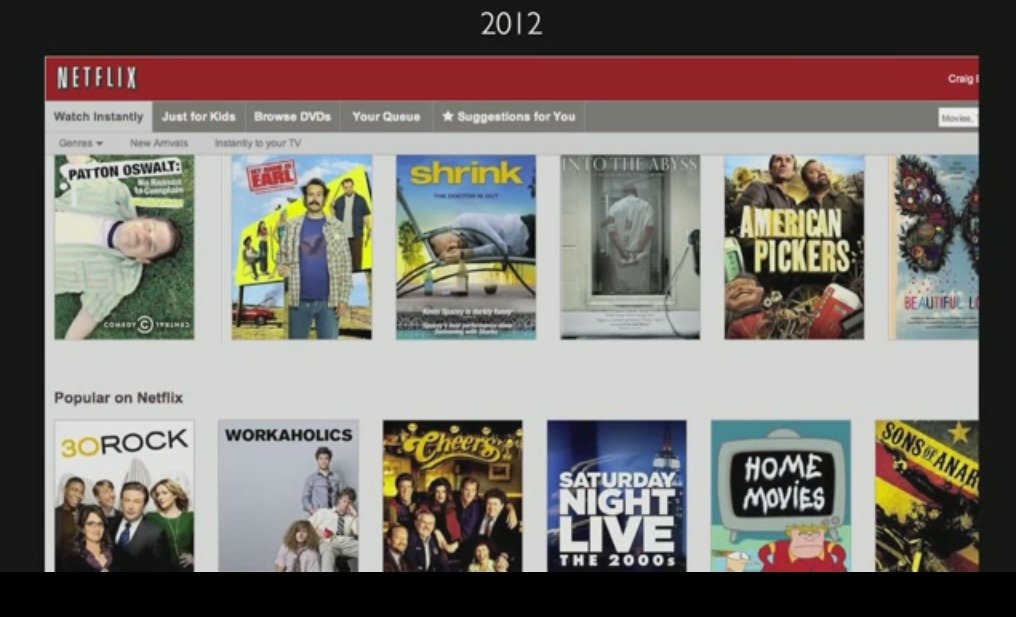
2016

What Data Science Can Do?
- Predict whether a patient hospitalized due to a heart attach, will have a second heart attach. The prediction is to be based on demographic, diet & clinical measurement for that patient..
- Predict the price of a stock in 6 months from now, on the basis of company performance measures & economic data.
- Identify the risk factors for prostate cancer, based on clinical & demographic variables.
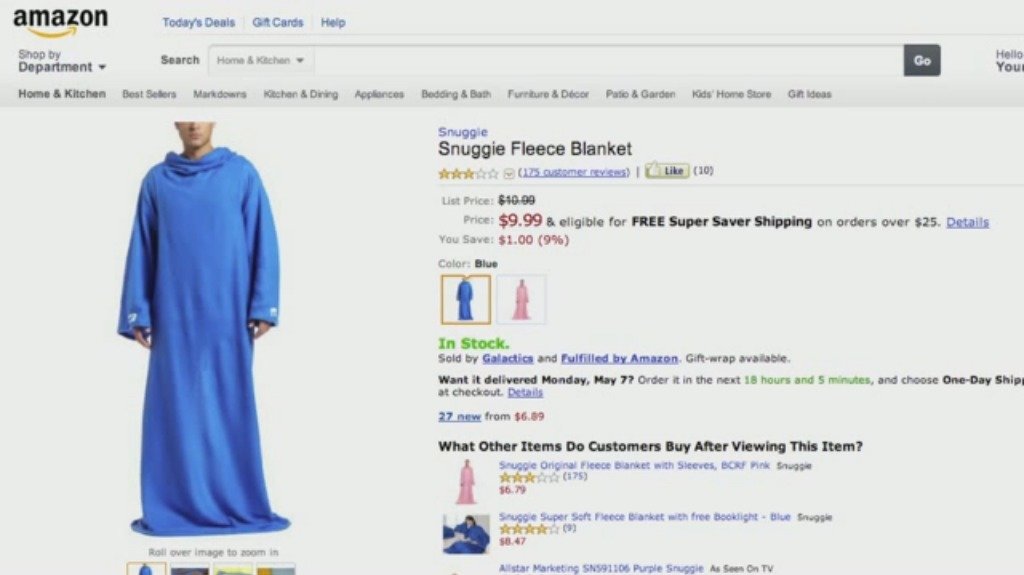
- It can also figure out whether a customer is pregnant or not by capturing their shopping habits from retail stores
- It also knows your age and gender, what brands you like even if you never told., including your list of interests(which you can edit) to decide what kind of ads to show you.
- It can also predict whether or not your relationship is going to last, based on activities and status updates on social networking sites. Police departments in some major cities also know you're going to commit a crime.
- It also tells you what videos you've been watching, what you like to read, & when you're going to quit your job.
- It also guess how intelligent you are how satisfied you are with your life, and whether you are emotionally stable or not -simply based on analysis of the 'likes' you have clicked
this is actually just the tip of the iceberg
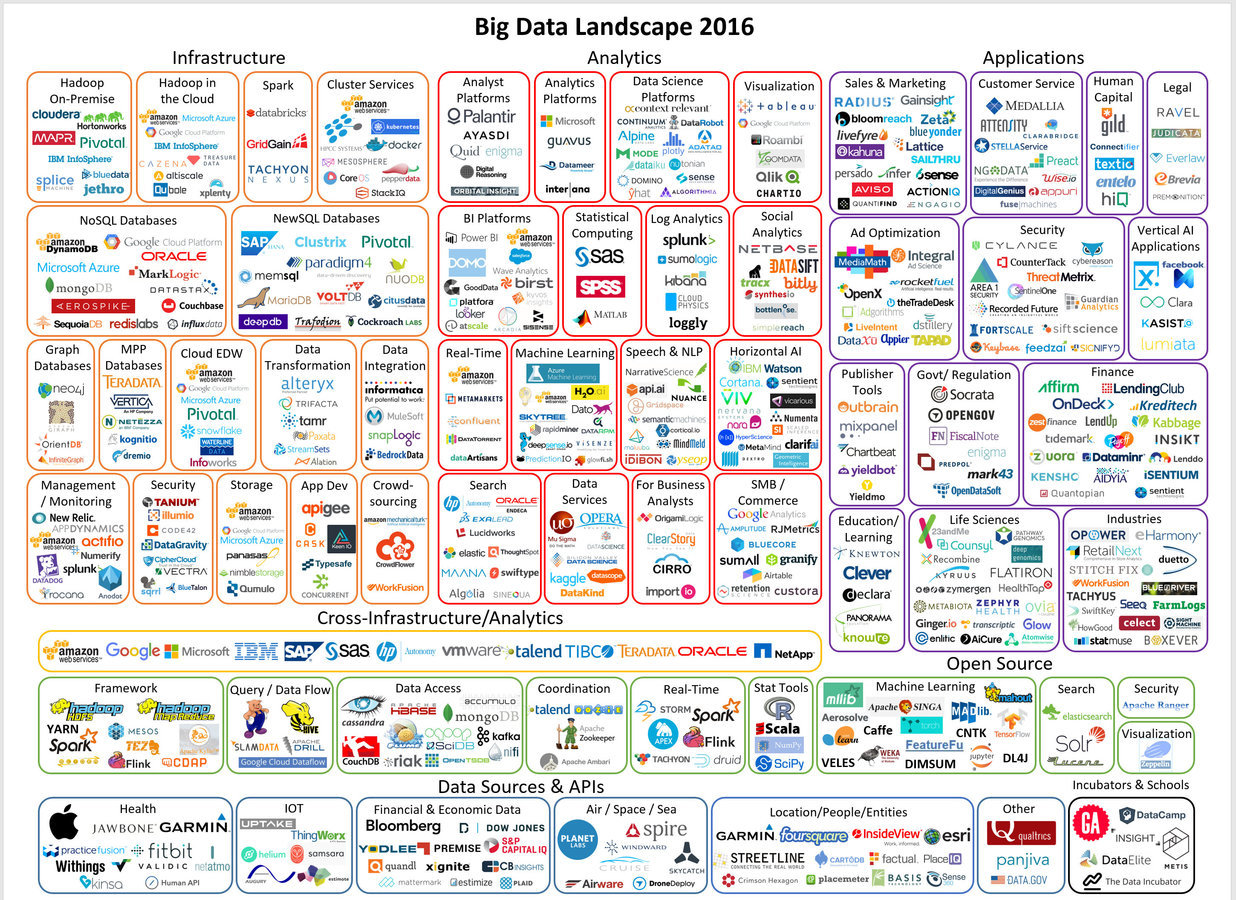
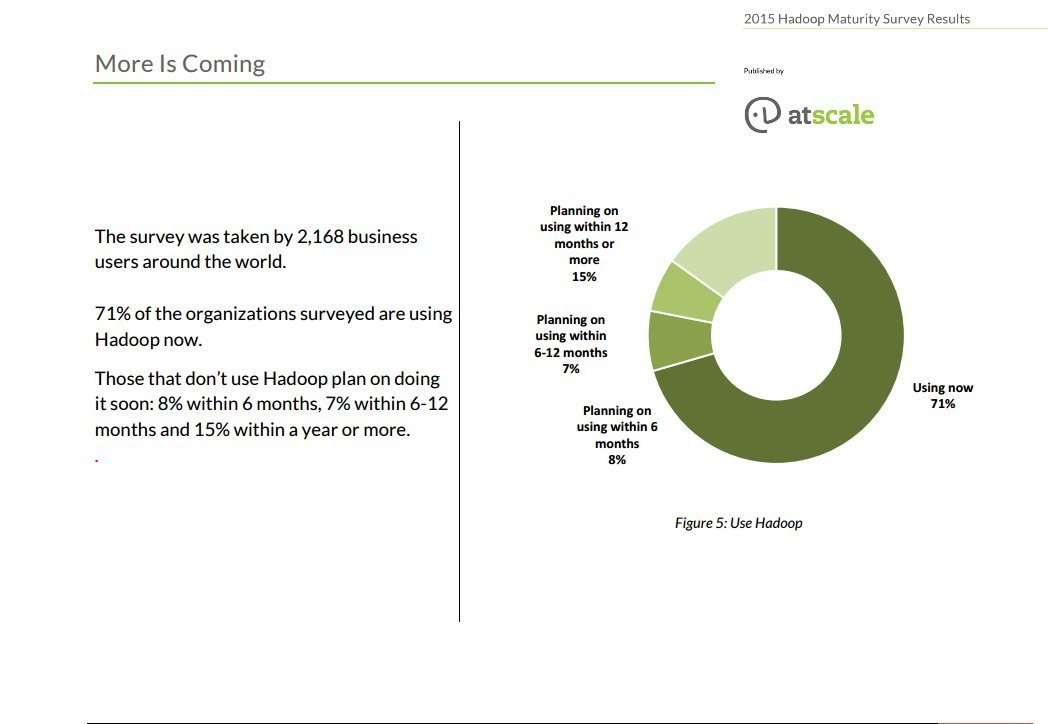
Market Research & Analysis
Big data: The next frontier for innovation, competition, and productivity - McKinsey (May 2011)
Data Scientist: the sexiest job of the 21st century - Harvard Business Review (Oct 2012)
The number of vendors providing big data analytics will triple over the next three years - IDC (Dec 2013)
Get Familiar With Big Data Now—or Face 'Permanent Pink Slip' Demand Rises for Analytics Professionals, Data Scientists - The Wall Street Journal (April 2014)
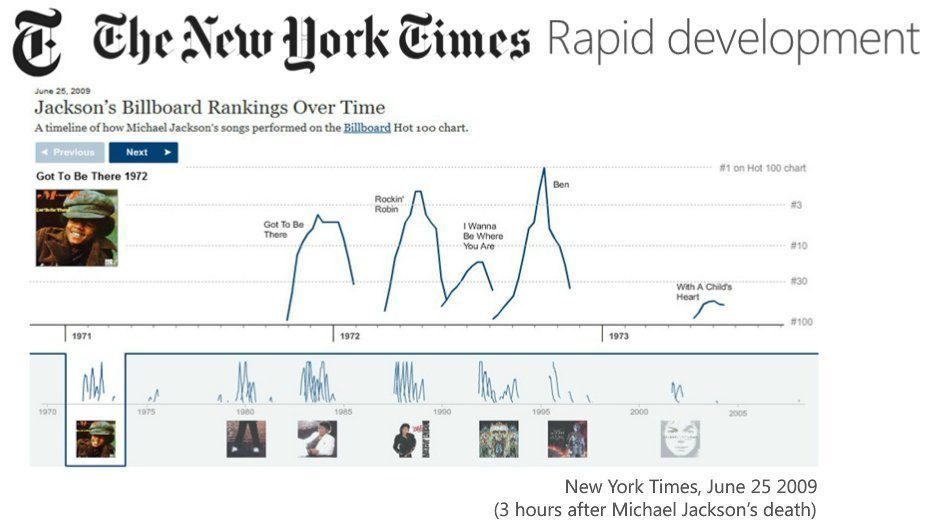
Less Noise but More Money in Data Science - The New York Times (April 2015)
Students Flocking to Analytics & Data Science – A Good Thing? - Business 2 Community (Feb 2016)
The Data Science Talent Imperative
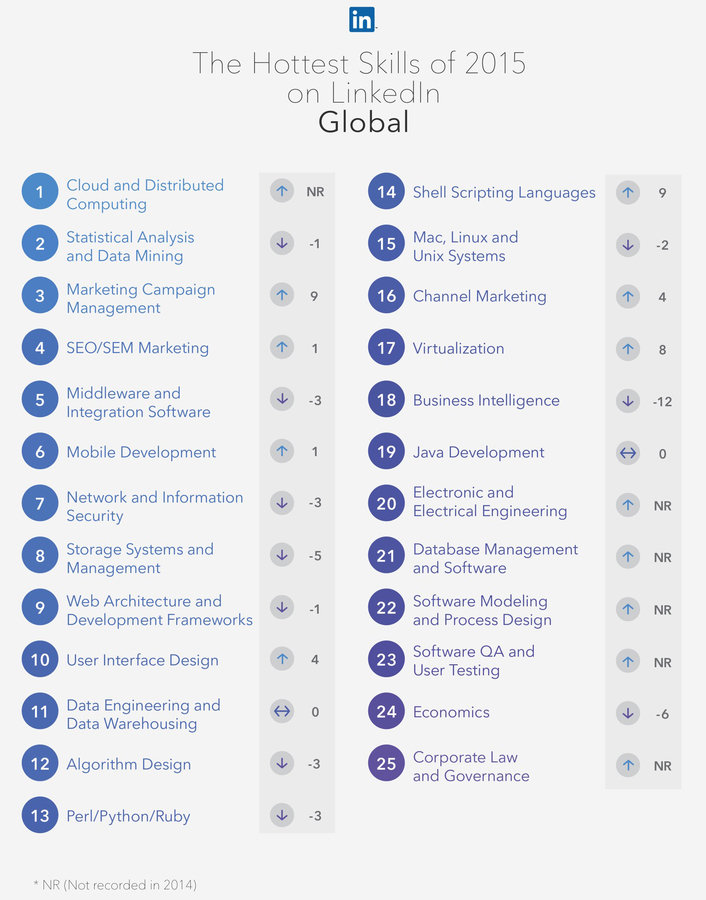
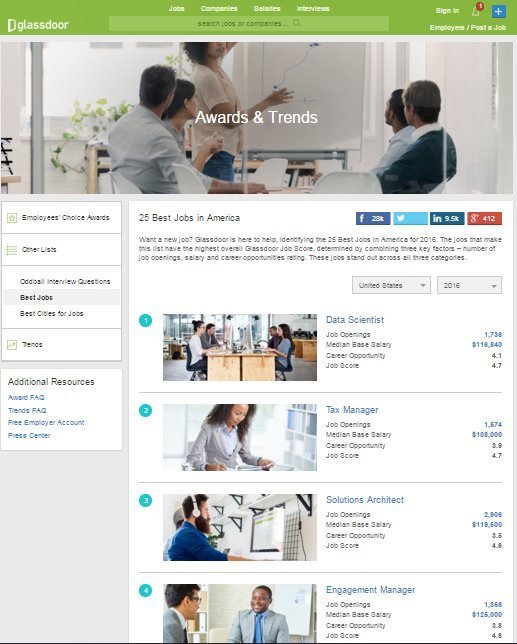
Job Demand & Future
The 25 Skills That Can Get You Hired in 2016 - Linkedin
Data Scientist: 25 Best jobs in America For 2016 - Glassdoor
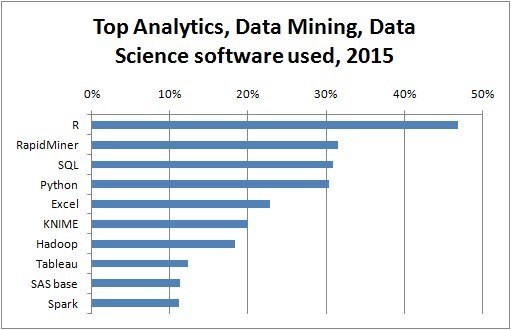
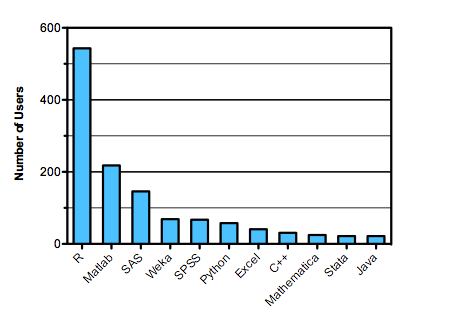
Tools, Technologies & Skills
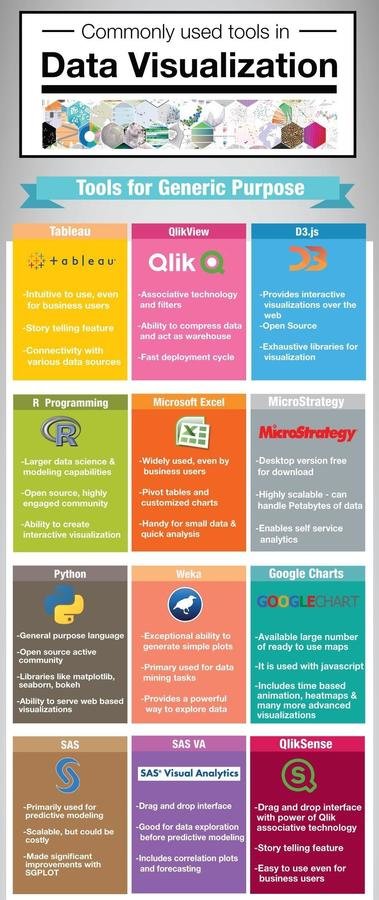


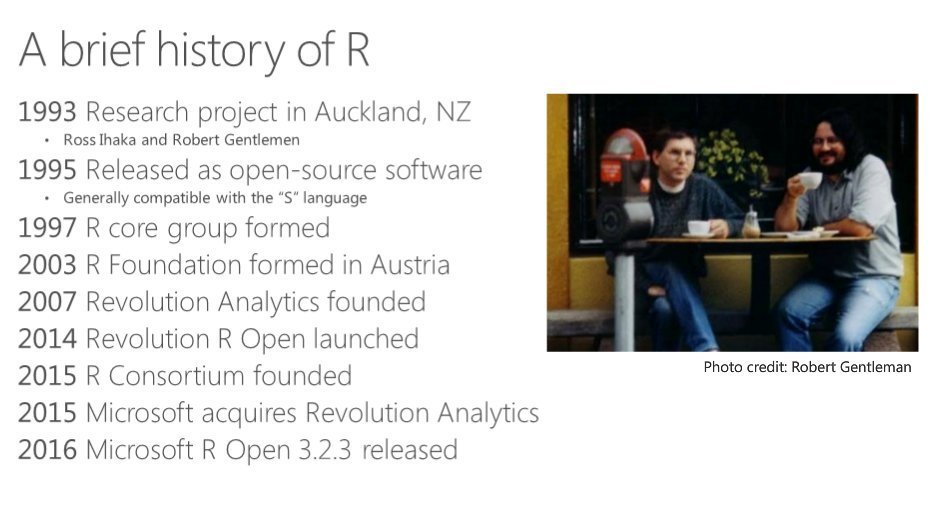
Power of R Programming
 Save
Savehttps://www.kaggle.com/wiki/Software

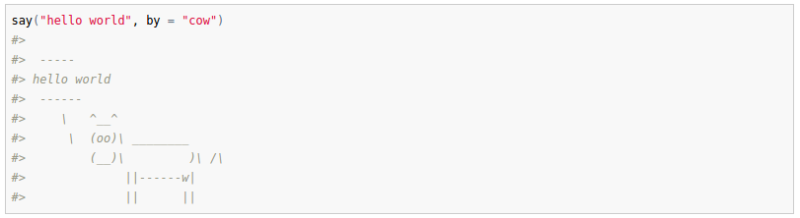
Packages - cowsay
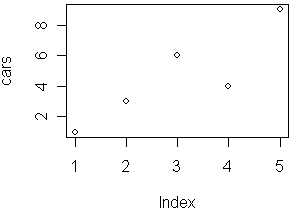
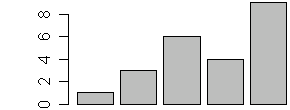
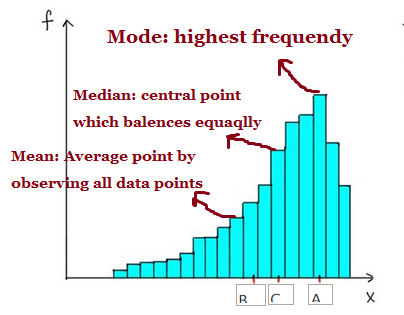
Graphs
Line Charts
Bar Charts
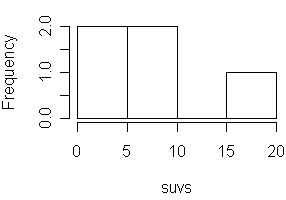
Histograms
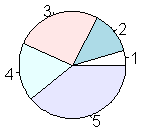
Pie Charts
Data Analysis
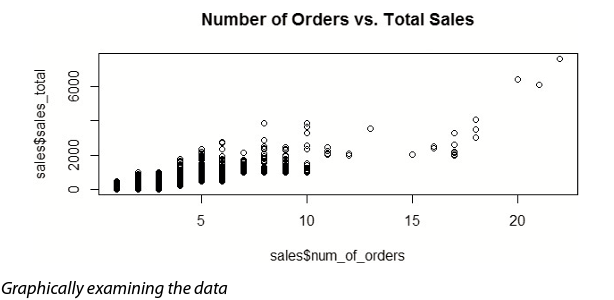
head(sales)
  cust_id sales_total num_of_orders gender
1  100001      800.64             3      F
2  100002      217.53             3      F
3  100003       74.58             2      M
4  100004      498.60             3      M
5  100005      723.11             4      F
6  100006       69.43             2      F

summary(sales)
    cust_id        sales_total      num_of_orders    gender
 Min.   :100001   Min.   :  30.02   Min.   : 1.000   F:5035
 1st Qu.:102501   1st Qu.:  80.29   1st Qu.: 2.000   M:4965
 Median :105001   Median : 151.65   Median : 2.000
 Mean   :105001   Mean   : 249.46   Mean   : 2.428
 3rd Qu.:107500   3rd Qu.: 295.50   3rd Qu.: 3.000
 Max.   :110000   Max.   :7606.09   Max.   :22.000
Shiny App (interactive Web Apps)
World Bank data Visualisation
library(wbstats)
library(data.table)
library(googleVis)
myDT <- data.table(                                 # Download World Bank data and turn into data.table
  wb(indicator = c("SP.POP.TOTL",
                   "SP.DYN.LE00.IN",
                   "SP.DYN.TFRT.IN"), mrv = 60)
)
countries <- data.table(wbcountries())              # Download country mappings
setkey(myDT, iso2c)                                 # Set keys to join the data sets
setkey(countries, iso2c)
myDT <- countries[myDT][ ! region %in% "Aggregates"]# Add regions to the data set, but remove aggregates
wDT <- reshape(                                     # Reshape data into a wide format
  myDT[, list(
  country, region, date, value, indicator)],
  v.names = "value",
  idvar=c("date", "country", "region"),
  timevar="indicator", direction = "wide")
wDT[, date := as.integer(date)]                     # Turn date, here year, from character into integer
setnames(wDT, names(wDT),
         c("Country", "Region",
         "Year", "Population",
         "Fertility", "LifeExpectancy"))
M <- gvisMotionChart(wDT, idvar = "Country",
                     timevar = "Year",
                     xvar = "LifeExpectancy",
                     yvar = "Fertility",
                     sizevar = "Population",
                     colorvar = "Region")
plot(M)                                             # Ensure Flash player is available an enabled
Our Course Curriculum
Justice challa kondaiah knowledge centre
Justice challa kondaiah knowledge centre
Internship offers the opportunity to acquire a range of
- work experience on real world data sets
- knowledge on various business domains,
- Statistical, Data mining and Visualization skills
- Interview and Resume Preparation techniques
- communication and soft skills
for big data & data science career
For College Graduates Only
***The internship is unpaid***

Data Science Demo
By sumendar karupakala
Data Science Demo
Data Science Training & Micro Internship Program


