End-To-End-ML Project
@c17hawke
- Sunny Chandra
Get the Overview
Frame the problem
- Define business objective
- Select an algorithm based on step 1
- Select a performance measure to evaluate the model
- how the current solution looks like? if its there.
Select a Performance Measure
- In the case of regression tasks-
- RMSE
- MAE
- In case of classification -
- F score
- Precision
- Recall etc
RMSE - Root mean square error
MAE - Mean absolute error
this is considered when there's many outliers present

RMSE - corresponds to Euclidean norm/distance / norm denoted as or


MAE - corresponds to Manhatten norm/distance / norm denoted as


Generally, norm of a vector v containing n elements is defined as below -

The higher the norm index,
the more it'll focus on large values and neglects the small ones.
that's why RMSE is more sensitive to outliers than MAE and performs well when outliers are rare
Get the Data
Create a workspace
Use conda environments or python virtualenvs
#### conda environments ####
# run this in your terminal or cmd
# this conda command will create an virtual isolated environment
# by name "my_env" with specified python version 3.6

conda create -n my_env python=3.6

# to activate conda env -
conda activate my_env

# to deactivate conda env -
conda deactivate

#### conda env alternative - virtualenv ####
# mkdir for project and then cd into that dir

# create an env
virtualenv my_env

# activate env -
source my_env/bin/activate # for linux or max

.\my_env\Scripts\activate # for windows

# deactivate env -
deactivate
Download the Data
It is advised to create a function to get the data if it changes frequently
Exploratory Data Analysis
Get the initial glimpse
df.head()

df.info()

df['categorical Val'].value_counts()

df.describe() # for numerical values

df["list of categorical values"].describe()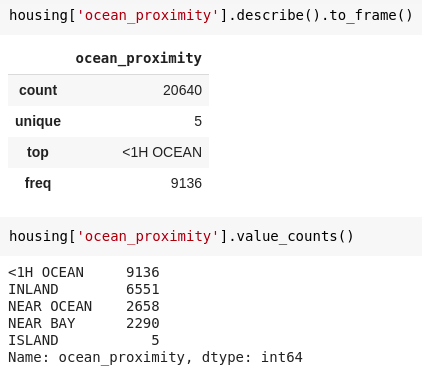
Example of categorical data description -
Create a test set
# for general large dataset
from sklearn.model_selection import train_test_split
train_set, test_set = train_test_split( df, test_size=0.2, random_state=42 )


# for small dataset and to avoid the risk of sampling bias
# here population is divided into homogeneous subgroups called "strata"
from sklearn.model_selection import StratifiedShuffleSplit

split = StratifiedShuffleSplit( n_splits=1, test_size=0.2, random_state=42 )
for train_index, test_index in split.split(df, df["featureName"]):
    strat_train_set = df.loc[train_index]
    strat_test_set = df.loc[test_index]
Visual investigation
- Dist plot
- pair plot
- joint plot
- scatter plot
- box plot
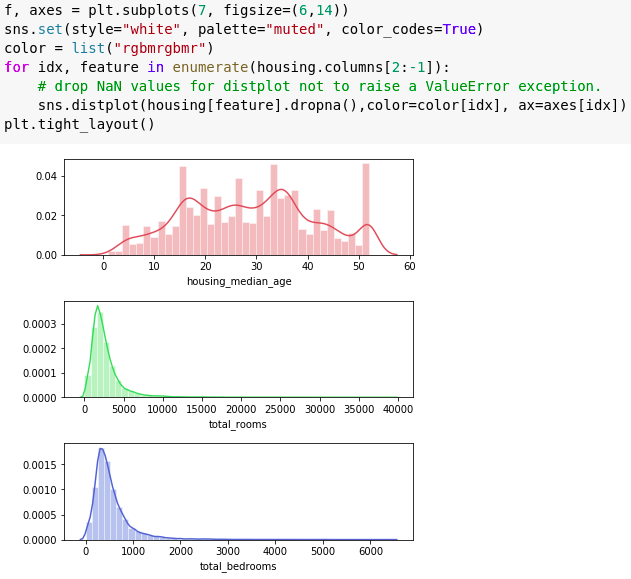
Dist plot
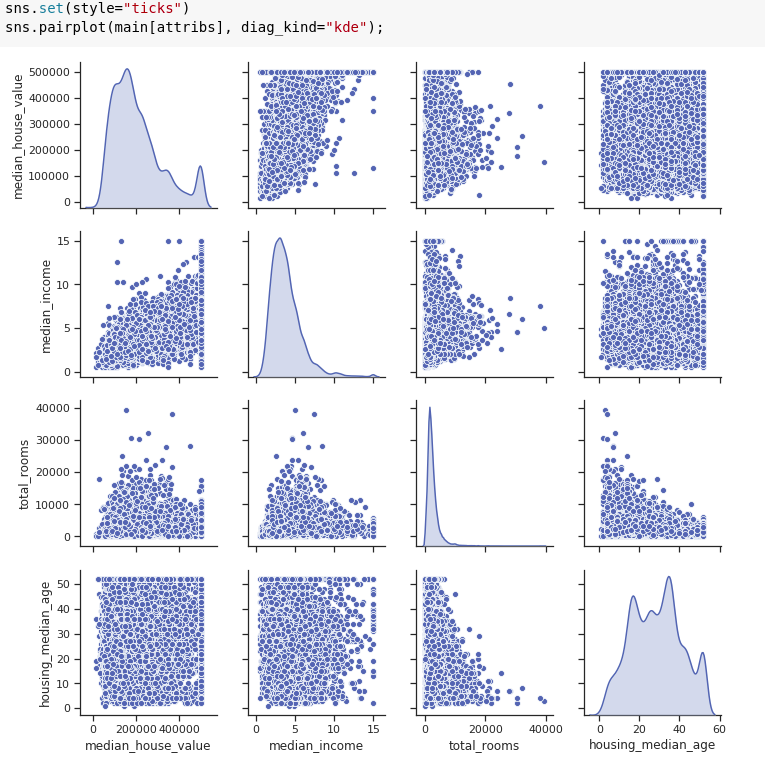
Pair plot
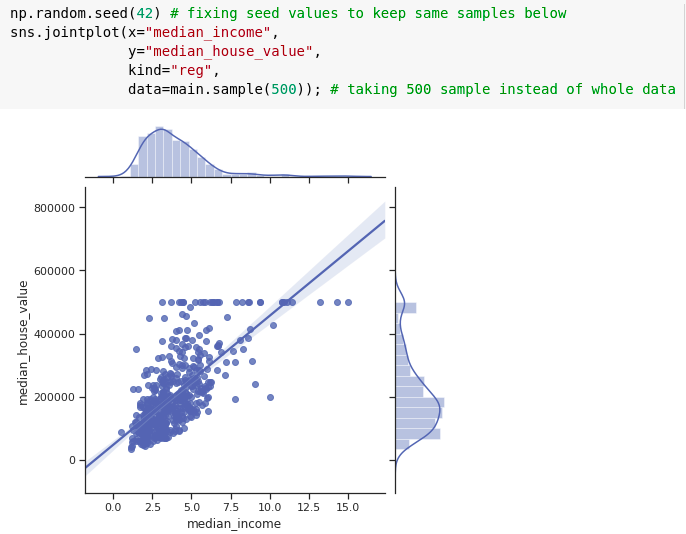
Joint plot
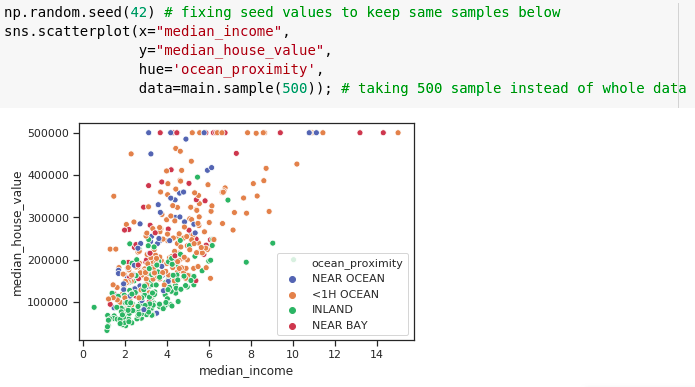
Scatter plot
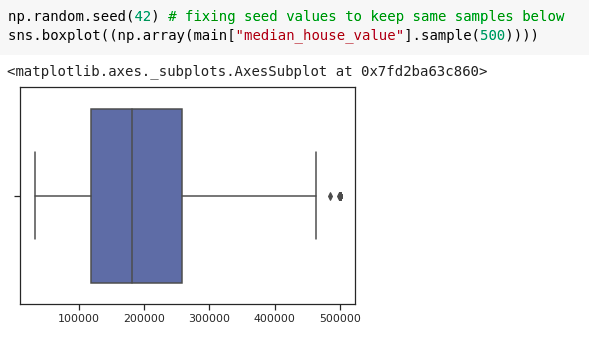
Box plot
Feature Engineering
- Try creating new features by combining two different features and check if there exists some correlation or not with the target column
Prepare data to feed in an ML algorithm
Title Text
Subtitle
Select and Train a model
Fine-tune your model
Launch, monitor and maintain
Reference
End-To-End-ML Project
By Sunny
End-To-End-ML Project
End-To-End-ML Project with reference from chap 2 of Hands on ML book by Aurelien Geron


