NWEA MAP DATA
Connecting the Art of Teaching with the Science of Data
Goal:
- Define MAP and RIT in an understandable way
- Establish which reports best suit your instructional needs
- Review how to access most important reports
- Discuss how to utilize the Class Breakdown and Learning Continuum to identify student needs and develop differentiated lesson
Empower the JTC staff to be more knowledgeable about the purpose and best uses of MAP data.
Objectives:
So, what is MAP Data?
- Student Achievement and Growth - generally and compared to peers
- Student groups for differentiation
- Student's ability to learn a skill
- Student's achievable goals
- Norm-referenced assessment
- Ranks students against statistically determined average
What does MAP Data tell me:
Enough about this RIT score...
What is it? And, what does it mean?
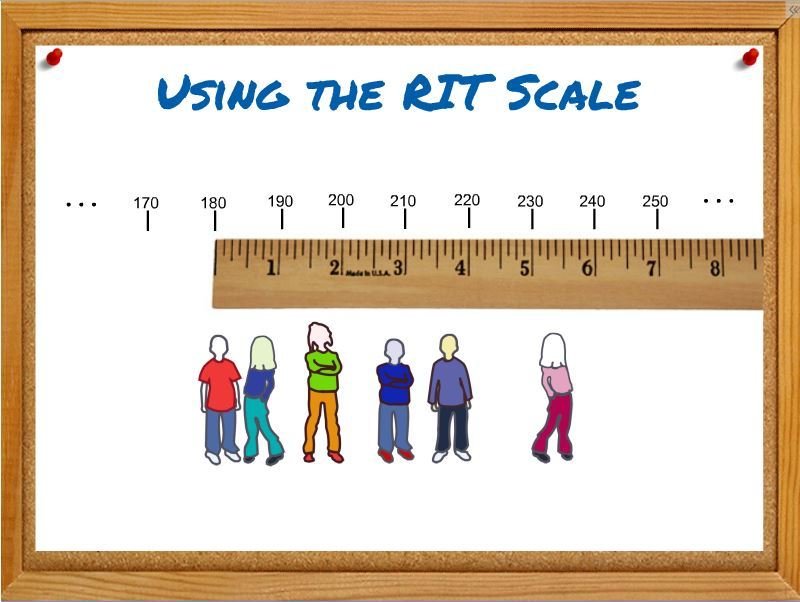
Beginning of Year MAP
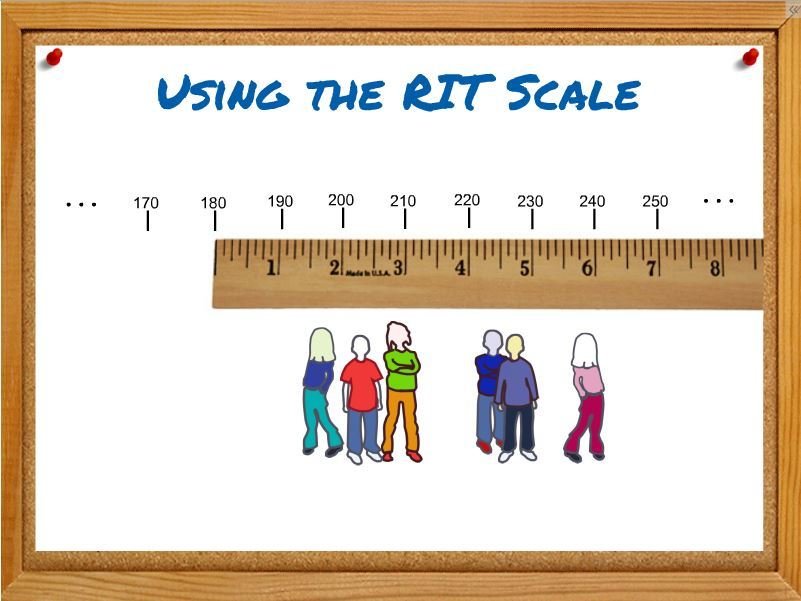
End of Year MAP
If projected growth was 20 from BOY to EOY, which student(s) met the progress expectation?
Let's Interpret a few RIT Scores
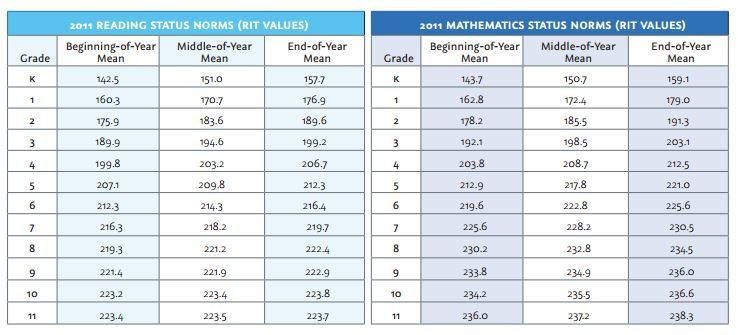
Student 1: 7th grader with a BOY Reading RIT of 222
Student 2: 6th graders with a EOY Math RIT of 206
What do you notice about elementary growth versus secondary growth???
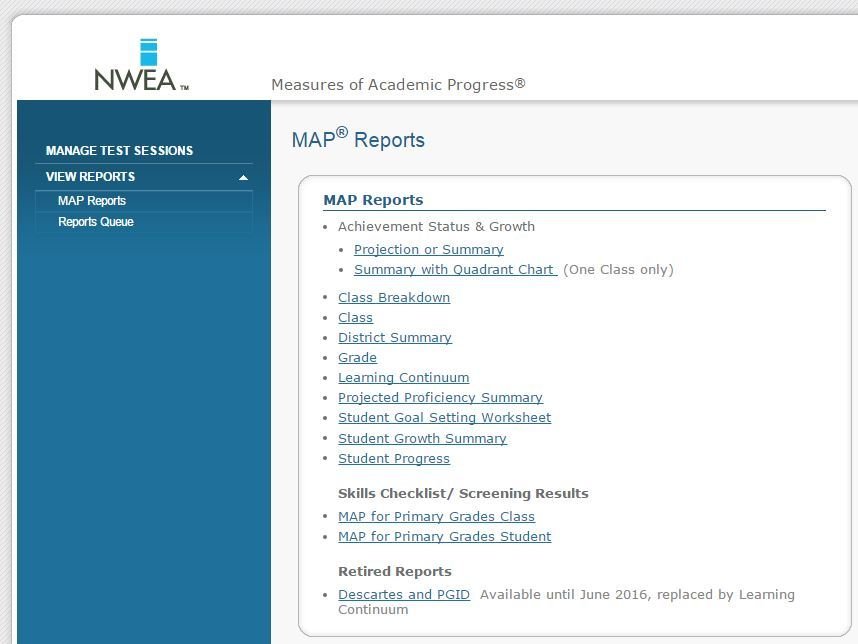
So, which reports show me exactly what I need to know?!

So, which reports show me exactly what I need to know?!
One
Two
Three
Achievement Status & Growth
Class Breakdown (by Goal)
Learning Continuum
Text
Text
1
2
3
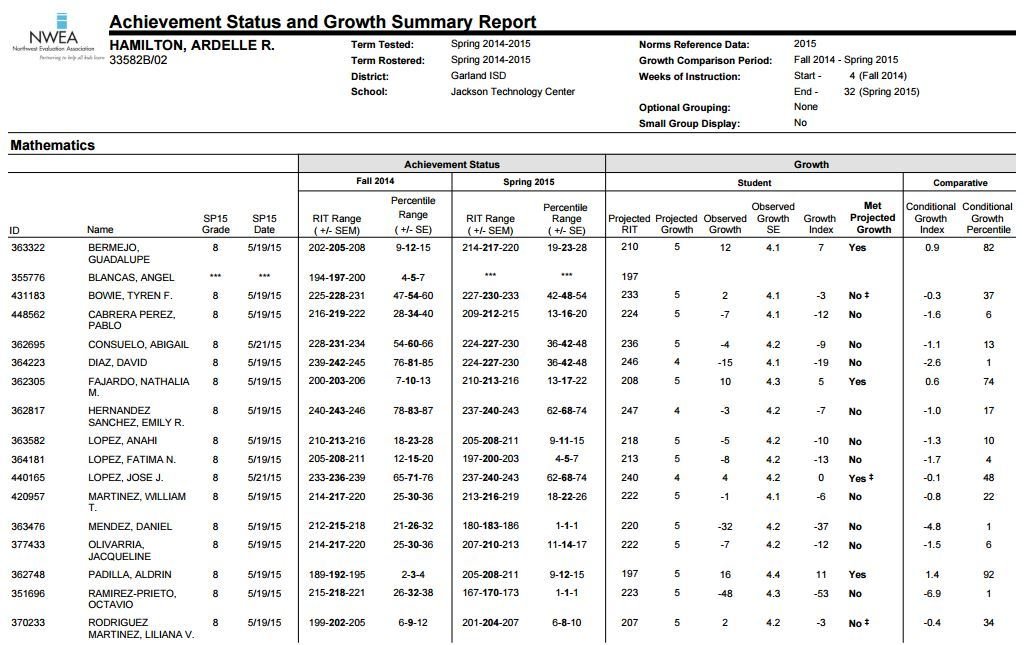
Describe Guadalupe, David, and Jose...
Class Breakdown
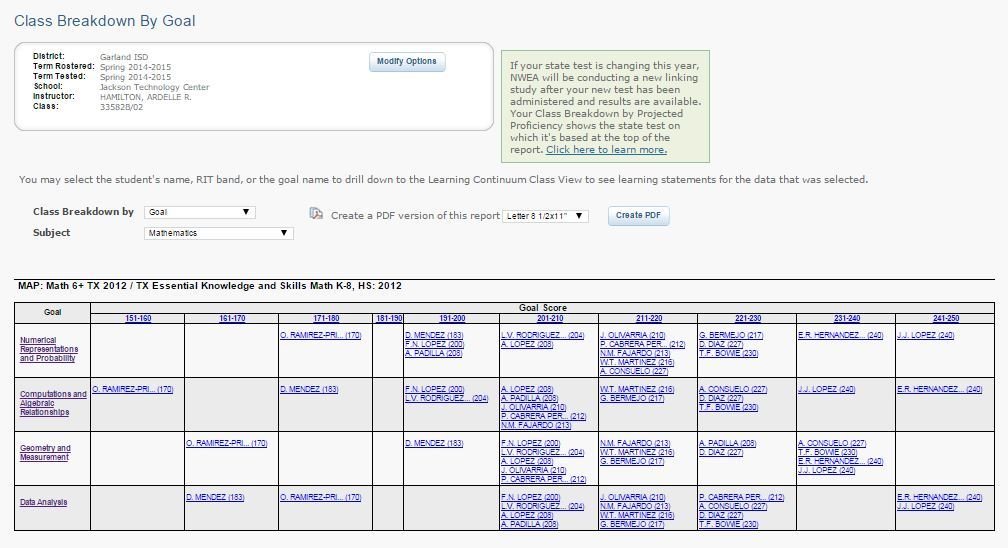
What do I know by looking at this RIT matrix?
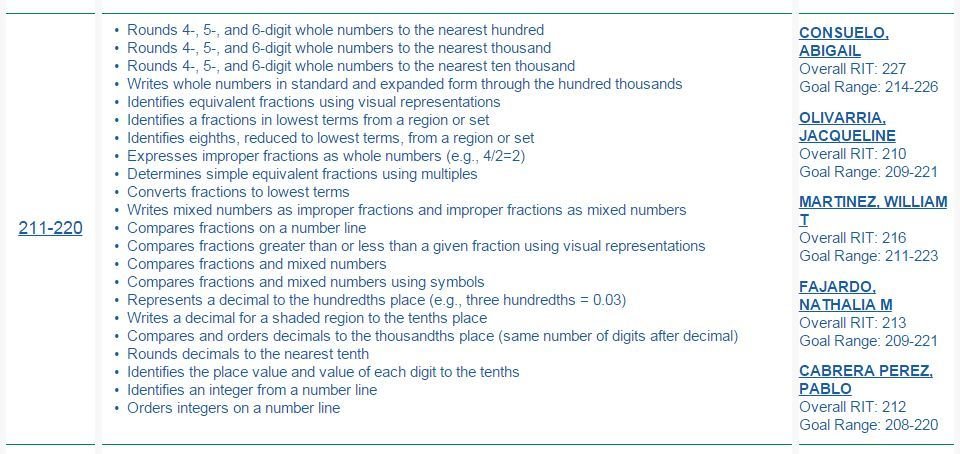
Learning Continuum
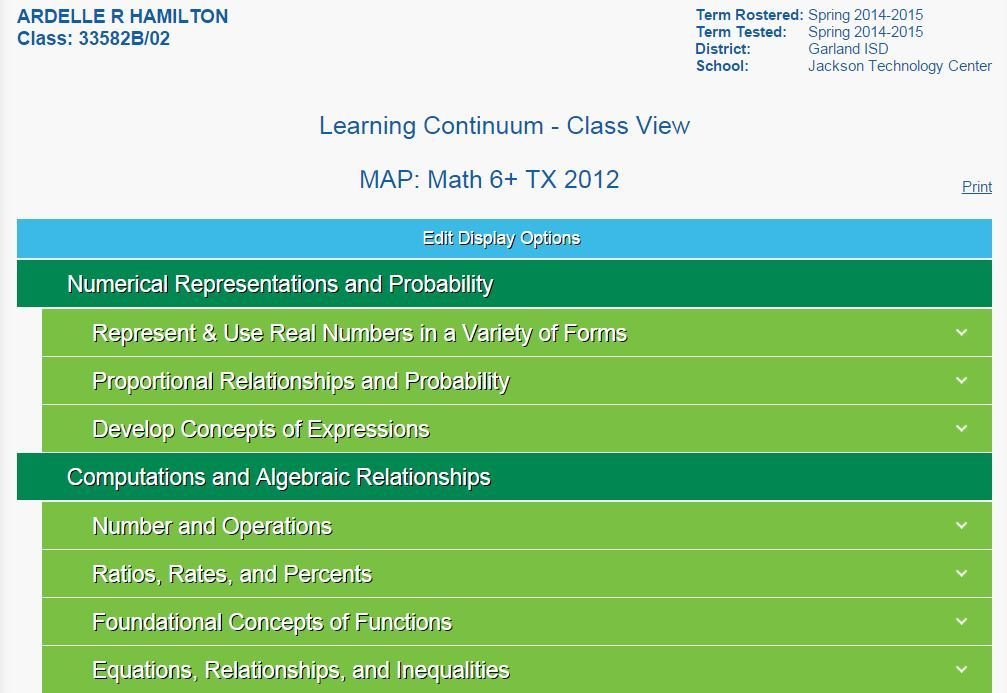
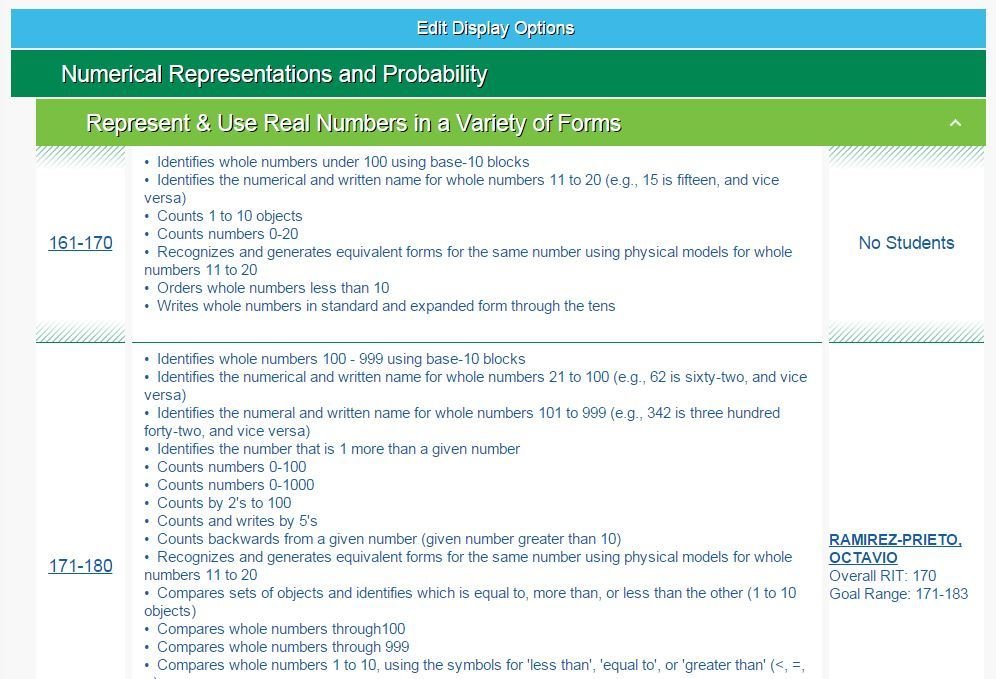
Learning Continuum
Can this student do any work with fractions?
That's going to be a... NO!
That's going to be a... NO!
How does MAP inform our practice?
{Activity}
NWEA MAP
By tdosborne