Debugging
Telerik Academy Alpha

HQC
Table of contents
-
Introduction to Debugging
-
Visual Studio Debugger
-
Breakpoints
-
Data Inspection
-
Threads and Stacks
Introduction to Debugging
Why debugging?
Debugging
The process of locating and fixing or bypassing bugs (errors) in computer program code
Steps
-
Problem + stable source state
-
Isolation of the problem
-
Write tests
- Fix the problem and commit/ check-in it in the source control
Note: One change at a time
Testing vs Debugging
Initial detection of errors
Diagnosing and correcting the root causes of errors that have already been detected
Importance of Debugging
- Perfect code is an illusion
- programmers.stackexchange.com/q/41248/163921
- There are factors that are out of our control
- Debugging can viewed as one big decision tree
- Individual nodes represent theories
- Leaf nodes represent possible root causes
- You should be able to debug code that is written years ago
- $60 Billion per year in economic losses due to software defects (in USA only)
How to avoid bugs
- Reduce the number of code lines
- Write less and write smarter. Keep it simple.
- Reduce complexity / Good code separation
- Reduce the number of possible code paths
- Unit test (TDD) with almost 100% test coverage
- Always assume your code is not working
- Prove it otherwise!
- Always check the code you write
- Experience matters / Read, learn, code
Visual Studio Debugging
Visual Studio Debugger
- Breakpoints
- Visualize the program flow
- Control the flow of execution
- Data tips
- Watch variables
- Debugging multi-threaded programs
Debug Windows
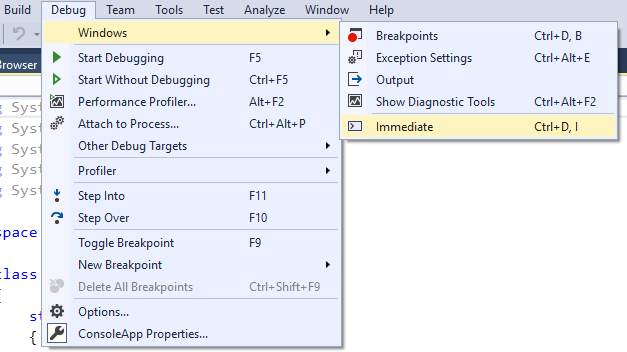
Menu
Windows
Debug Toolbar
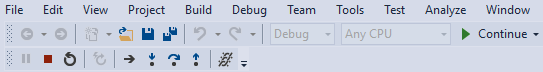
Step into (F11)
Step over (F10)
Step out (Shift + F10)
Stop debugging
Continue (F5)
Controlling Execution
- By default, an app will run uninterrupted (and stop on exception or breakpoint)
- Debugging is all about looking at the state of the process
- Controlling execution allows:
- Pausing and resuming execution
- Stepping through the application in smaller chunks
- In the case of IntelliTrace (recording steps) - backward and forward stepping
IntelliTrace
Record and trace your code's execution history
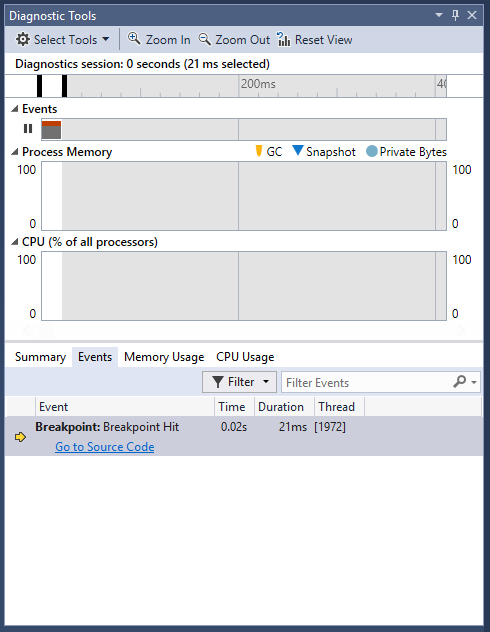
IntelliTrace
- IntelliTrace operates in the background, records what you are doing during debugging
- You can easily get a past state of your application from the IntelliTrace
- You can navigate your code to any part and see what has happened
- To navigate, just click any of the events that you want to explore
Options and Settings
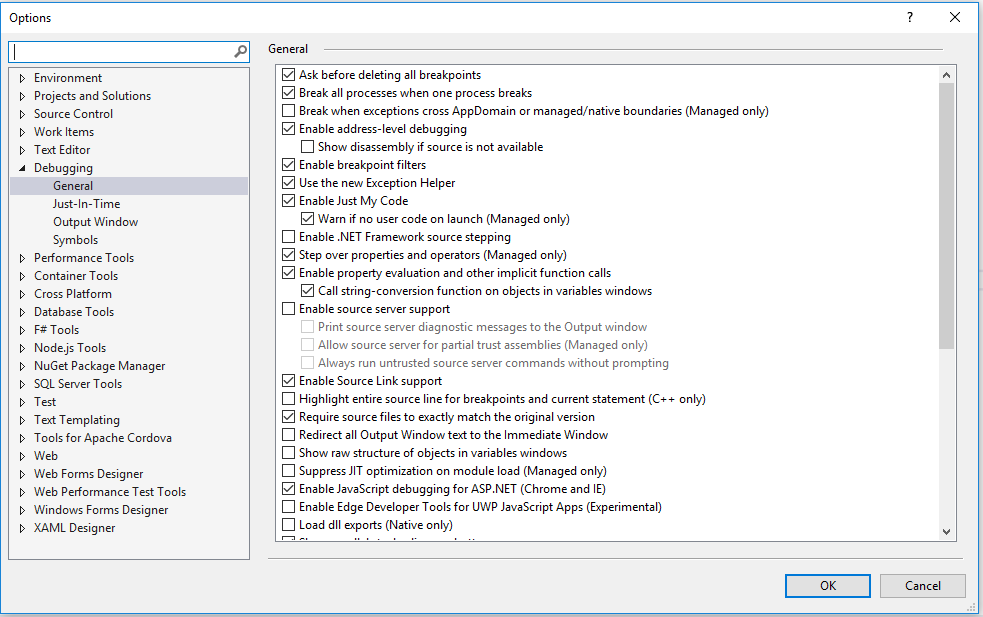
Ignore other code
Debug .Net source
Load symbols (pdb) of a dll
Breakpoints
Breakpoints
Ability to stop execution based on certain criteria is key when debugging
When data changes
When a function is hit
When a specific thread hits a function
A hit count
Condition
Filters
Visual Studio Breakpoints
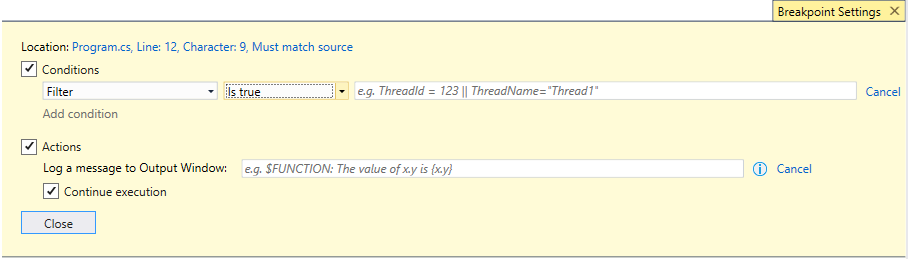
Breakpoint settings:
- Debug->Toggle breakpoint
- F9 shortcut
- Clicking on the leftmost side of the source code window
Managing Breakpoints

-
Features:
-
Add breakpoints
-
Remove or disable breakpoint
-
Label or group breakpoints
-
Export/import breakpoints
-
Data Inspection
Data Inspection
- Debugging is all about data inspection
- What are the local variables?
- What is in memory?
- What is the code flow?
- In general - What is the state of the process right now and how did it get there?
- As such, the ease of data inspection is key to quick resolution of problems
Data Inspection
- Visual Studio offers great data inspection features
- Watch windows
- Autos and Locals
- Memory and Registers
- Data Tips
- Immediate window

Watch window
- Allows you to inspect various states of your application
- Several different kinds of “predefined” watch windows
- Autos
- Locals
- “Custom” watch windows
- Contain only variables that you choose to add
- Right click on the variable and select “Add to Watch”
Autos and Locals
- Locals watch window contains the local variables for the specific stack frame
- Debug -> Windows -> Locals
- Displays: name of the variable, value and type
- Allows drill down into objects by clicking on the + sign in the tree control
- Autos lets the debugger decide which variables to show in the window
- Loosely based on the current and previous statement
Data Tips
- Provides information about variables
- Variables must be within scope of current execution
- Place mouse pointer over any variable
- Variables can be expanded by using the + sign
- Pinning the data tip causes it to always stay open
- Comments can be added to data tips
- Data tips support drag and drop
- Importing and exporting data tips
Immediate Window
- Useful when debugging due to the expansive expressions that can be executed
- To output the value of a variable
- To set values, use =
- To call a method, use .(arguments)
- Similar to regular code
- Supports Intellisense

Threads and Stacks
Threads
- Fundamental unit of code execution
- Commonly, more than one thread
- .NET, always more than one thread
- Each thread has a memory area associated with it known as a stack used to
- Store local variables
- Store frame specific information
- Memory area employs last-in-first-out semantics
Threads Window
- Contains an overview of thread activity in the process
- Includes basic information in a per thread basis
- Thread ID’s
- Category
- Name
- Location
- Priority

Callstacks
- A threads stack is commonly referred to as a callstack
- Visual Studio shows the elements of a callstack
- Local variables
- Method frames


Questions
[C# HQC] Debugging
By telerikacademy


