ME4104 Final Oral Presentation
MN26 Development of Technology Enhanced Contents for ME4262 Automation in Manufacturing
Tan Guo Xiang
A0086024L
1. Introduction
2. Literature Review
3. Analysis and Review of Tool Used
4. Implementation Details
5. Conclusion
6. Recommendation of Future Work
Contents
Introduction
Introduction
Literature Review
Analysis and Review of Tools
Implementation Details
Conclusion
Recommendation for Future Study
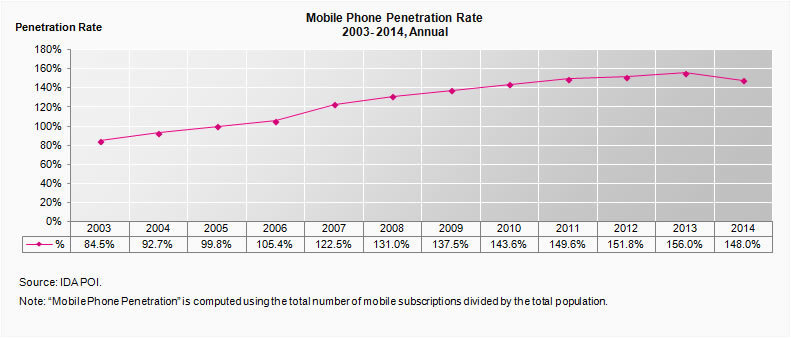
Increase Mobile Adoption Rate
Mobile Phone Penetration rate from 2003 – 2014 from Infocomm Development Authority of Singapore
Adoption of mobile devices by students to study increase in the near future.

Problem: Non-Responsive Web Content
Problem: Administrative Overhead with Polling System
Polls provide lecturers with a shorter feedback loop during teaching.
However, commercial solutions require each student to be issued with a keypad over the course of the semester.
Problem: Difficulty in Visualizing Concepts
Videos demonstrating the concept clearly are hard to find online and tend to be meant as commercial advertisement.
Image Source: ME4262 Lecture 2 Notes
Literature Review
Introduction
Literature Review
Analysis and Review of Tools
Implementation Details
Conclusion
Recommendation for Future Study
Massive Open Online Courses
- Massive Open Online Courses are courses held online and is open to anyone in the world.
- Students in under developed countries are entitled to high quality education content as their peers in more developed countries.
- Examples are Khan Academy which focuses on primary school education while Coursera focuses on University level.
Massive Open Online Courses
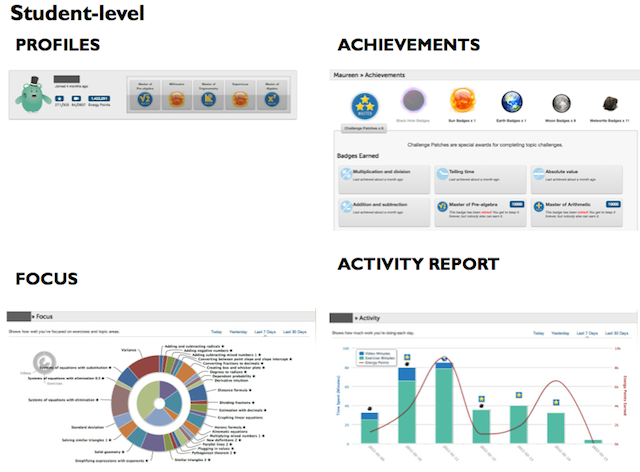
Image Source: https://www.khanacademy.org/
Massive Open Online Courses
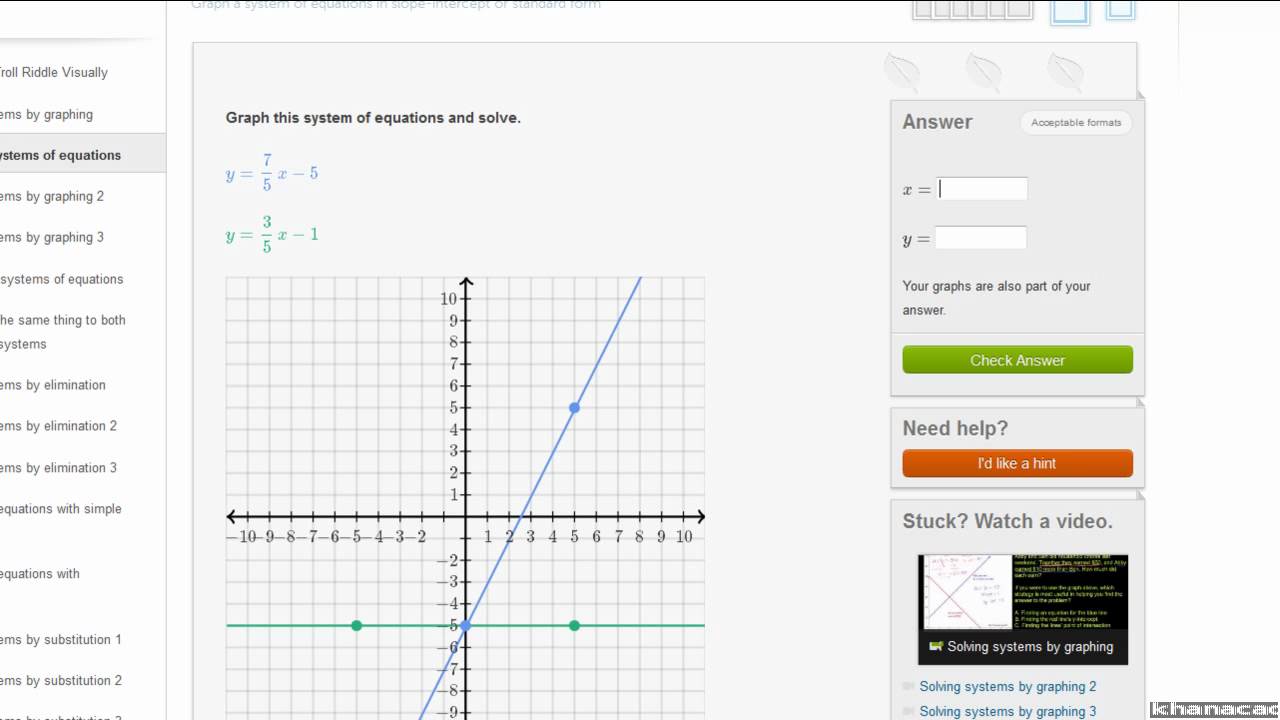
Image Source: https://www.khanacademy.org/
HTML5

- HTML is a markup language created 18 years ago which did not cater to dynamic media content.
- HTML5 was standardized in 2014 adding video and audio elements.
- HTML is currently the adopted language of the web browser to display content.
Image Source: https://w3.org/
JavaScript
- JavaScript is a dynamic computing language most commonly used in web browsers.
- Using JavaScript, developers can create dynamic content that responds to user actions.
- Allows asynchronous retrieval of data.

Image Source: http://upload.wikimedia.org/wikipedia/commons/6/6a/JavaScript-logo.png
Responsive Web Design
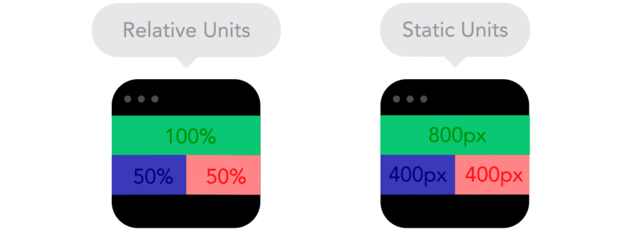
Image Source: http://blog.froont.com/9-basic-principles-of-responsive-web-design/
Responsive Web Design
Image Source: http://blog.froont.com/9-basic-principles-of-responsive-web-design/

QR Code

- First used in the Japanese automotive industry to keep track of components in the process line.
- QR codes are prominently used for marketing purposes where links to website are stored in the QR code reducing friction for users.
Analysis and Review of Tools
Introduction
Literature Review
Analysis and Review of Tools
Implementation Details
Conclusion
Recommendation for Future Study
Foundation Framework
- Foundation is a open sourced framework developed by ZURB in 2011.
- Aimed at making responsive web design easy to implement for developers.
- Provide default break points for common screen sizes.

Image Source: http://foundation.zurb.com/
Foundation Framework
Image Source: http://foundation.zurb.com/


Ruby on Rails
Image Source: http://rubyonrails.org
- Ruby on Rails is a web application development framework written in the Ruby programming language.
- Allow users to quickly create web applications without worrying about the many layers of the internet.
- Known for its simplicity and ease of use.

Ruby on Rails

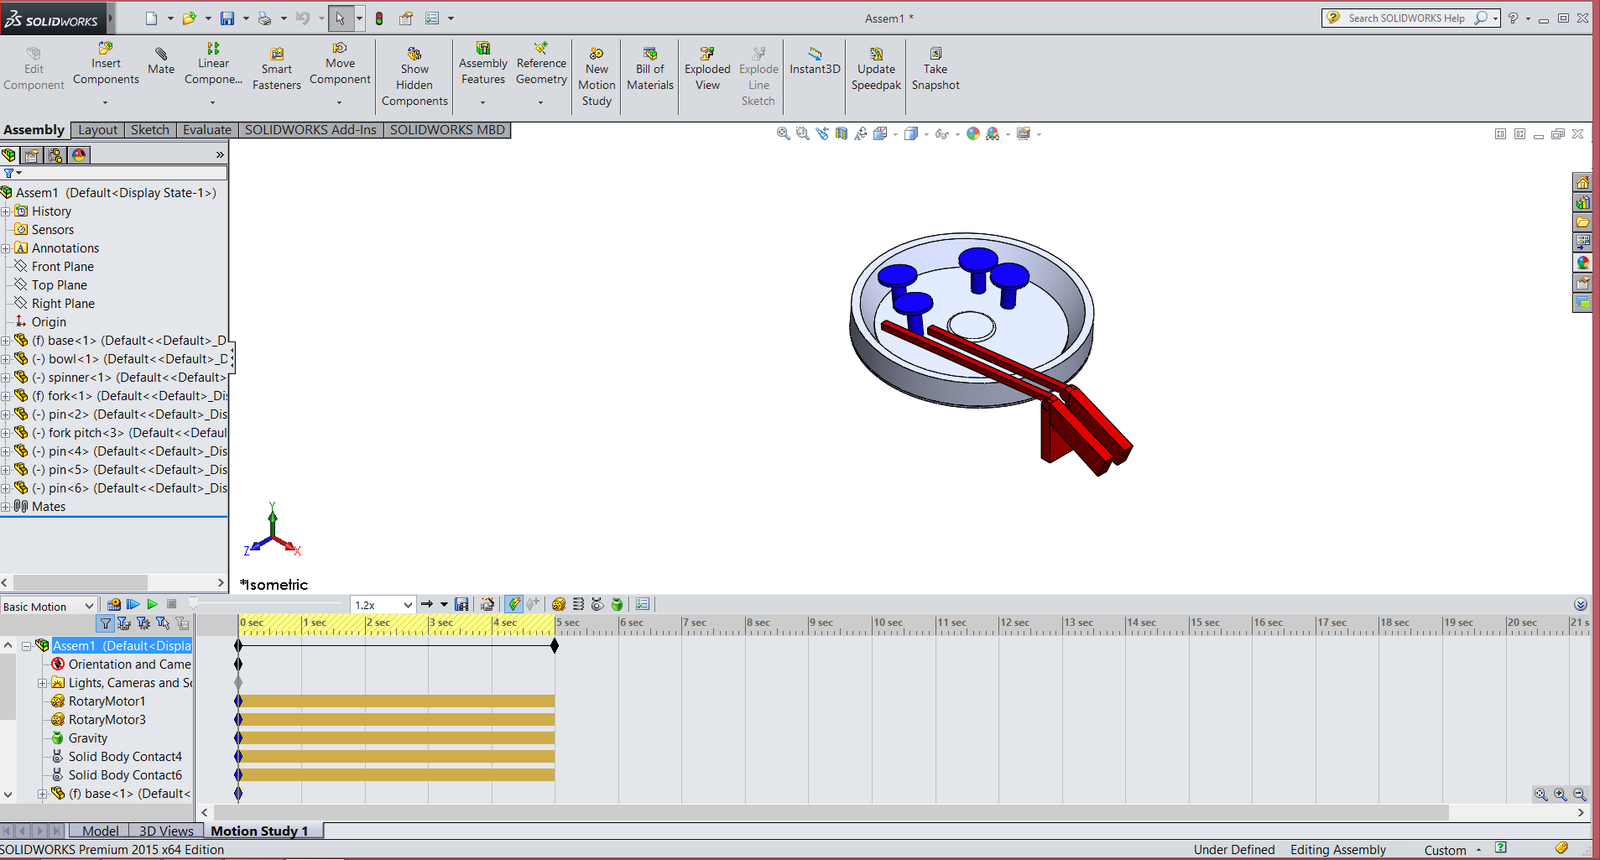
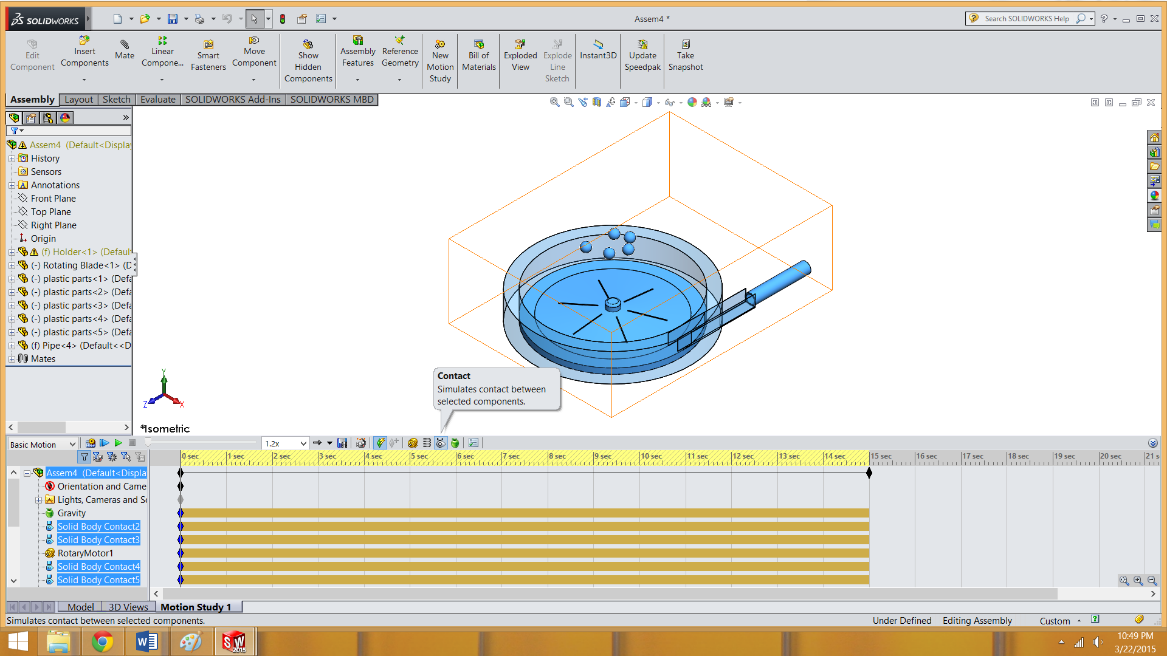
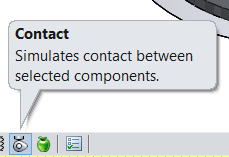
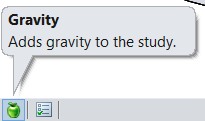
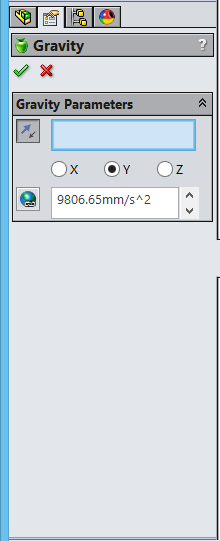
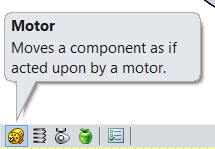
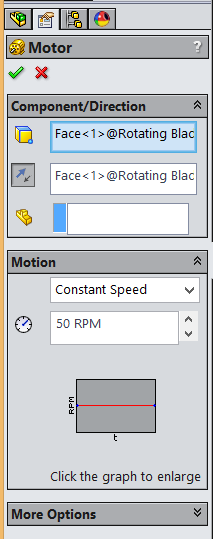
SOLIDWORKS Motion Study
- SOLIDWORKS Motion is one of the simulation tools that comes along with SOLIDWORKS.
- It allows users to run motion simulation on their design in an environment with real world parameters and limitations.
- Addition of components such as motors, gravity and contact bodies make it easy for the user to create a simulation for their visualization needs.
Implementation Details
Introduction
Literature Review
Analysis and Review of Tools
Implementation Details
Conclusion
Recommendation for Future Study
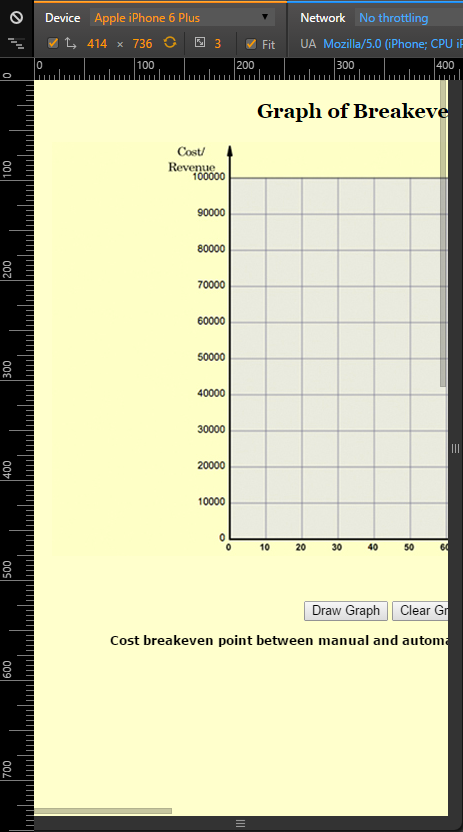
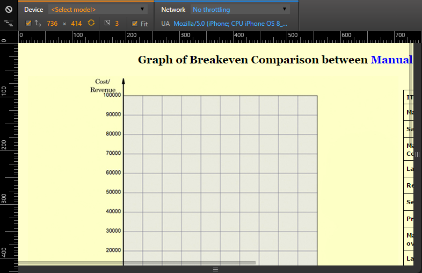
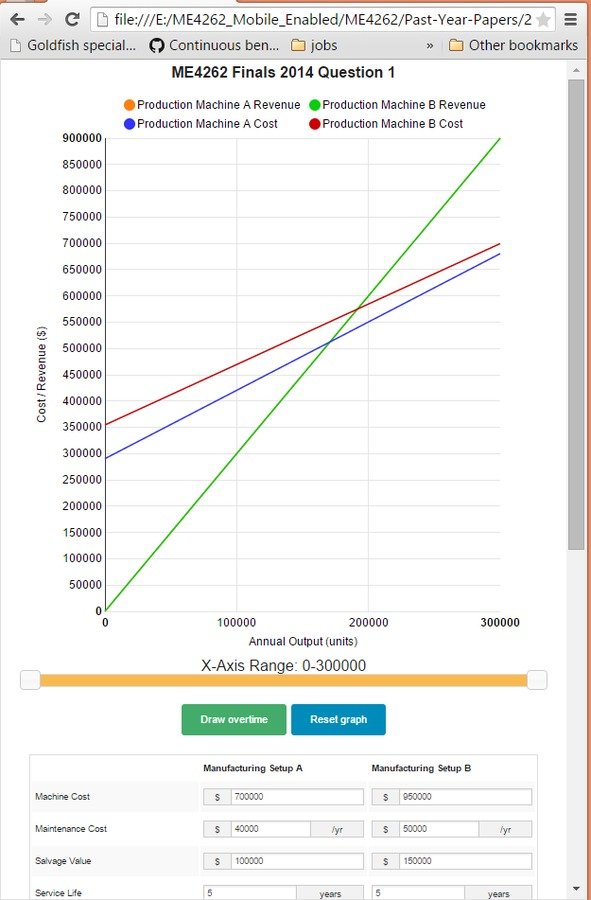
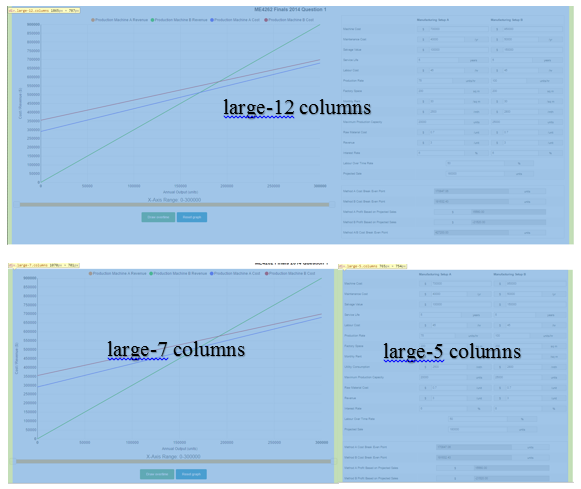
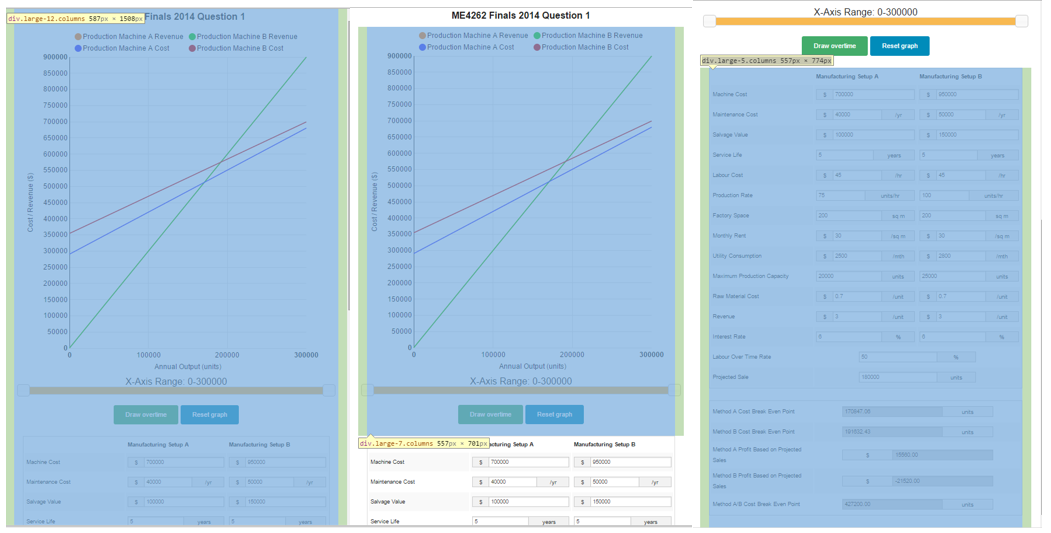
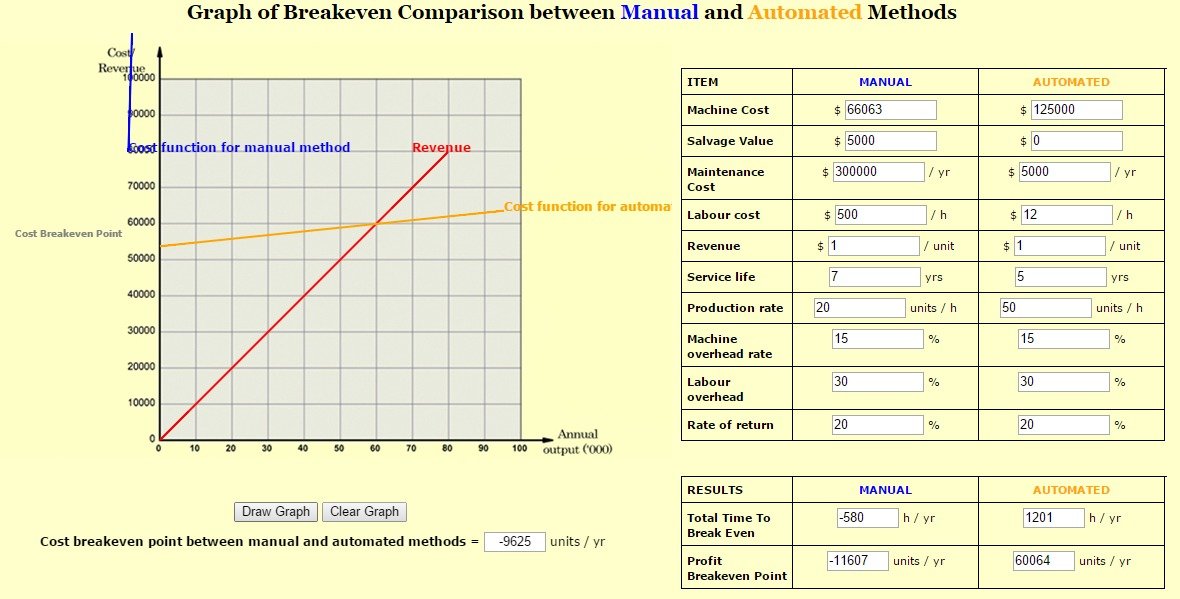
Responsive Dynamic Graphs
Responsive Dynamic Graphs
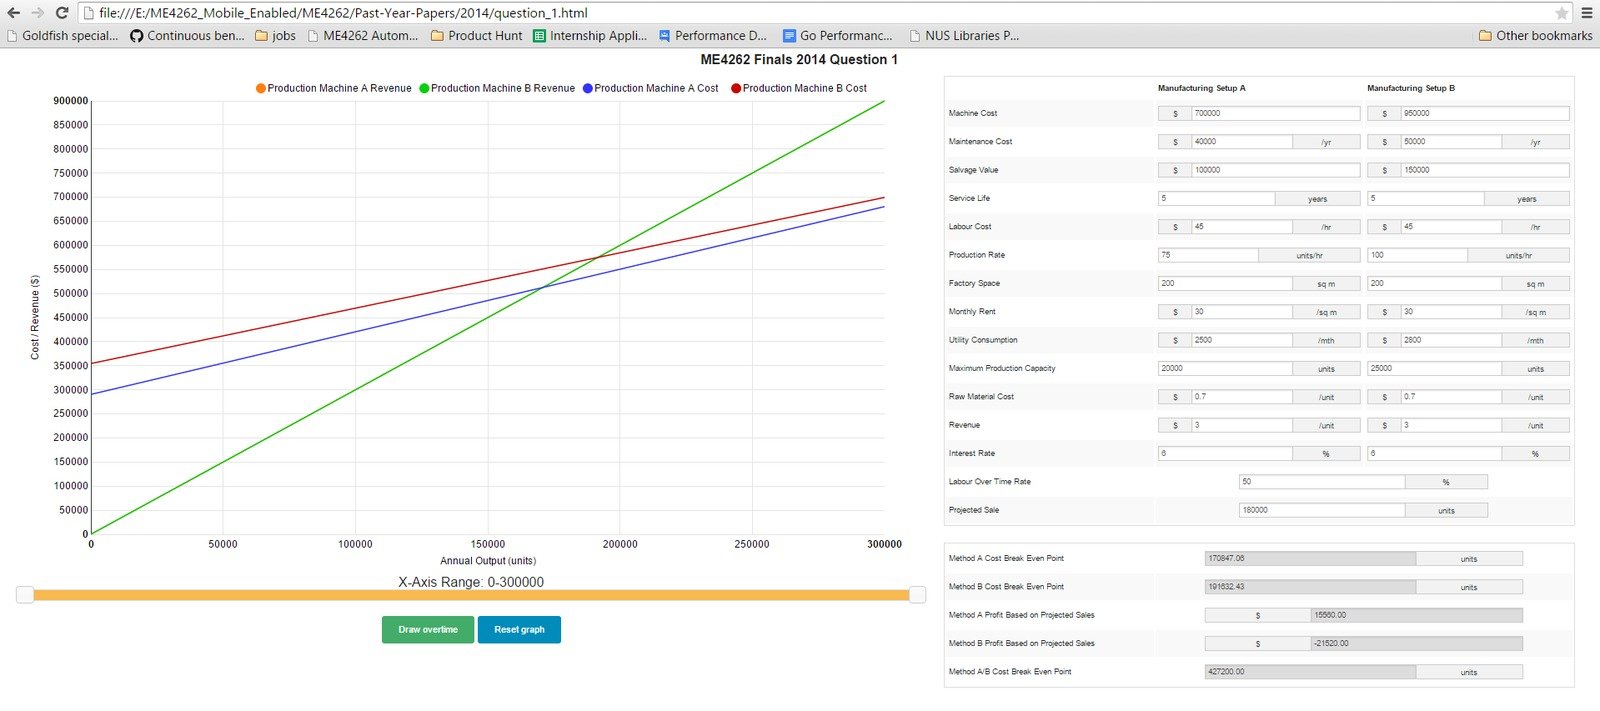
Responsive Dynamic Graphs
Implementation Details of Graphs
1. Including necessary libraries
2. Implementing the layout
3. Implementation of solutions based on the requirements of the question
4. Making graphs dynamic by responding to user input
Including necessary libraries
<script src='../../d3.min.js'></script>
<script src='../../nv.d3/nv.d3.min.js'></script>
<script src='../../jquery-2.1.1.min.js'></script>
<script src='../../foundation-5.3.0/js/foundation.min.js'></script>
<script src='../../foundation-5.3.0/js/vendor/modernizr.js'></script>
<script src='../../jquery-ui-1.11.1/jquery-ui.min.js'></script>
<script src='../../jquery.ui.touch-punch.min.js'></script>
<meta content='width=device-width, initial-scale=1.0' name='viewport'><script> Tag
<meta> Tag
Implementing the Layout
Implementing the Layout
Implementing the equations
<script>
  jQuery(function($) {
    function calculateVariableCostofLabour(labourCost, labourOverhead, productionRate) {
      return (labourCost * (100 + labourOverhead) / 100 / productionRate);
    }

    function calculateUniformAnnualCost(machineCost, maintenanceCost, salvageValue, rateOfReturn, serviceLife) {
      var capitalReturnFactor = calculateCapitalReturnFactor(rateOfReturn, serviceLife).toFixed(5);
      var sinkingFundFactor = calculatorSinkingFundFactor(rateOfReturn, serviceLife).toFixed(5);
      return ((machineCost * capitalReturnFactor) + maintenanceCost - (salvageValue * sinkingFundFactor));
    }

    function calculateUniformAnnualCostWithMachineOverhead(uniformAnnualCost, machineOverheadRate) {
      machineOverheadRate = machineOverheadRate / 100;
      return (uniformAnnualCost * (1 + machineOverheadRate));
    }

    function calculateCapitalReturnFactor(rateOfReturn, serviceLife) {
      rateOfReturn = rateOfReturn * 0.01;
      return ((rateOfReturn * Math.pow((rateOfReturn + 1), serviceLife)) / (Math.pow((rateOfReturn + 1), serviceLife) - 1));
    }

    function calculateLabourCostPerUnit(labourRate, productionRate) {
      return (labourRate / productionRate);
    }

    function calculateVariableCost(labourCost, materialCost) {
      return (labourCost + materialCost);
    }

    function calculateVariableCostOvertime(labourCost, materialCost, labourOvertimeRate) {
      return ((labourCost * (1 + (labourOvertimeRate / 100))) + materialCost);
    }

    function calculateElecricityRate(electricityConsumption, powerConsumption, productionRate) {
      return (electricityConsumption * powerConsumption / productionRate);
    }

    function calculateOvertimeCost(cost, variableCostWithOverhead, variableCostOvertimeWithOverhead, productionRate, projectedSales, maximumProductionCapcity) {
      var currentSales = productionRate * 8 * 5 * 50;
      var salesDifference = projectedSales - currentSales;
      projectedSales = (projectedSales >= maximumProductionCapcity) ? maximumProductionCapcity : projectedSales;

      if (!drawOvertime || salesDifference < 0) {
        var variableCost = variableCostWithOverhead * projectedSales
      } else {
        var variableCost = (variableCostWithOverhead * currentSales) + (variableCostOvertimeWithOverhead * salesDifference);
      }

      return variableCost + cost;
    }

    function calculateRentPerAnnum(monthlyRent, factorySpace) {
      return (monthlyRent * 12 * factorySpace);
    }

    function calculatorSinkingFundFactor(rateOfReturn, serviceLife) {
      rateOfReturn = rateOfReturn * 0.01;
      return (rateOfReturn/(Math.pow((1 + rateOfReturn), serviceLife) - 1));
    }

    function calculateRevenue(revenue, numberOfUnits) {
      return (revenue * numberOfUnits);
    }

    function calculateCost(cost, variableCost, number_of_units) {
      return Number((cost + (variableCost * number_of_units)).toFixed(2));
    }

    function roundUp(x){
      var y = Math.pow(10, parseInt(x).toString().length - 1);
      x = (x / y);
      x = Math.ceil(x);
      x = x * y;
      return x;
    }
Drawing the Graphs
var lowerBound = 0;
var upperBound = 0;
var upperBoundMax = 0;
var slider;
var $slider = $('#range-slider');
var drawOvertime = false;

var ProfitBreakEvenGraph = {
  _init: function() {
    var widget = this;

    nv.addGraph(function() {
      var chart = nv.models.lineChart()
        .margin({left: 80, right: 40})  //Adjust chart margins to give the x-axis some breathing room.
        .useInteractiveGuideline(false)
        .showLegend(true)       //Show the legend, allowing users to turn on/off line series.
        .showYAxis(true)        //Show the y-axis
        .showXAxis(true)        //Show the x-axis
      ;

      chart.xAxis     //Chart x-axis settings
        .axisLabel("Annual Output (units)")

      chart.yAxis     //Chart y-axis settings
        .axisLabel('Cost / Revenue ($)')

      /* Done setting the chart up? Time to render it!*/
      var myData = widget._generateLineData(false);

      d3.select('#chart svg')    //Select the <svg> element you want to render the chart in.
        .datum(myData)         //Populate the <svg> element with chart data...
        .call(chart);          //Finally, render the chart!

      //Update the chart when window resizes.
      nv.utils.windowResize(function() { chart.update() });

      d3.select('.draw-overtime').on('click', function() {
        drawOvertime = !drawOvertime;

        if (drawOvertime) {
          d3.select(this).text('Remove Overtime');
          d3.select(this).attr('class', 'alert button radius tiny draw-overtime');
          d3.select('.a-profit-header').text('Method A Profit Based on Projected Sales With Overtime');
          d3.select('.b-profit-header').text('Method B Profit Based on Projected Sales With Overtime');
        } else {
          d3.select(this).text('Draw Overtime');
          d3.select(this).attr('class', 'success button radius tiny draw-overtime');
          d3.select('.a-profit-header').text('Method A Profit Based on Projected Sales');
          d3.select('.b-profit-header').text('Method B Profit Based on Projected Sales');
        }

        widget._updateChart(chart, false)
      });

      d3.selectAll('input').each(function() {
        d3.select(this).on('input', function() {
          widget._updateChart(chart, false);
          $rangeInputValue.text(lowerBound + '-' + upperBound);
        })
      });

      $rangeInputValue = $('#range-input-value');

      slider = $slider.slider({
        range: true,
        min: lowerBound,
        max: upperBoundMax,
        values: [lowerBound, upperBound],
        slide: function(event, ui) {
          lowerBound = ui.values[0];
          upperBound = ui.values[1];

          widget._updateChart(chart, true);

          $rangeInputValue.text(lowerBound + '-' + upperBound);
        }
      });
      $rangeInputValue.text(lowerBound + '-' + upperBound);

      return chart;
    });
  },

  _updateChart: function(chart, isSlider) {
    var myData = this._generateLineData(isSlider);

    d3.select('#chart svg')
      .datum(myData)
      .call(chart)
  },
Making Graphs Dynamic
Making Graphs Dynamic
Making Graphs Dynamic
d3.selectAll('input').each(function() {
d3.select(this).on('input', function() {
widget._updateChart(chart, false);
$rangeInputValue.text(lowerBound + '-' + upperBound);
})
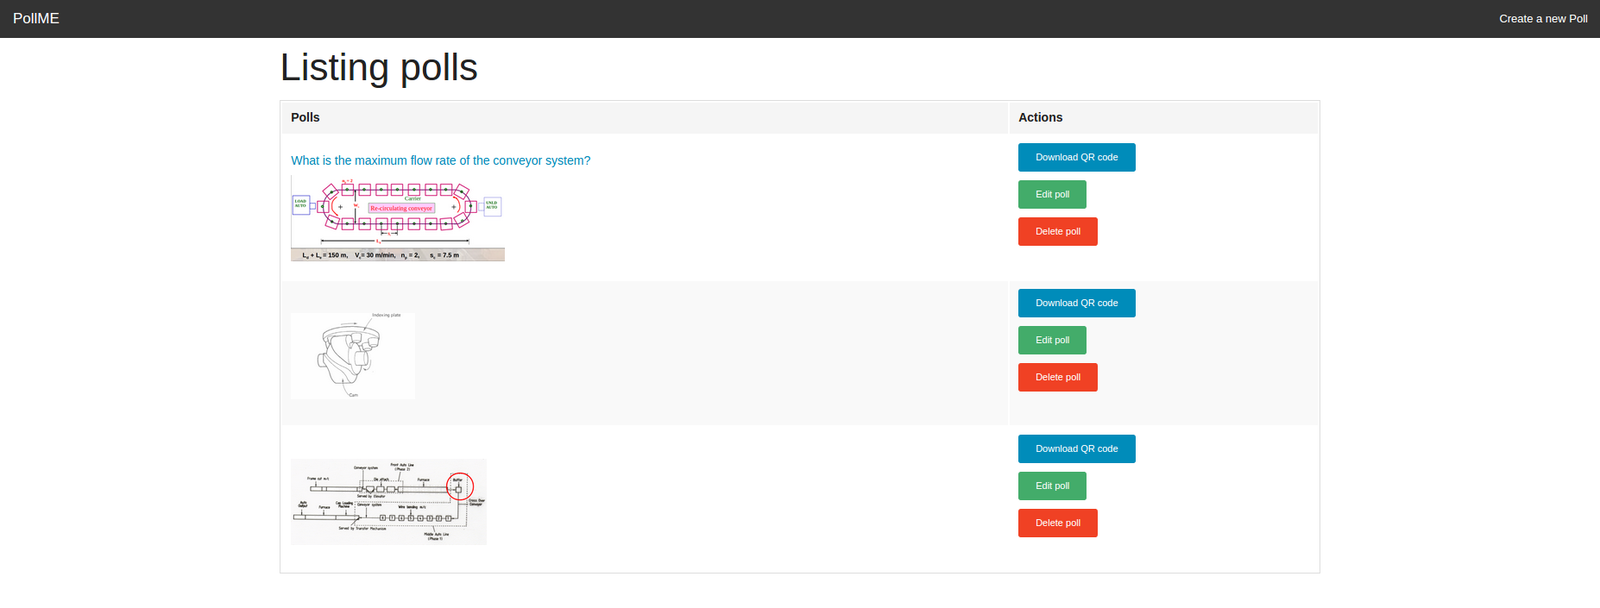
});POLLMe - On Demand Web Based Polling Application
Demo
POLLMe - On Demand Web Based Polling Application

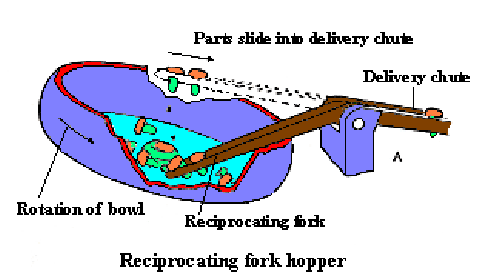
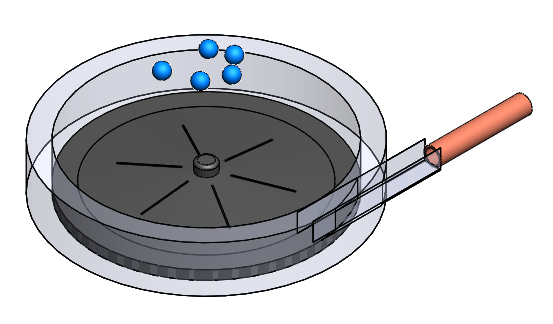
Animation for Manufacturing Processes
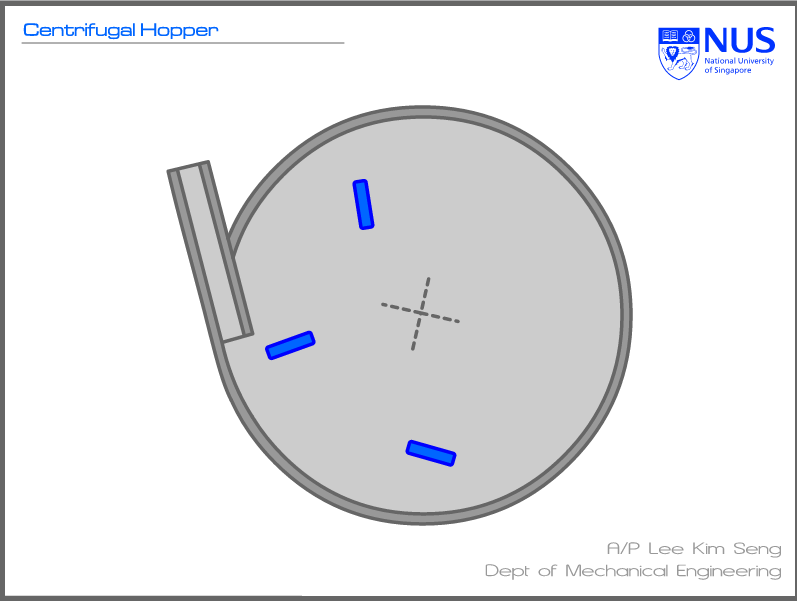
Animation for Manufacturing Processes
Animation for Manufacturing Processes
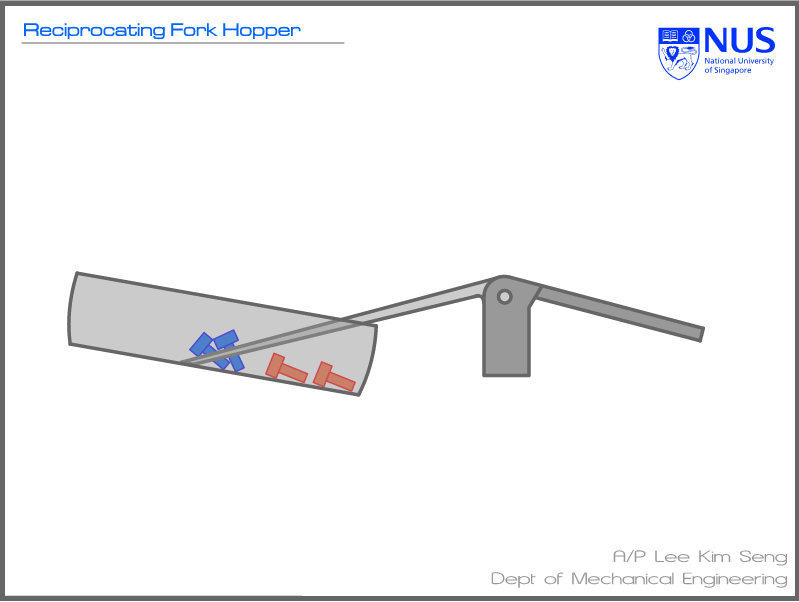
Animation for Manufacturing Processes
Implementation Details
Implementation Details
Implementation Details
Implementation Details
Implementation Details
Conclusion
Introduction
Literature Review
Analysis and Review of Tools
Implementation Details
Conclusion
Recommendation for Future Study
- Technology enabled learning comes with many benefits that can help students learn better and it is crucial that educators continue to seek out new opportunities.
- Responsive and Dynamic Break Even Graphs.
- POLLMe - On demand polling web application for lectureres.
- Better visualization with 3D animations.
Conclusion
Recommendation for Future Study
Introduction
Literature Review
Analysis and Review of Tools
Implementation Details
Conclusion
Recommendation for Future Study
- Test out the new content and obtain feedback from students to see if they have benefited from the new content.
- POLLMe can applied to many modules. It would be good that other users can pioneer it and provide feedback based on the usage. The application can then be developed further.
Recommendation for Further Work
Thank You!
Questions?
FYP Final Presentation
By tgxworld


