


Theo Kliaris
will code for food
Tempo / Grafana
NewRelic
Micrometer
OpenTelemetry
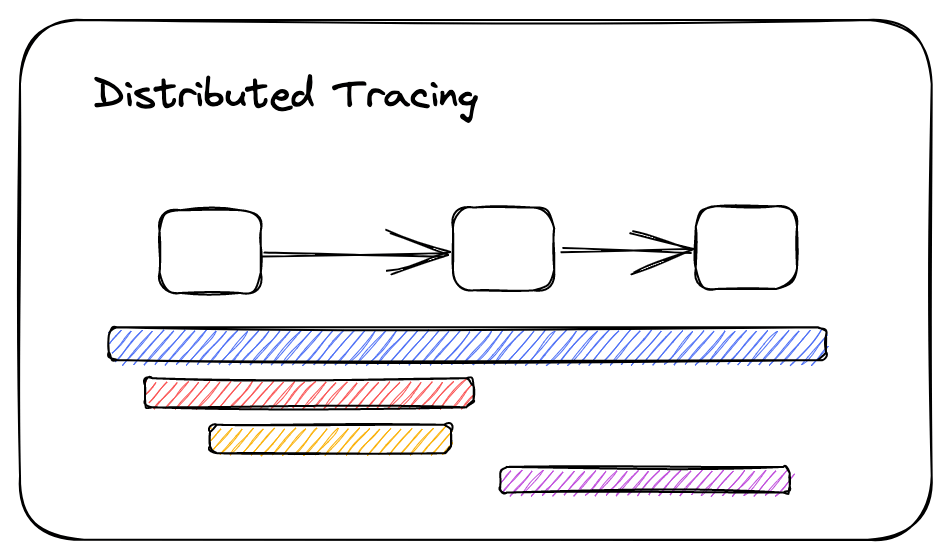
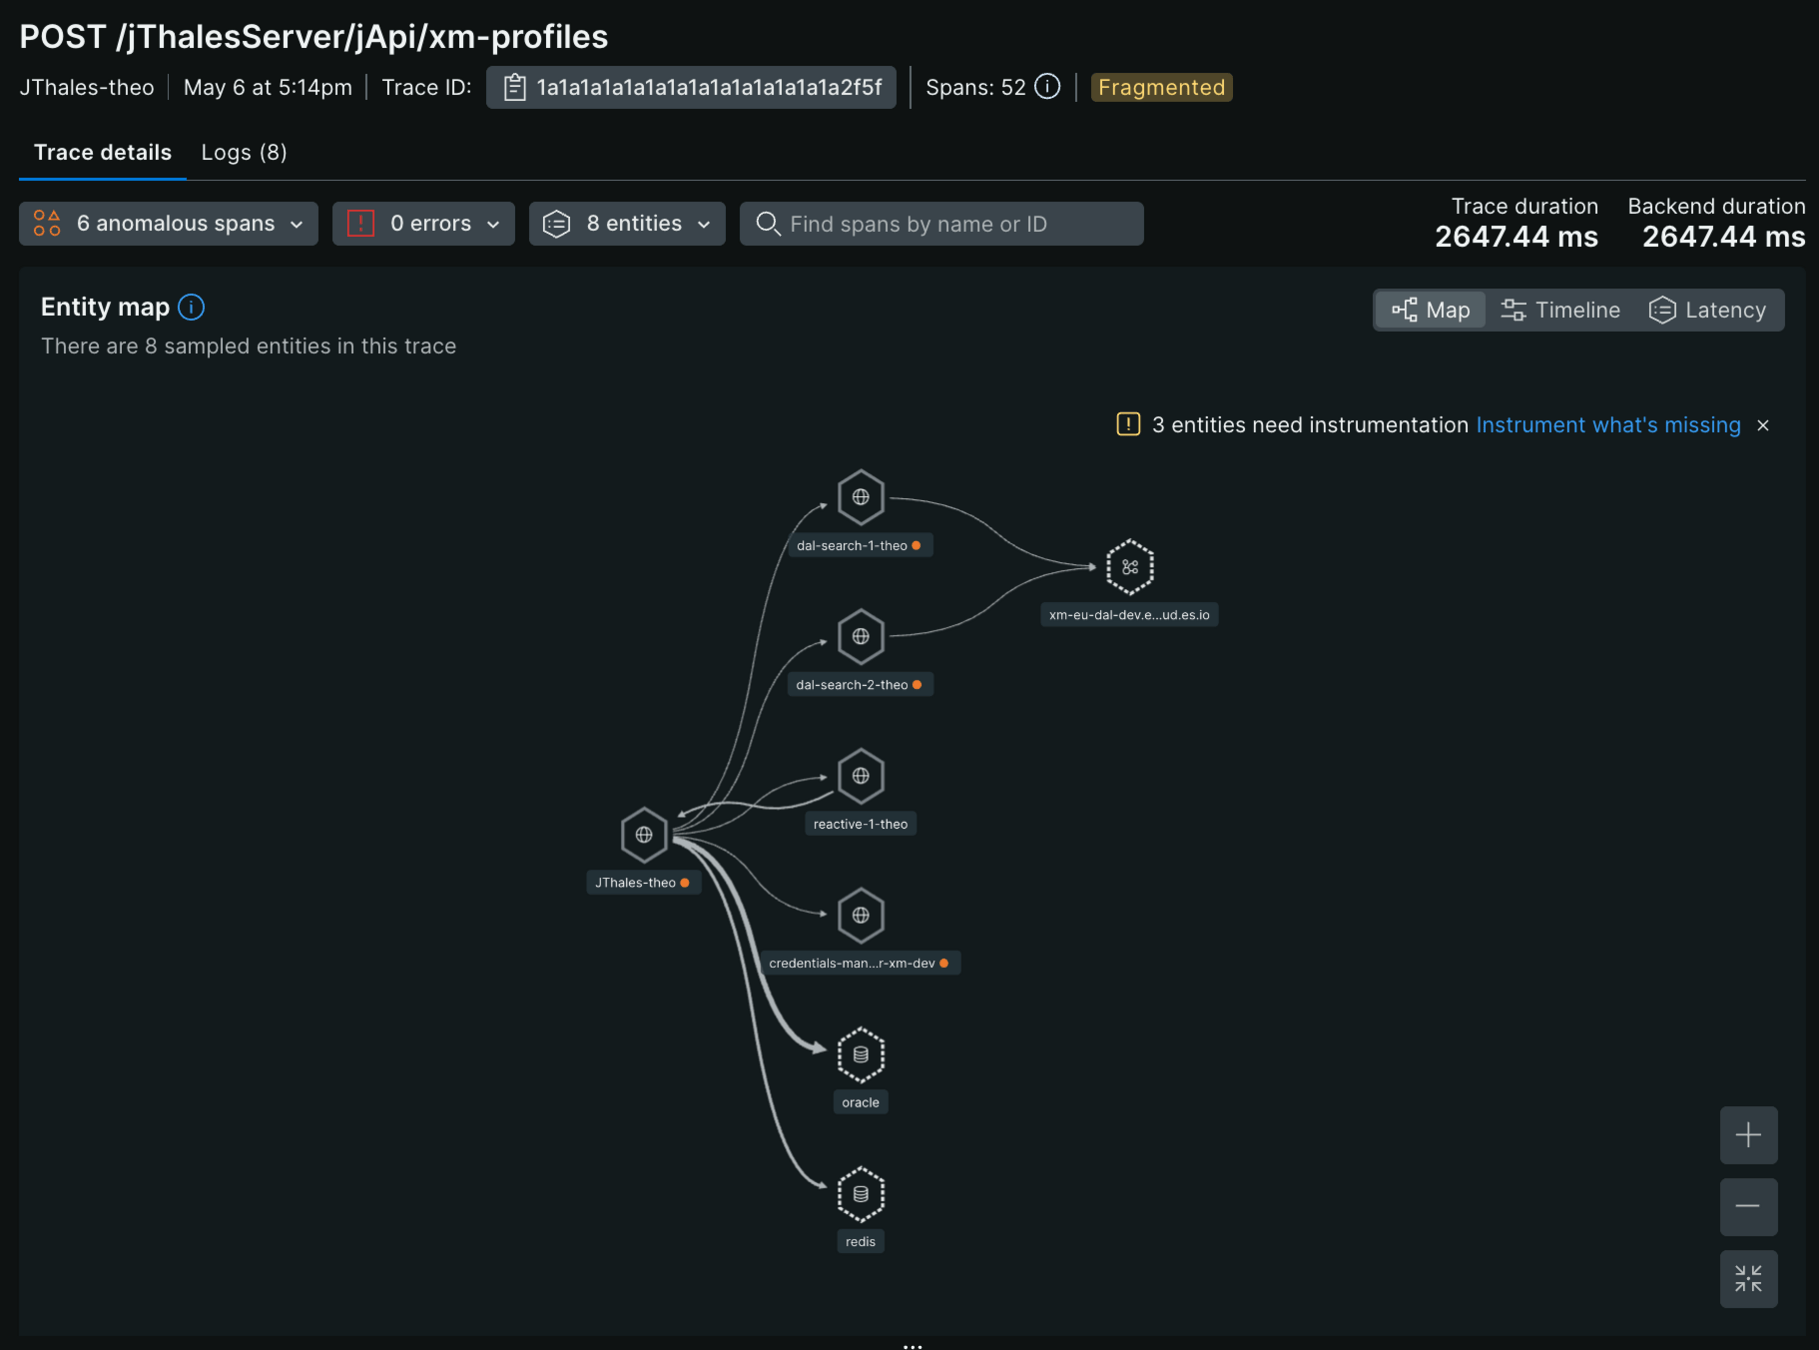
➝ A method to monitor and track requests as they flow through a distributed system.
➝ Provides visibility into the lifecycle of a request by capturing trace data at each service or component.
➝ Helps uncover performance issues, service dependencies, and bottlenecks.
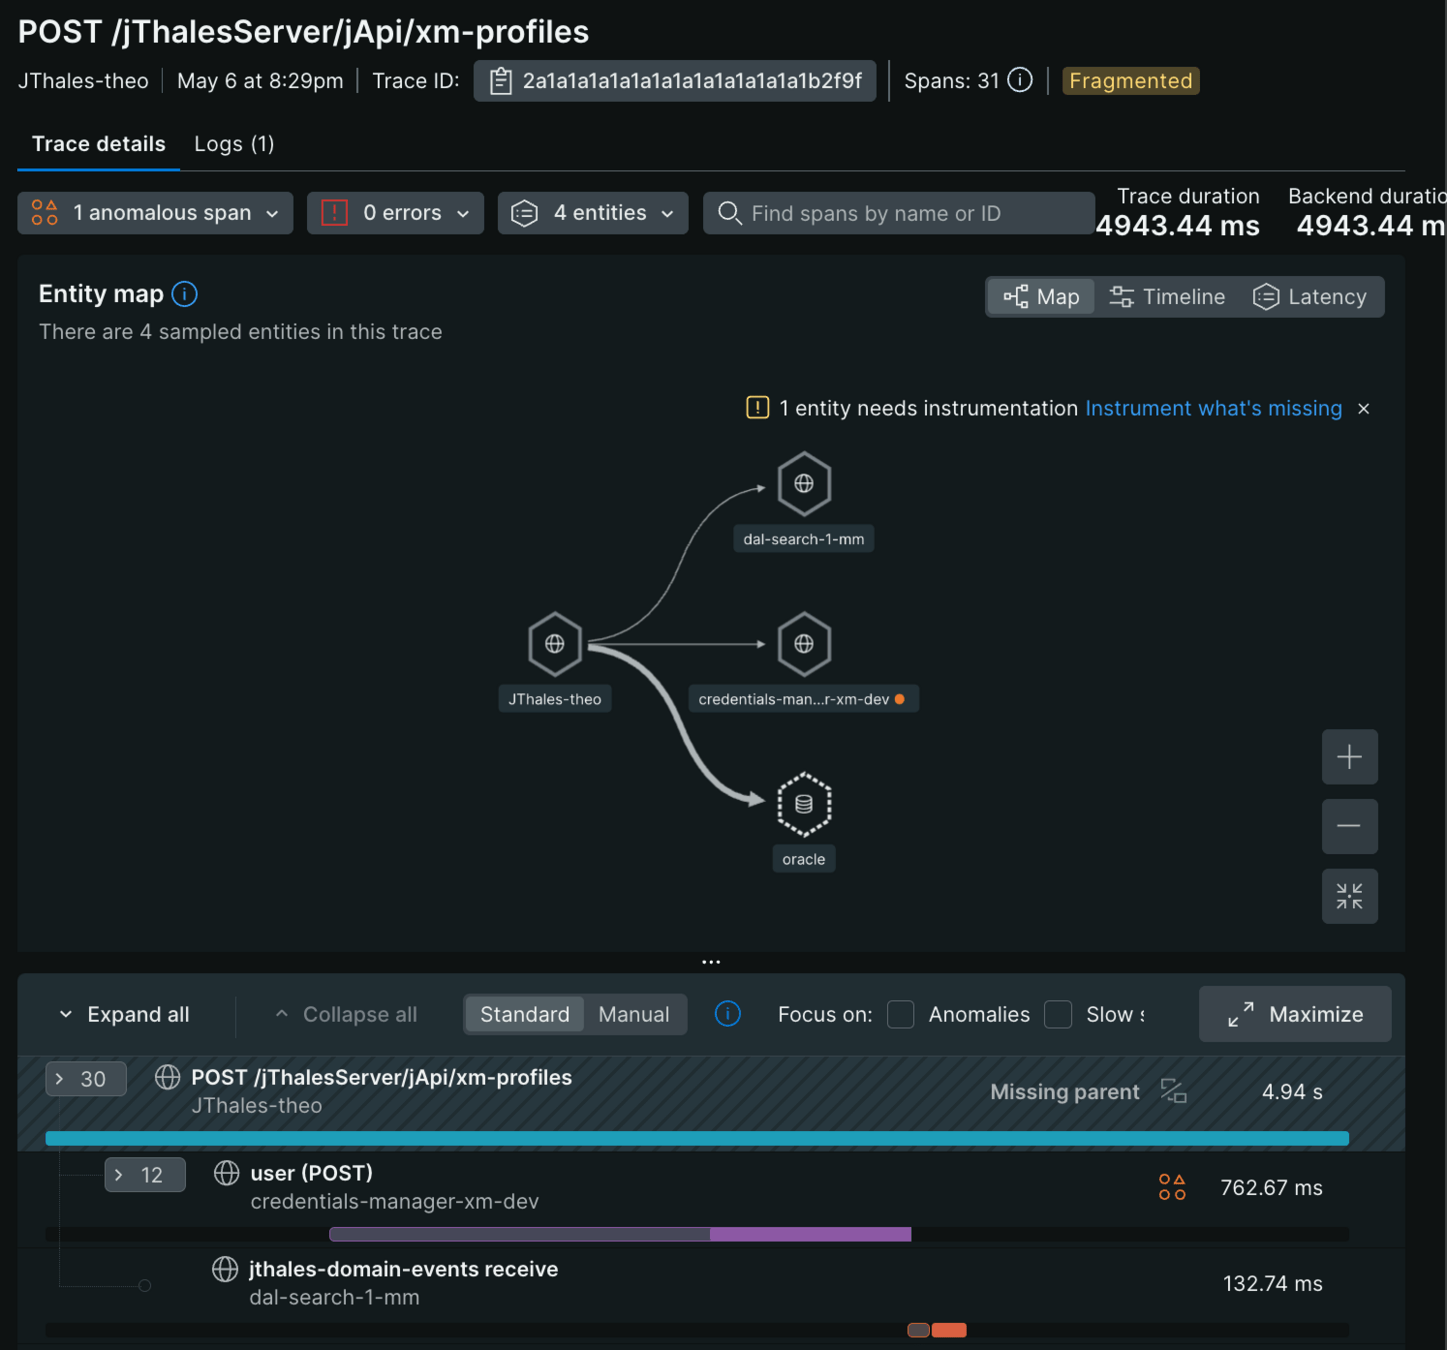
A trace is a collection of spans representing the complete journey of a request through a system.
➝ Trace: The end-to-end view of a request across all components.
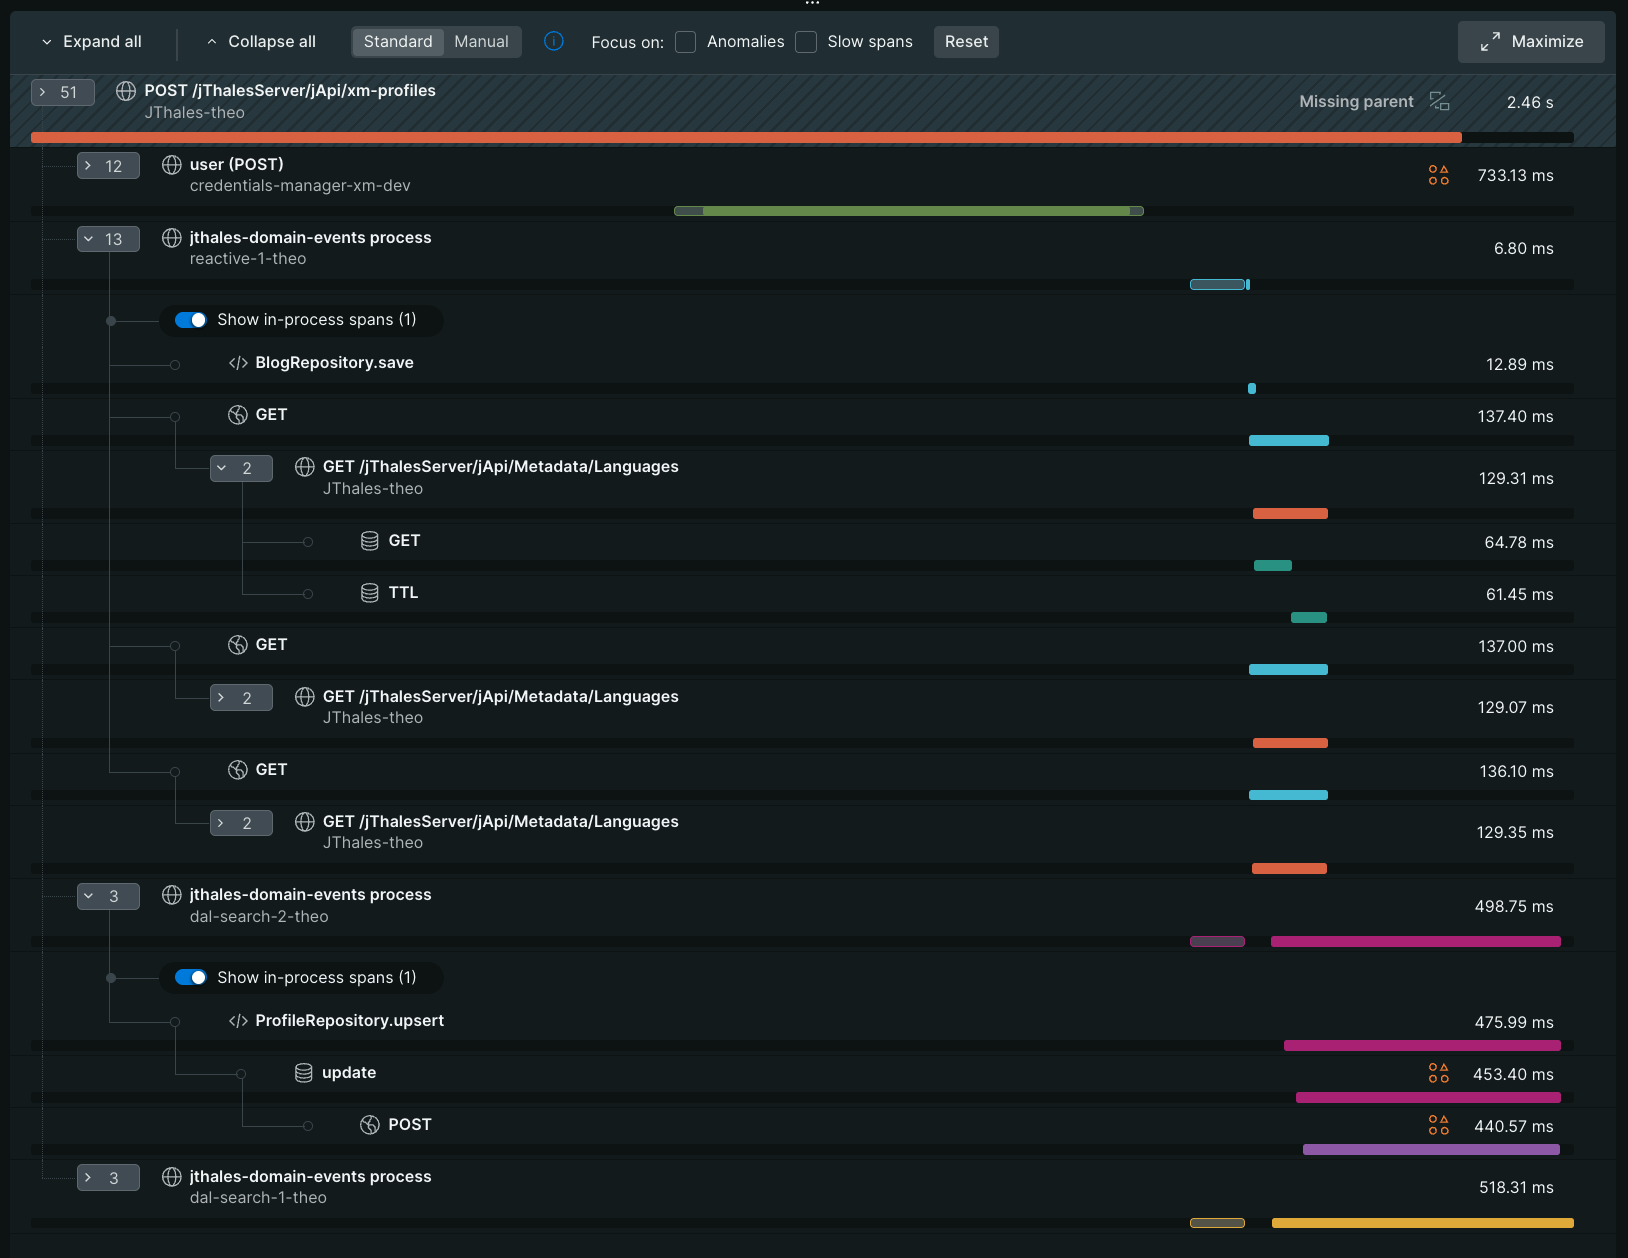
➝ Span: A single unit of work—represents an operation or step within a trace.
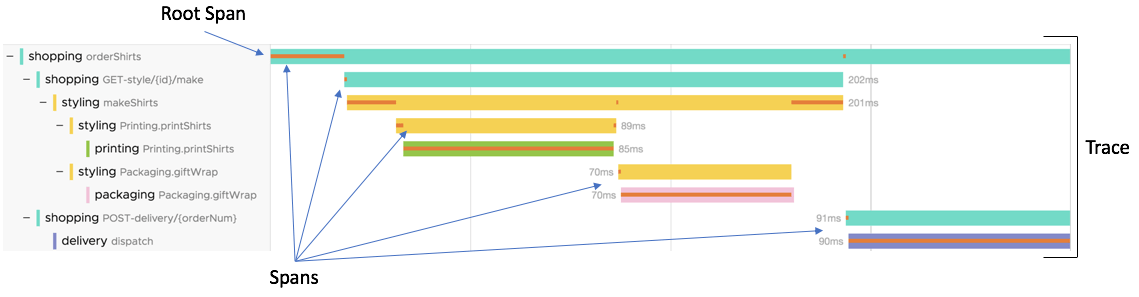
➝ Parent Span: The span that initiated a sub-operation.
➝ Child Span: A sub-operation spawned by a parent span.
➝ Root Span: The first span in a trace—often the inbound request handler.
➝ name – logical operation name (e.g., GET /users)
➝ start time / duration
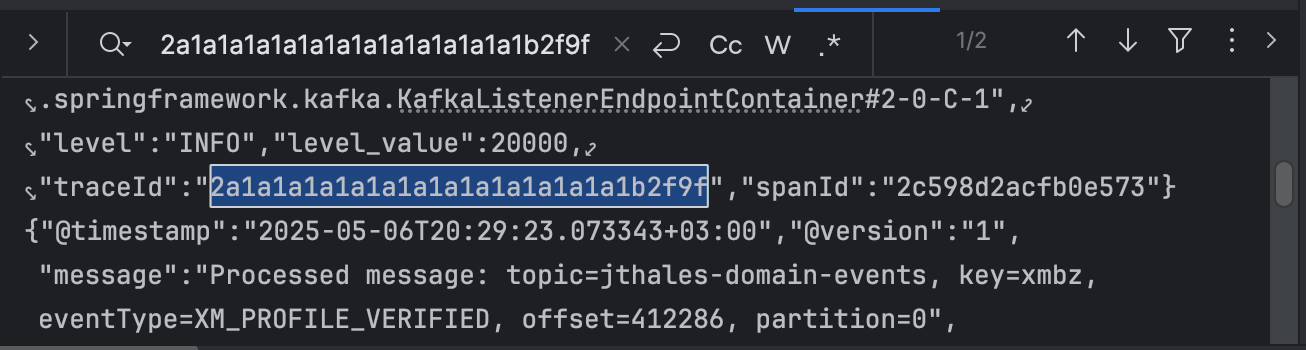
➝ trace-id – shared across the whole trace
➝ span-id – unique to this span
➝ parent-id – optional, links to upstream span
➝ attributes – key-value metadata (e.g., http.method, db.statement)
➝ events – timestamped logs within a span
➝ status – success, error, etc.
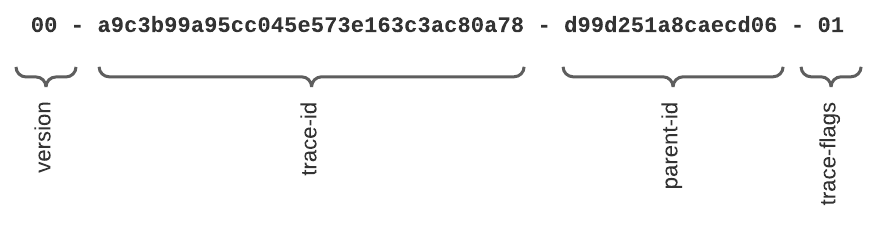
📌 Key Concept: traceparent header
The traceparent HTTP header tracks request lineage across service boundaries. It contains:
➝ version – format version
➝ trace-id – unique ID for the entire trace
➝ parent-id – ID of the calling span
➝ trace-flags – flags for sampling/debugging
Setup approaches
1. NewRelic agent → NewRelic
2. Otel agent → Otel Collector → (Tempo + Grafana)
3. Otel agent → NewRelic OTLP Endpoint → NewRelic
4. Micrometer & Otel bridge (no agent) → NewRelic OTLP Endpoint → NewRelic
✅ Trace correlation: Spans are easily correlated across services using New Relic’s telemetry format.
✅ Some auto-tracing out-of-the-box: Auto tracing for some common frameworks and libraries.
❌ Some auto-tracing out-of-the-box: No propagation of context for Kafka (requires extra code for producer/consumer).
⚠️ Respects traceparent header: Propagation of injected traceparent request header. BUT.
❌ Vendor-specific tracing model: Changes the name of the Kafka message header to newrelic
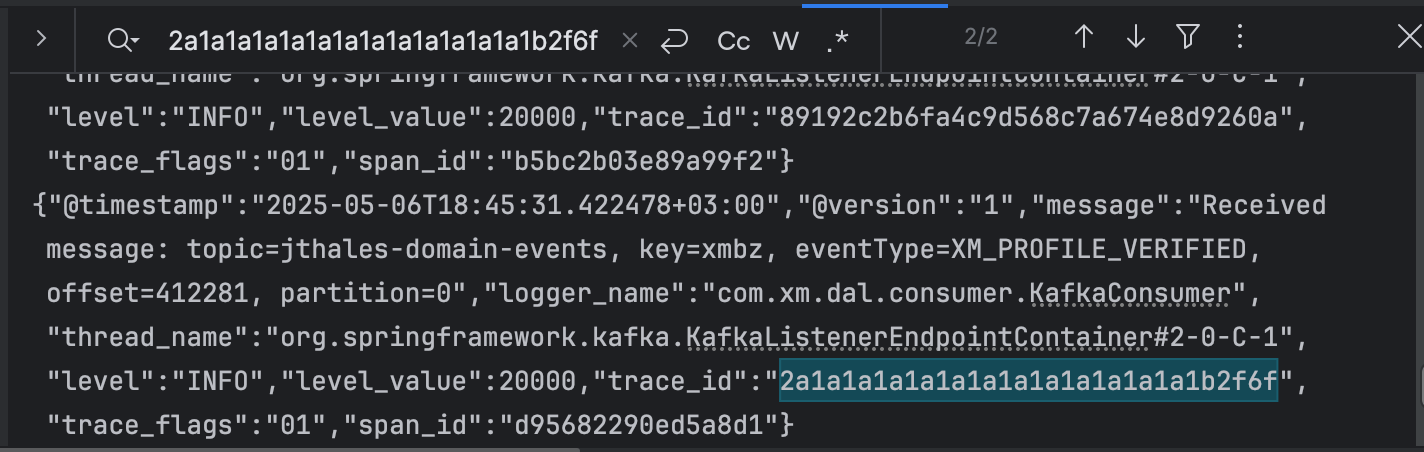
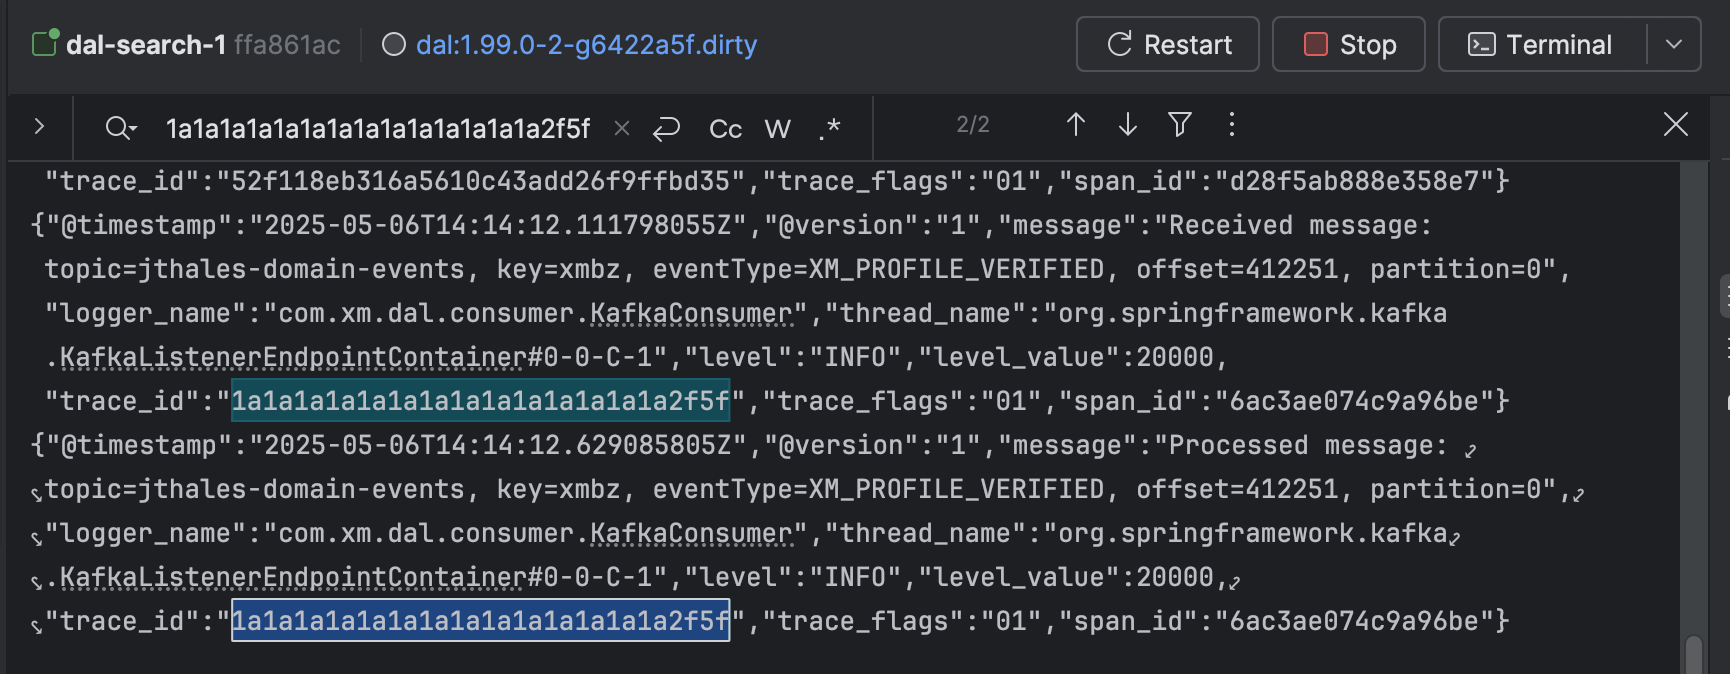
❌ No traceId in logging MDC: Will require some other mechanism for populating logging context (Xm Logging library).
❌ Requires using a java agent: Can be preventing at times.
❌ Vendor lock-in: Not possible to switch to a different UI
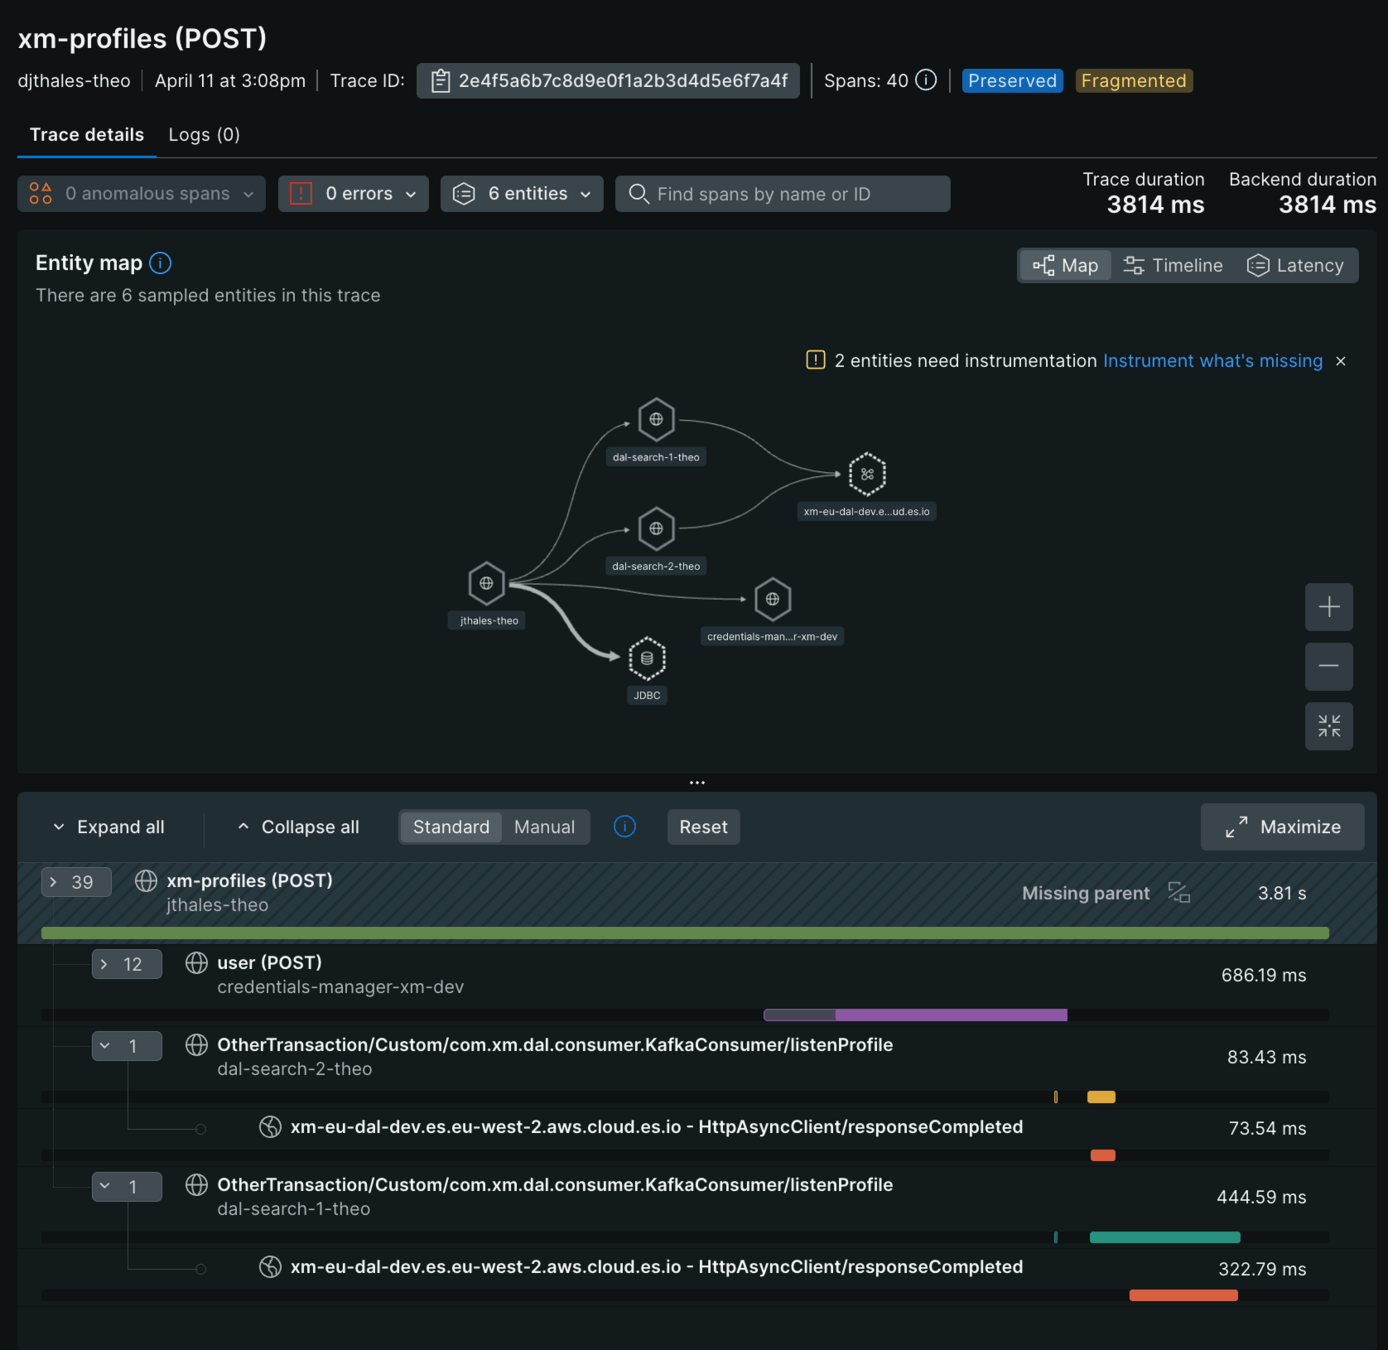
✅ Advanced visualizations: Mature one-stop-shop UI for end-to-end trace analysis, service maps, and latency breakdowns.
✅ Standards-compliant: Fully W3C Trace Context-compliant; spans flow consistently across any instrumented services.
✅ Minimal effort for context propagation: Automatic propagation of tracing context across Kafka and MDC logging context.
✅ Auto discovery: Supports a plethora of supported libraries/requires minimal configuration.
❌ Requires using a java agent: Can be preventing at times.
✅ Highly customisable: Modular and customisable.
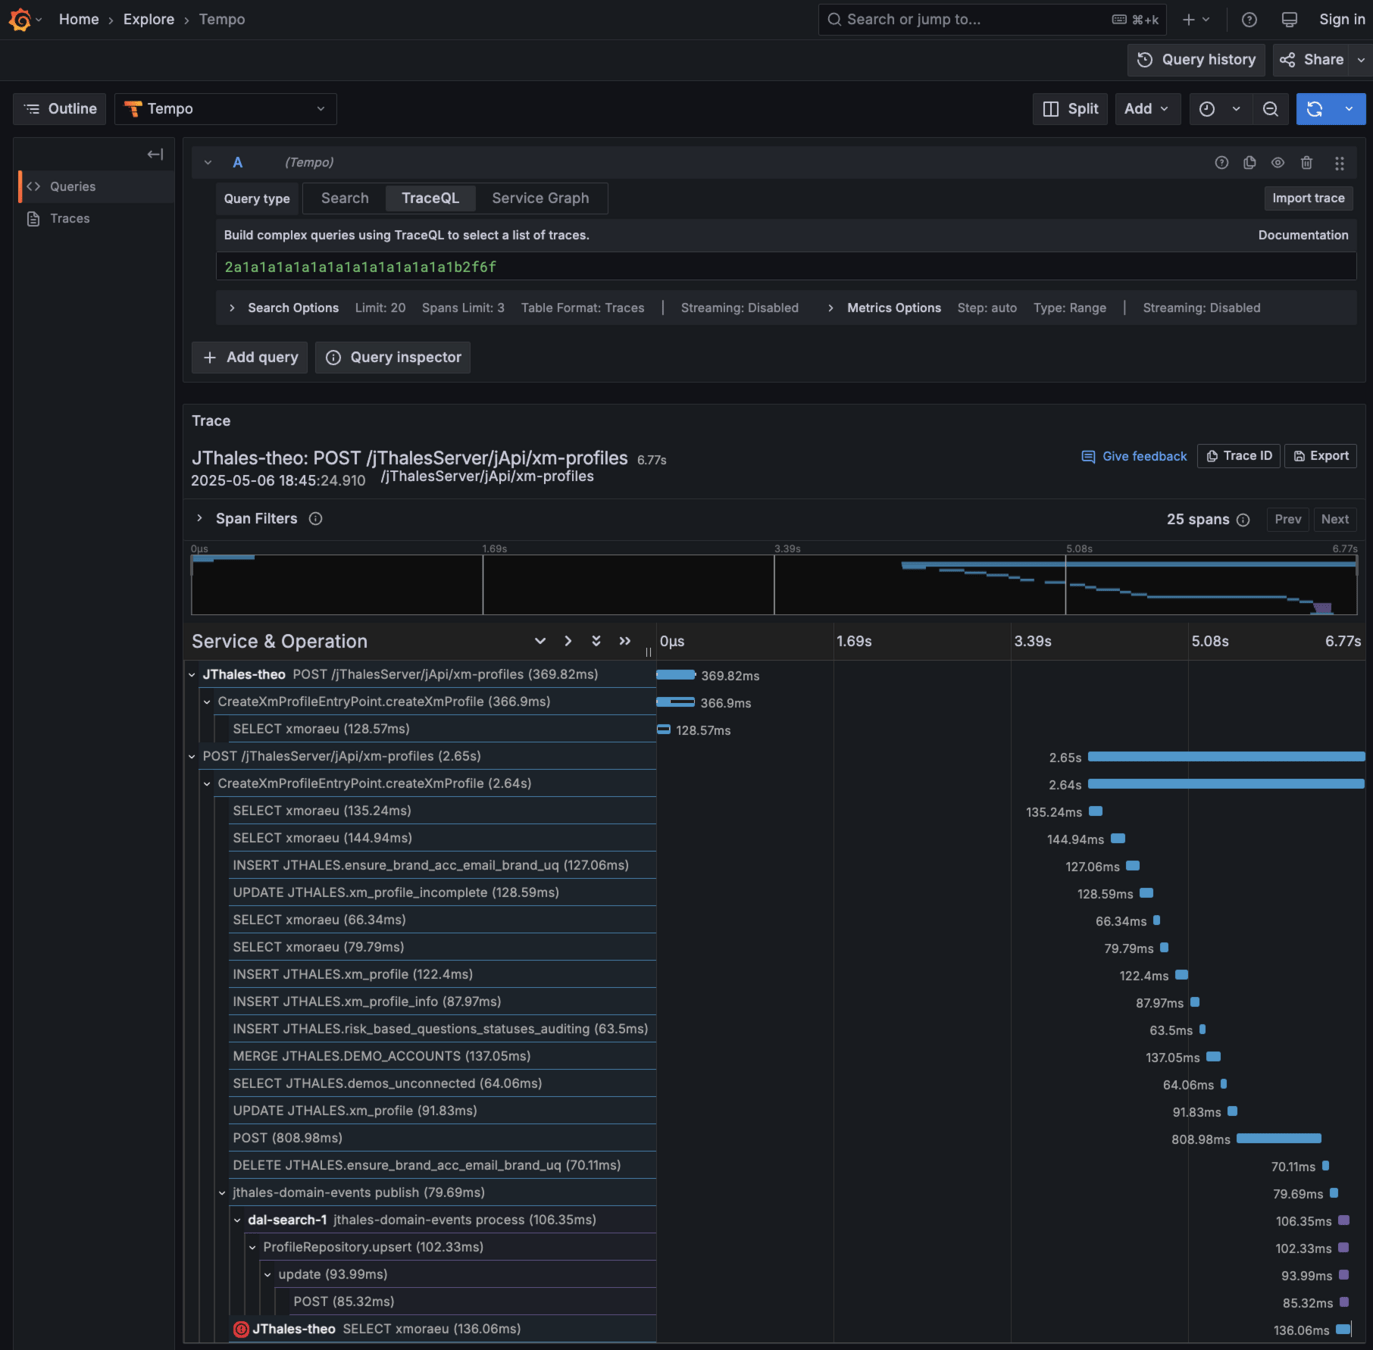
❌ Limited traces UI: Traces UI is basic — lacks features like deep dependency maps.
⚠️ Requires configuration: Configuring and maintaining it can be time-consuming.
✅ Best of both worlds: Uses open-source instrumentation (Otel) and feeds into a polished tracing UI (New Relic).
✅ SpringBoot specific: Tailored to SpringBoot applications and components.
✅ Unified Facade API: Centralised observability facade from custom metrics and traces.
✅ Lightweight: No runtime agent - avoids library version incompatibilities and reduces overhead.
✅ High Precision: Only essential spans are created — reducing trace noise.
⚠️ Configuration-driven auto-instrumentation / context-propagation: Components must be appropriately configured to enable auto-tracing - easy to miss key traces (especially with async/Kafka)
❌ High implementation effort: More complex and time-consuming to scale across services vs OTEL agent.
⚠️ which approach do we follow for tracing?
⚠️ standardise UI for viewing traces? Grafana/NewRelic.
⚠️ standardise approach for generating traces? NewRelic agent/Otel agent/Micrometer.
⚠️ adopt traceparent standard convention?
..to consider if traceparent standard is adopted
⚠️ ensure front end systems are generating the traceparent header.
⚠️ AWS API GW does not automatically propagate traceparent headers, only by being explicit on velocity templates.
⚠️ istio proxy does not automatically log traceparent header, and will require adding support for it.
By Theo Kliaris