Using Linked Open Data to Build a Culture of Collaboration at

Yale University

Network of interconnected nodes and lines on a gradient background that transitions from a warm golden hue at the bottom to a clear blue at the top. The nodes vary in size and are connected by thin lines, creating a web-like structure. Some nodes appear as filled circles while others are outlined, and the density of the network varies across the image, with some areas more clustered and others more sparse.

Tim Thompson

Librarian for Applied Metadata Research

Yale University Library

timothy.thompson@yale.edu

www.linkedin.com/in/timathompson

@timathom@indieweb.social


MARC Formats Transition Interest Group

Core Interest Group Week

March 15, 2024

Attribution

License
Creative Commons Attribution 4.0 Internaional (CC-BY).
Acknowledgement
  • Includes CC-BY content by Robert Sanderson, Yales Senior Director for Digital Cultural Heritage.
  • Selected images generated using DALL·E (ChatGPT), Midjourney, Adobe Photoshop.
Sources
Badge representing the Creative Commons Attribution 4.0 International License (CC-BY).

Overview

Frameworks
Linked data as a sociotechnical undertaking
Background
A little history to explain the institutional context at Yale
LUX platform

System demo

Why Linked Data?

Two fundamental reasons for implementing a linked data approach:

  1. Information management. Organize and share bibliographic information with greater precision and efficiency.
  2. Resource discovery. Facilitate search and retrieval online, leveraging semantics to highlight relationships among resources.

Resource discovery

  • The LUX project focused on the second motive, discovery.
  • Instead of changing our workflows, we focused on proving the value of a linked data approach for our users and our metadata.
Vintage sepia-toned photograph with the ironic staging of the saying Don't put the cart before the horse. A horse stands harnessed behind a small two-wheeled cart, rather than in front of it. The person in the cart, dressed in dark clothing and a cap, appears to be ready to drive, oblivious to the reversed setup. The background features a wide-open field, enhancing the absurdity of the scene with the horse standing still on the grassy path, under a vast sky marked by clouds.

Resource Discovery

Information Management

Thesis

  • The transition from legacy formats such as MARC 21 has been a struggle because we’ve tried to do the hardest parts first.
  • Change management requires imagination and inspiration.
  • A discovery system is a concrete reference point that benefits users directly; it can serve as a “north star” for future work.

Collections at Yale

Interior of the Yale Center for British Art, featuring minimalist and modern decor. On the left, windows allow natural light to enter and showcase some framed artworks. In the center and to the right, a painting of a seascape hangs on the wall, with dark colors highlighting the dramatic scene of clouds and sky over a beach. The space is spacious and welcoming, with brown sofas inviting visitors to pause and contemplate the artworks. The architecture blends elements of light wood and concrete details, creating an atmosphere of tranquility and reflection.
Room of the Yale University Art Gallery, bathed in natural light filtering through tall windows. Various classical statues and busts on pedestals are observed, creating a calm and contemplative atmosphere. Each piece is accompanied by its own descriptive label, allowing visitors to learn about its history and significance. To the right, a display case contains ancient vessels, highlighted by the light entering through the window and reflecting their intricate details. The exhibition combines elements of classical architecture with a modern and accessible layout, inviting reflection and study of the pieces.
Fossil skull of a Tyrannosaurus rex on display at the Yale Peabody Museum of Natural History. The fossil is well-preserved, showcasing the formidable jaw and sharp teeth of the dinosaur, aspects that allude to its reputation as one of the most powerful predators of the Mesozoic era. The lighting and angle of the photo emphasize the texture and shape of the skull, providing a detailed view that invites contemplation and paleontological study.
Interior of the Beinecke Rare Book & Manuscript Library at Yale University in New Haven, Connecticut. An extensive collection of rare books and manuscripts is stored on glass shelves that reach from floor to ceiling. The warm lighting highlights the spines of the books and creates a serene atmosphere. The architectural structure of the library, with walls of translucent marble, allows natural light to softly filter into the space, protecting the valuable materials from direct light exposure. Known for its unique design and impressive collections, the library is a point of interest for both researchers and visitors interested in the history of books and scholarship.

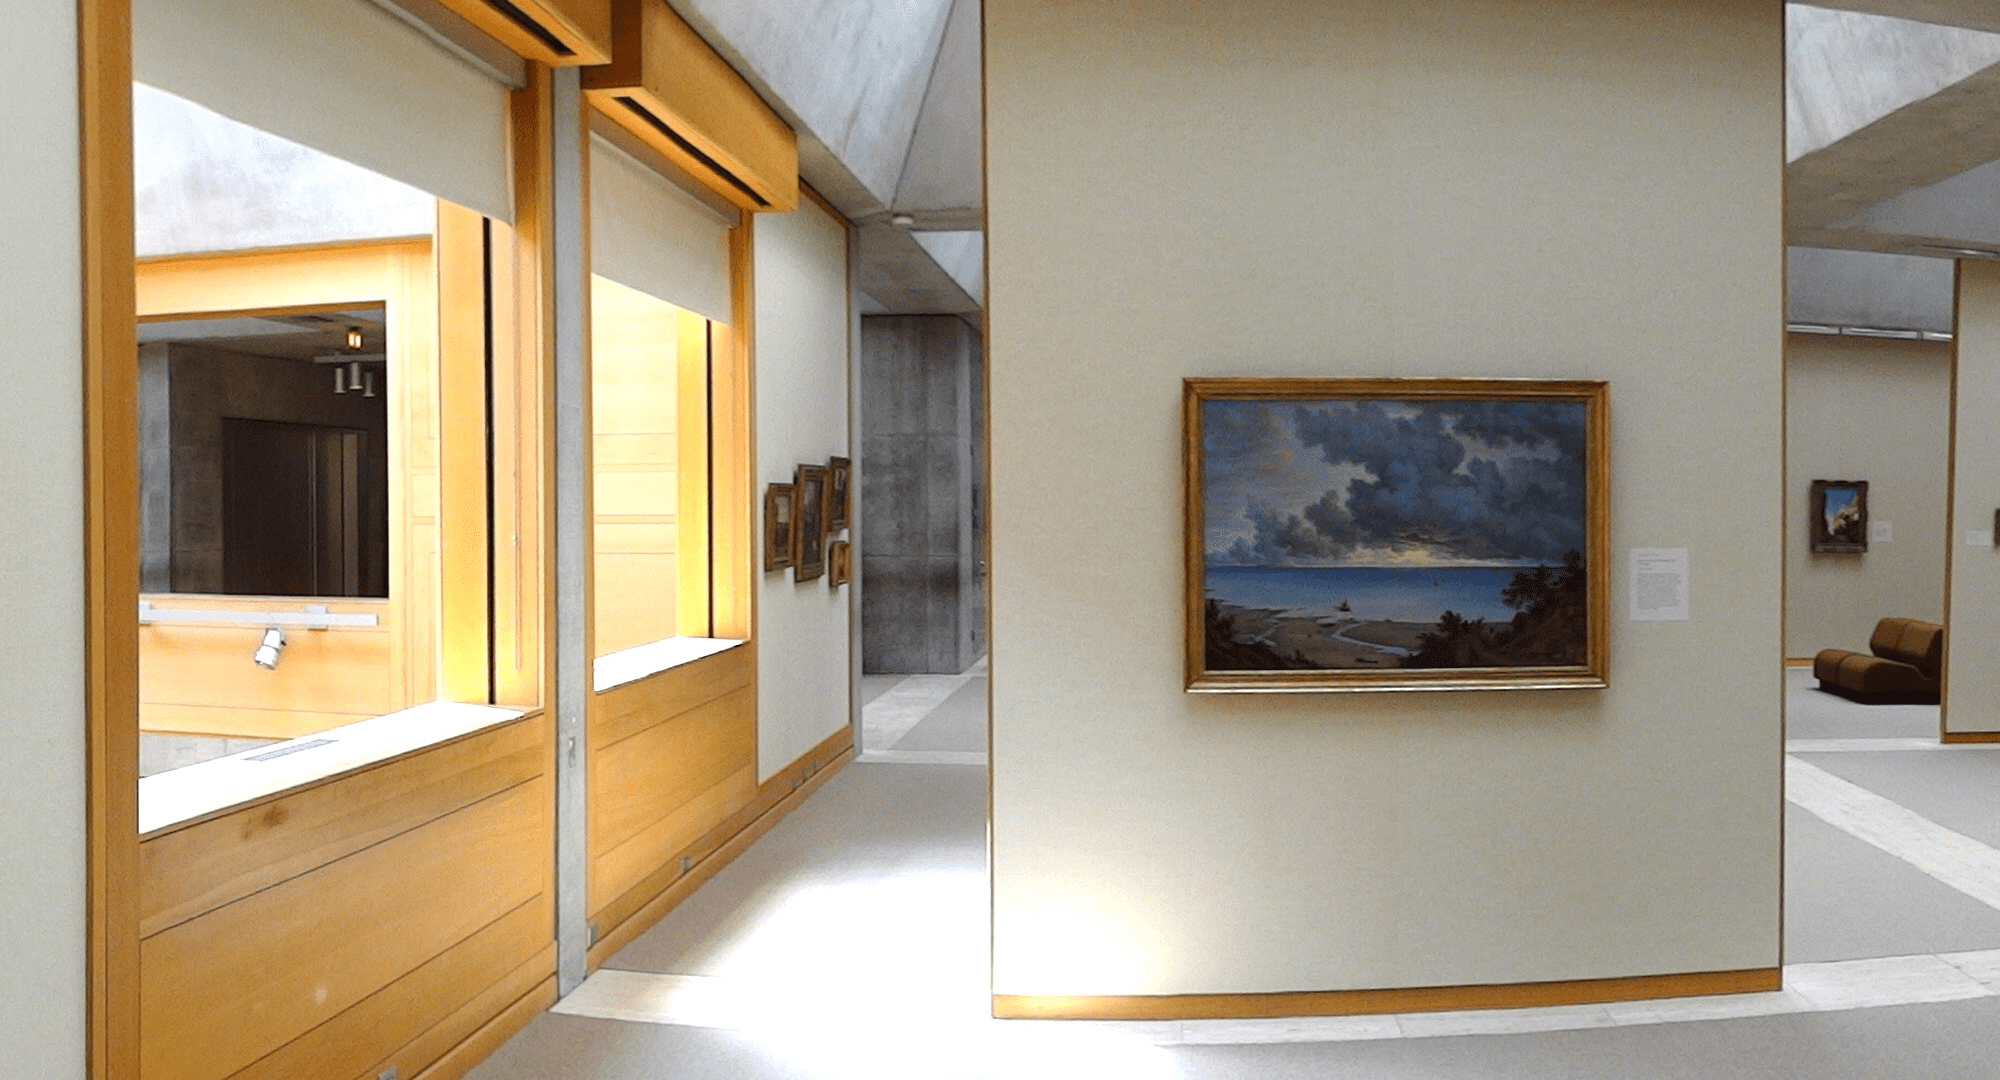
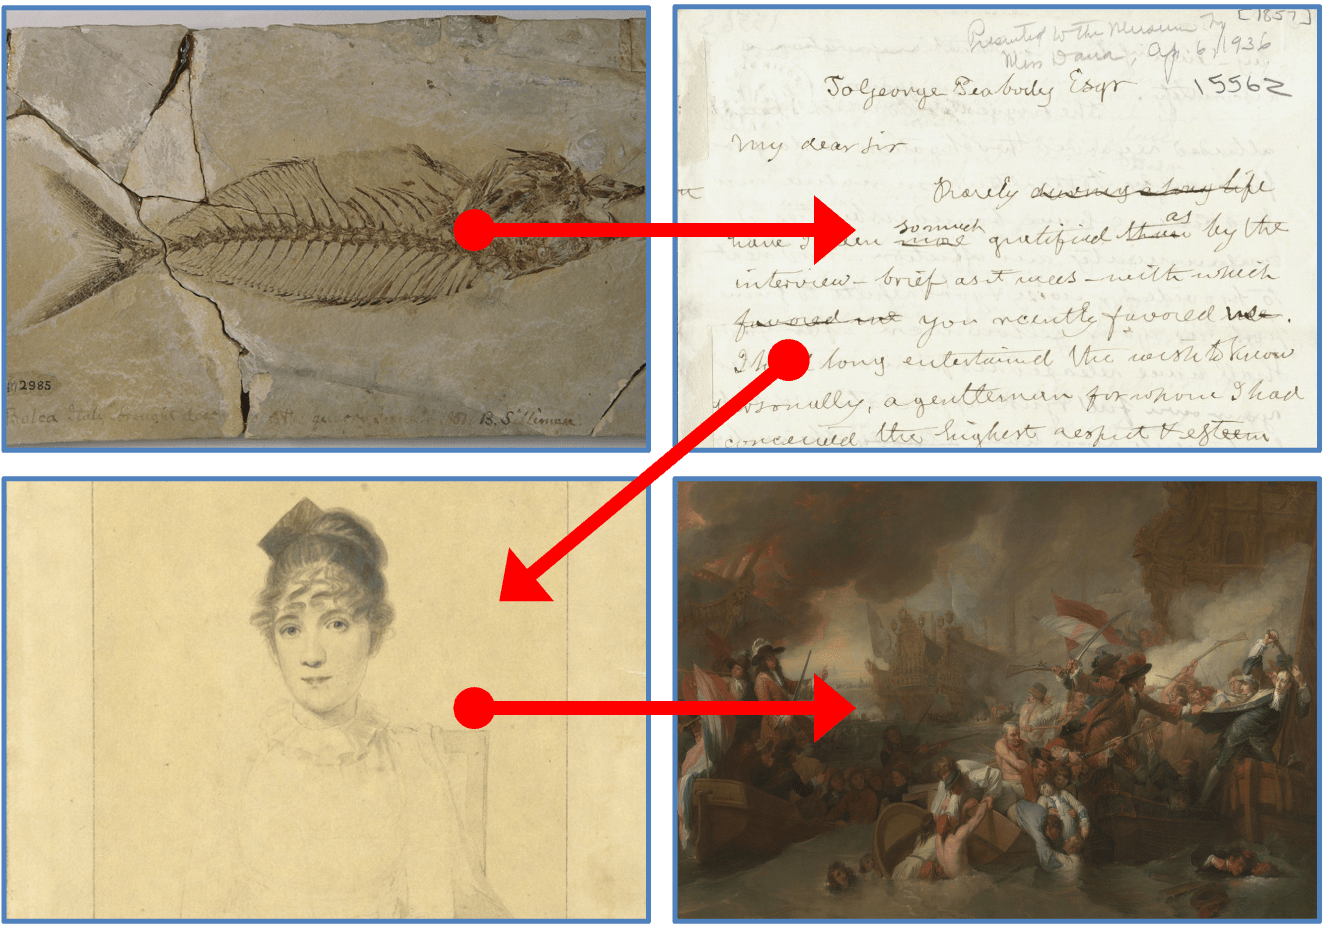
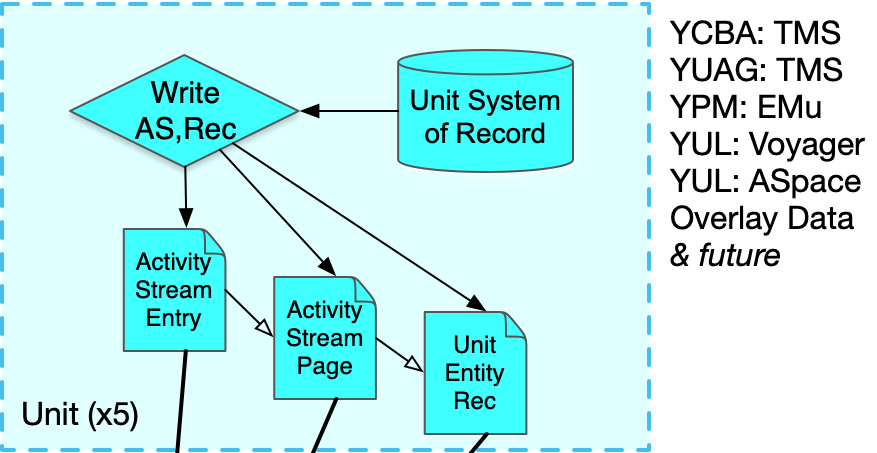
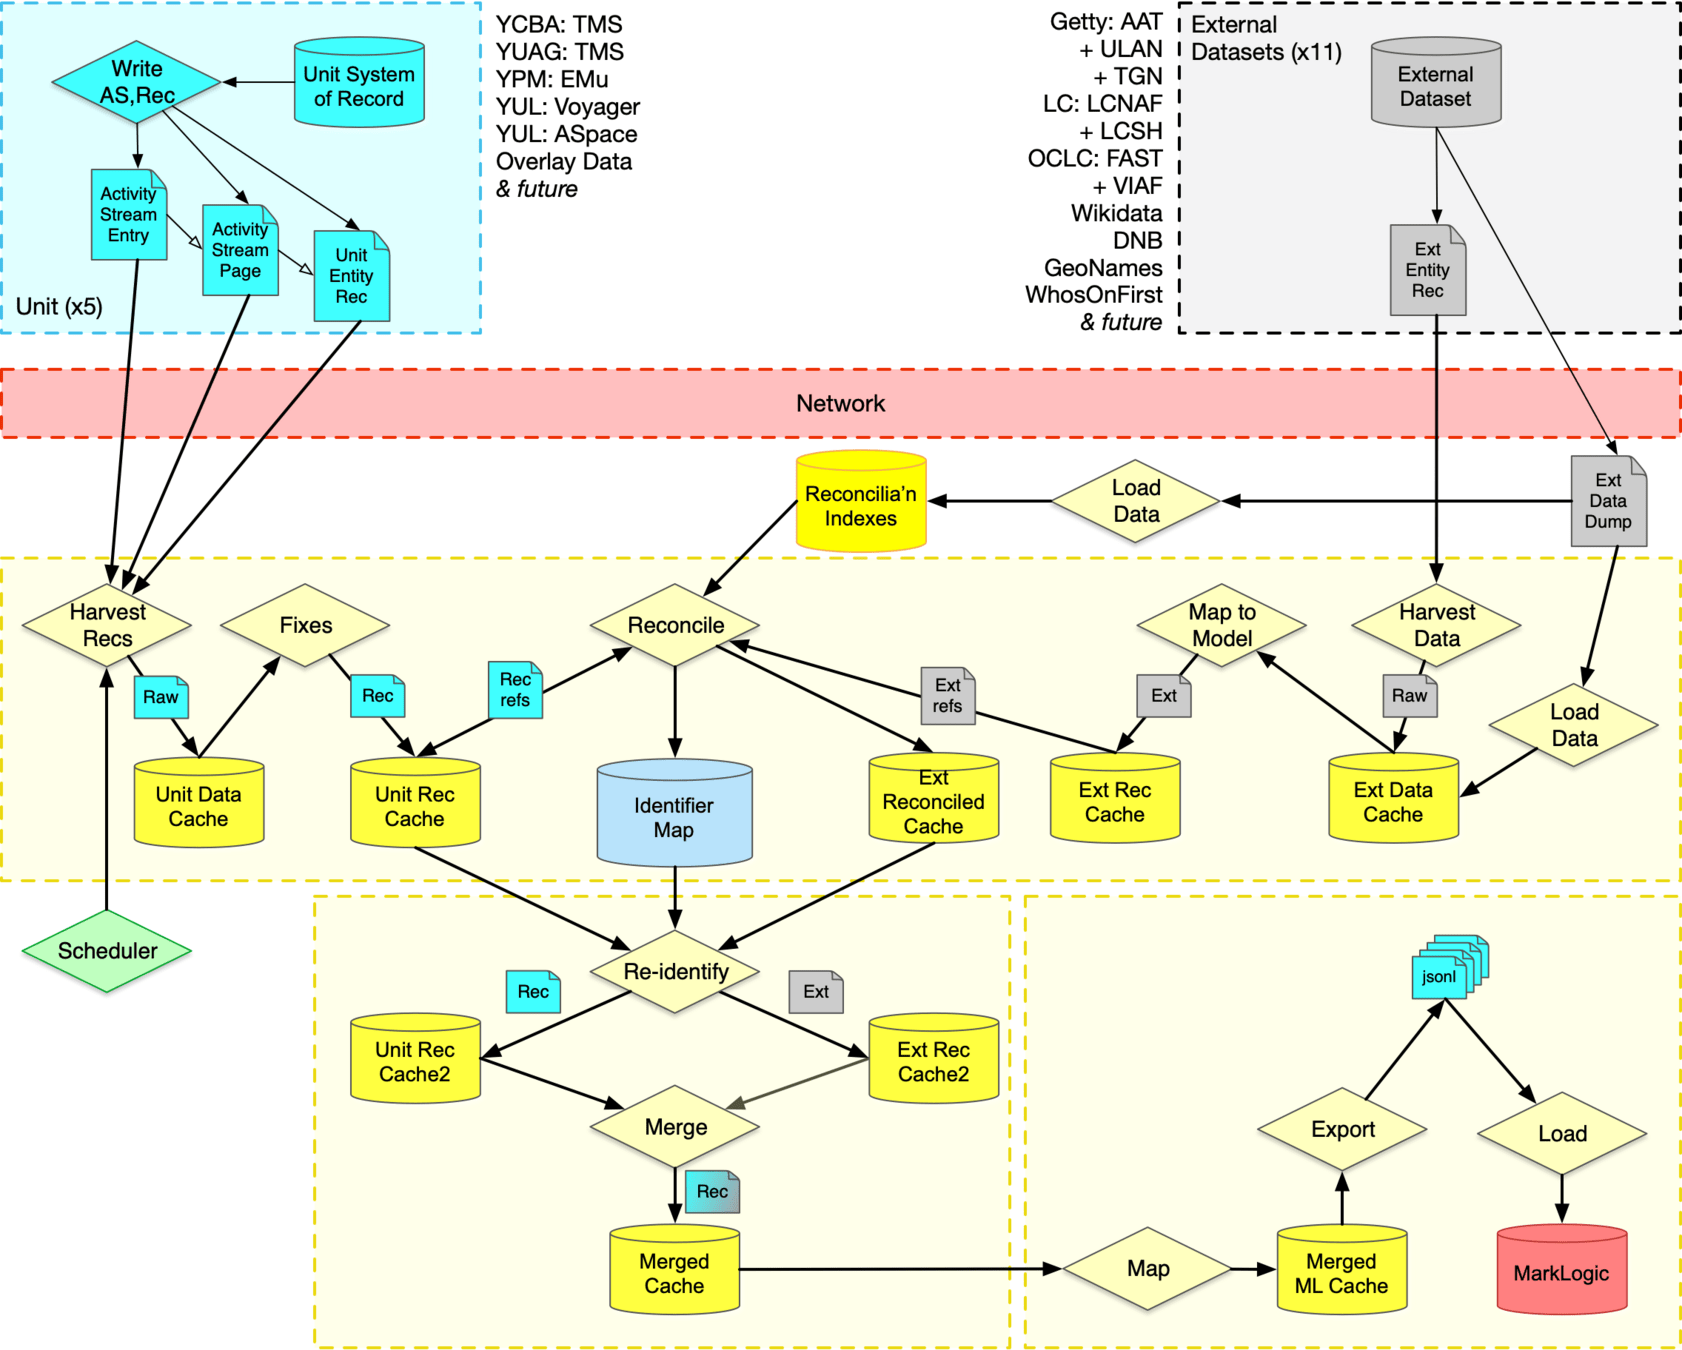
Yale Center for British Art, Karl Thomas Moore, CC BY-SA 4.0, via Wikimedia Commons

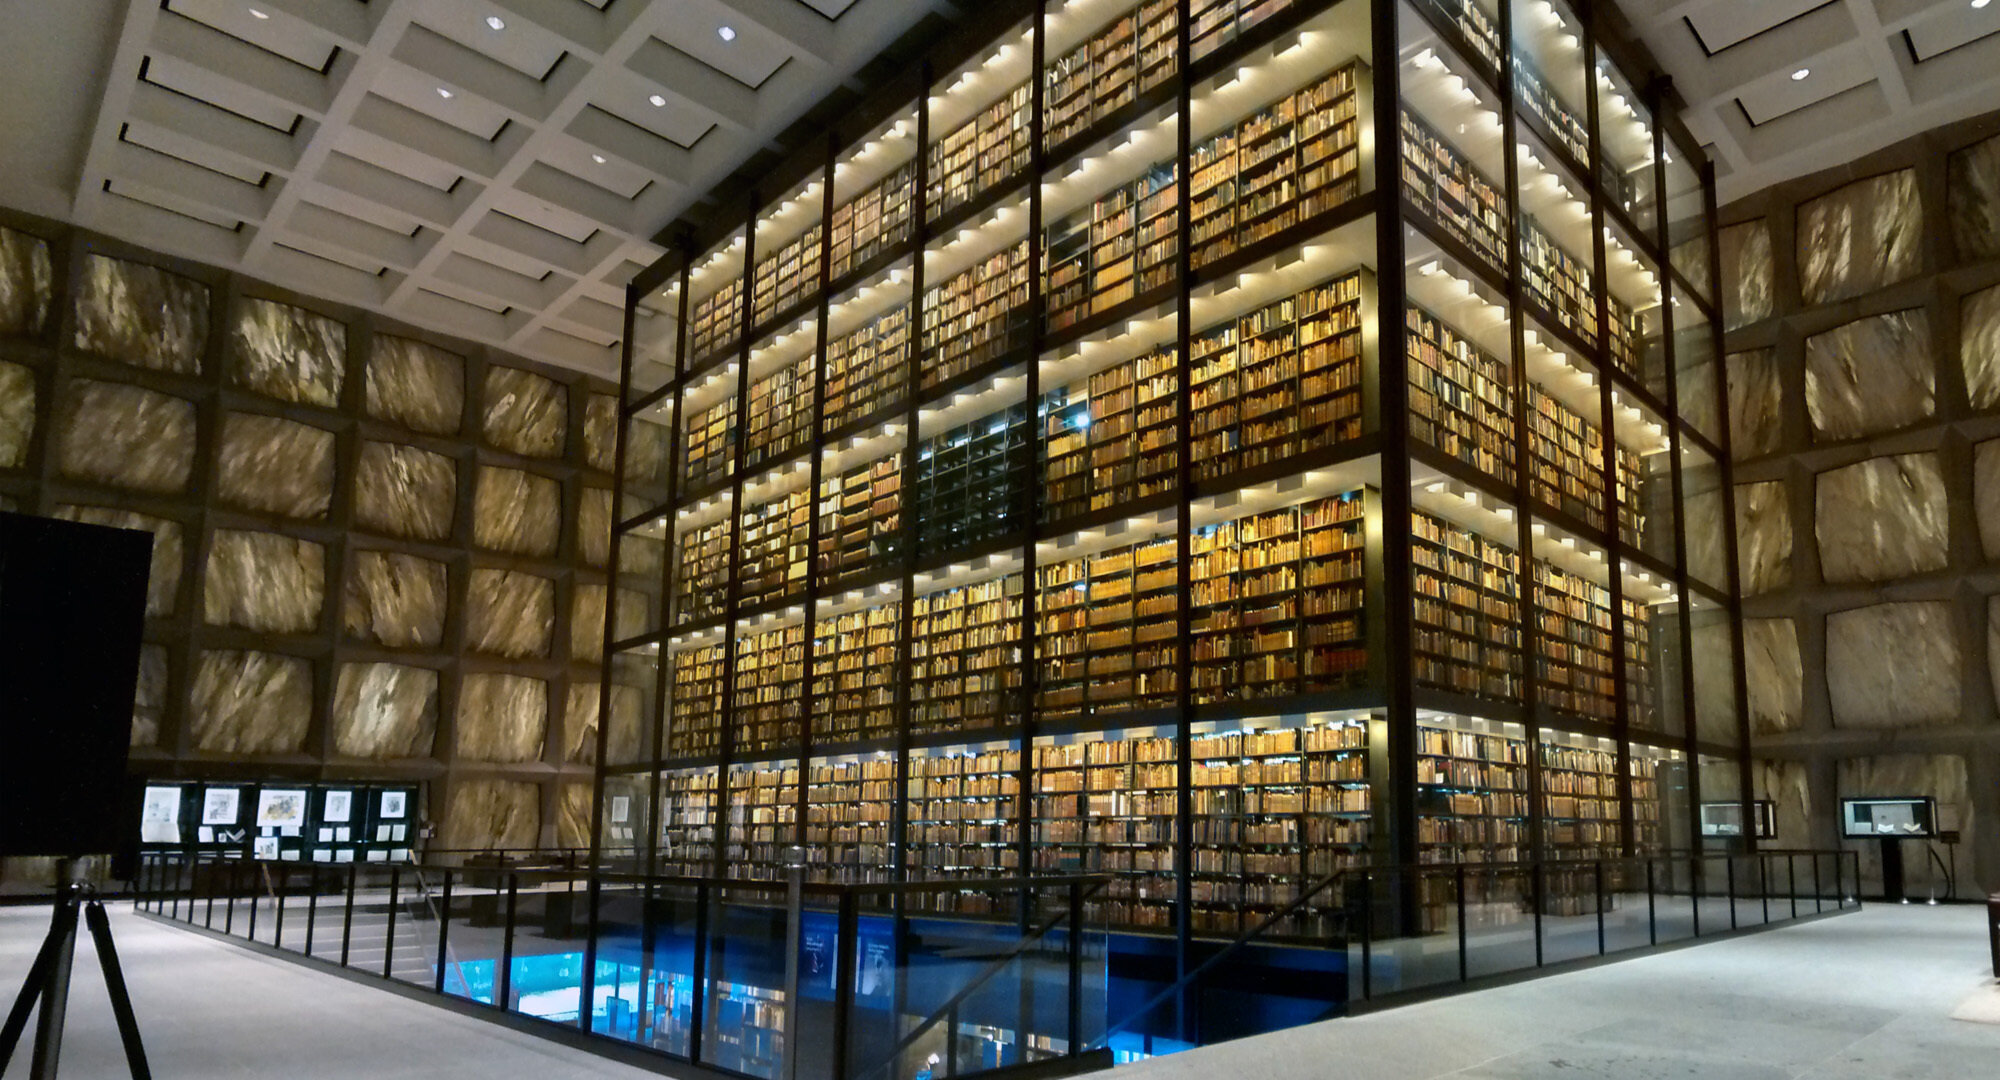
Beinecke Rare Book & Manuscript Library, Adam Jones, CC BY-SA 2.0, via Wikimedia Commons

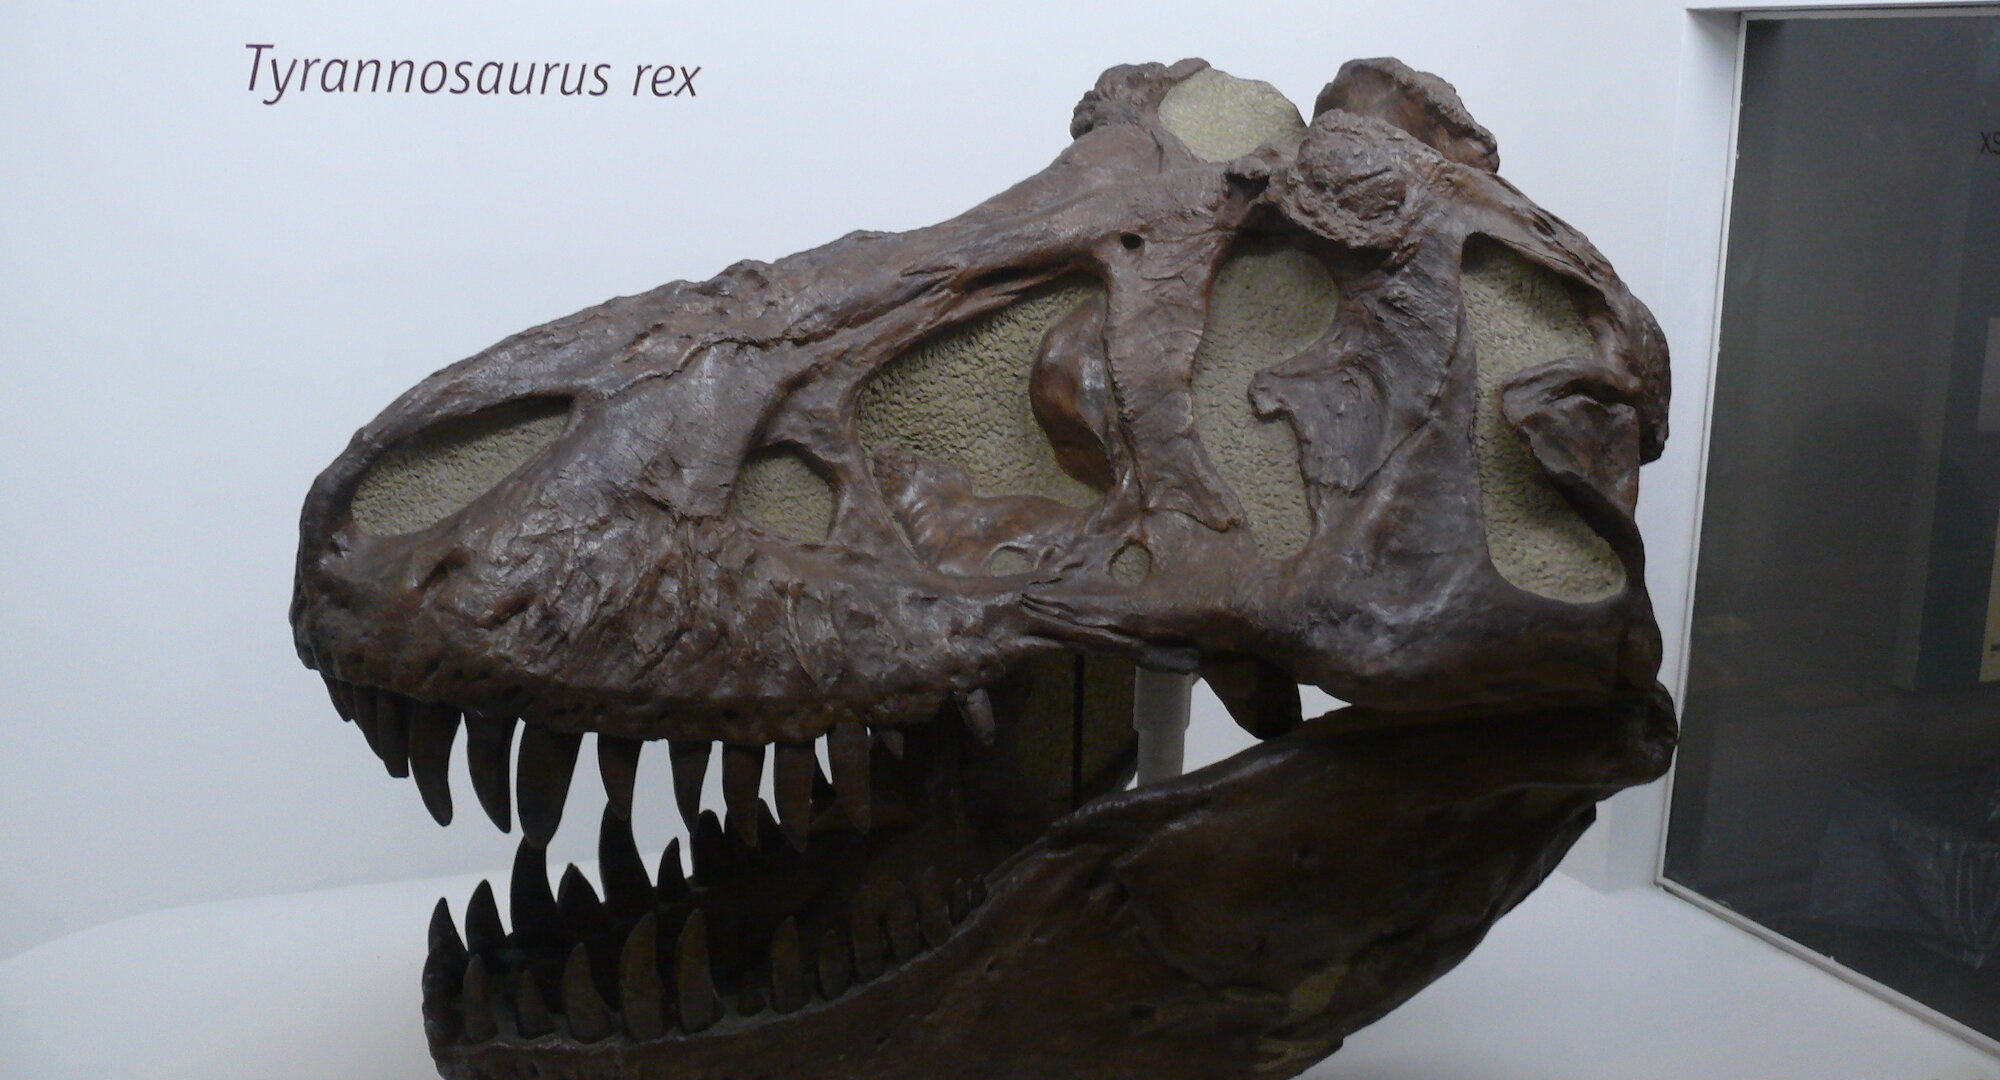
Yale Peabody Museum of Natural History, Gunnar Klack, CC BY-SA 4.0, via Wikimedia Commons

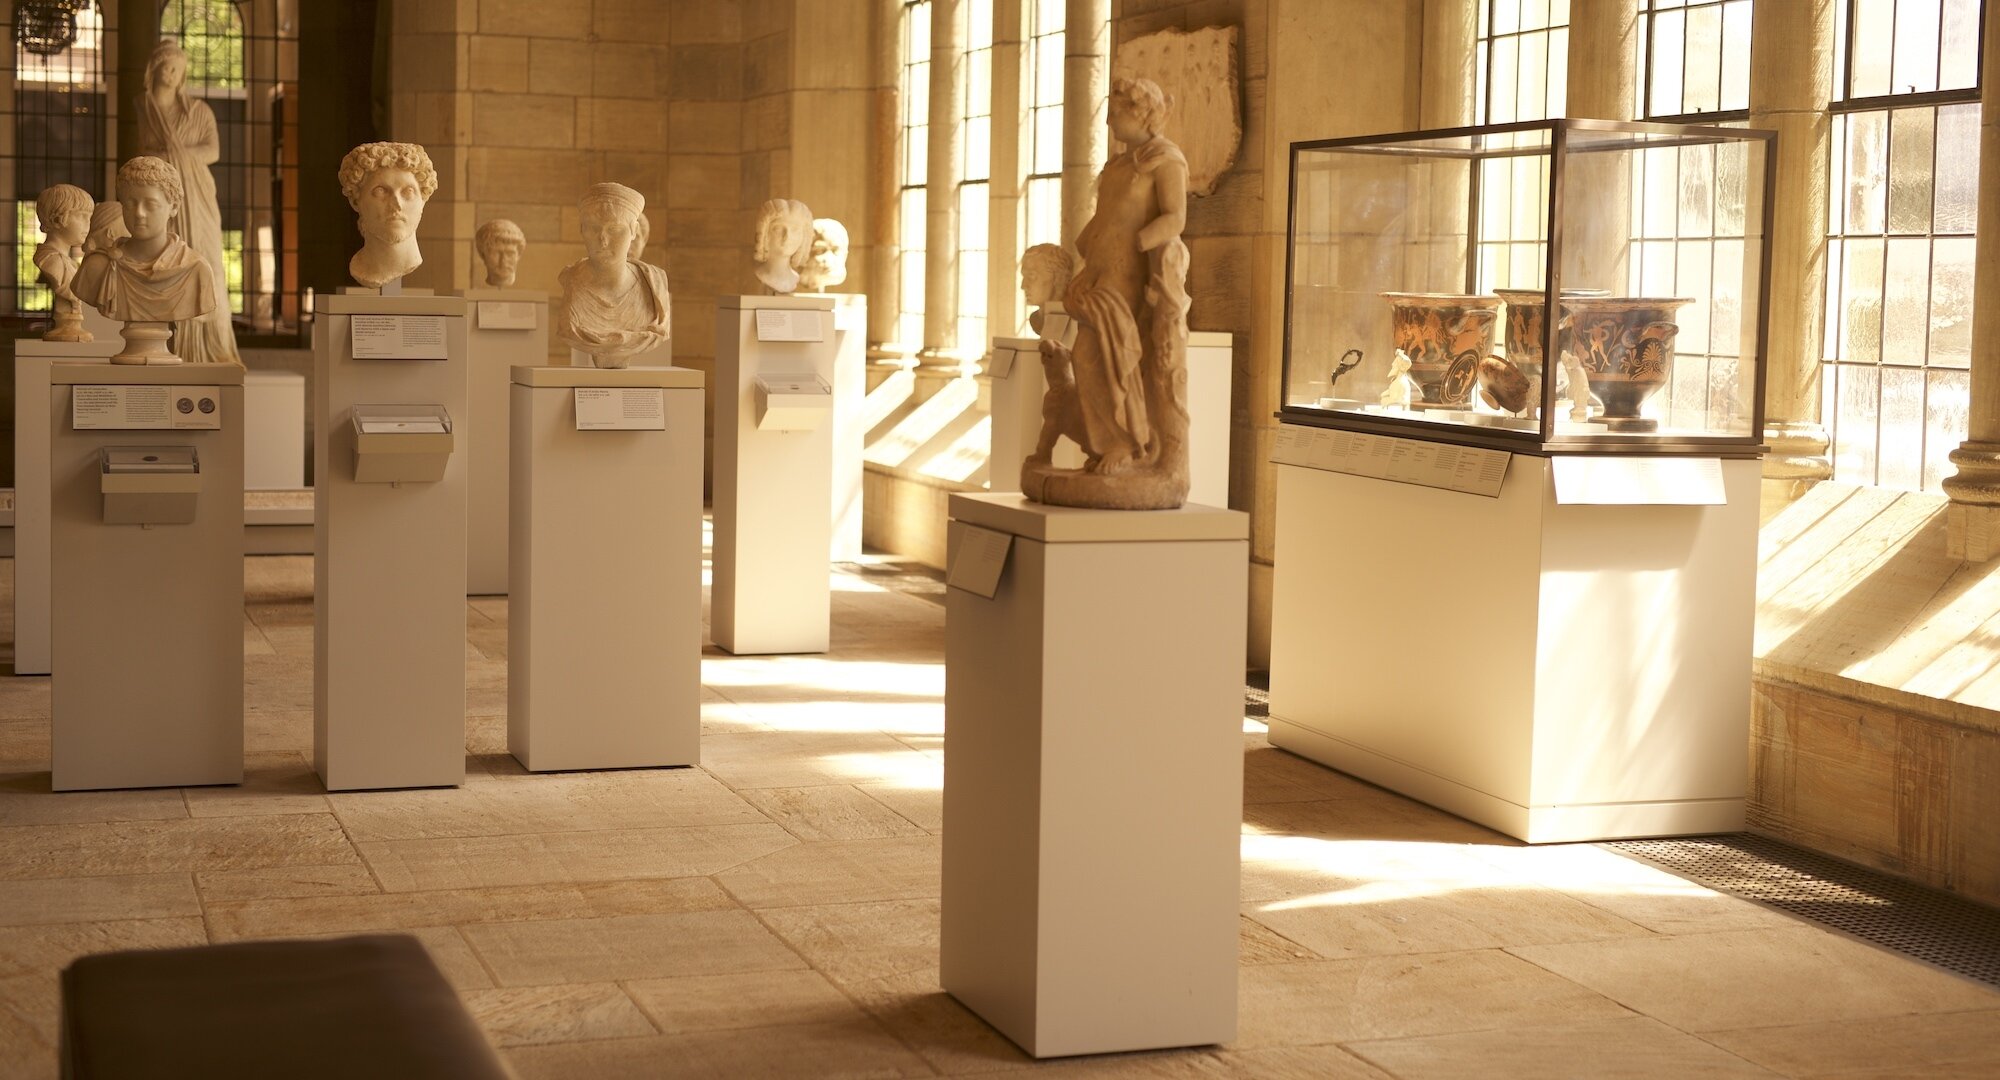
Yale University Art Gallery, Ad Meskens, CC BY-SA 3.0, via Wikimedia Commons

Timeline

2008
Office of Digital Assets and Infrastructure created.
2011
  • Yale Open Access policy instituted.
  • New university librarian hired.
2012
New president selected for the university.
Timeline spanning from 2008 to 2012, with marks indicating specific points or events throughout those years. The line has arrows at both ends, suggesting continuity beyond the indicated years.
2015
Yales university librarian named Deputy Provost for Collections & Scholarly Communication.
Timeline that includes the year 2015. The timeline has arrows at both ends, indicating continuity before and after this specific period.
2017
  • New chief information officer hired.
  • The Cultural Heritage IT (CHIT) pillar established within Yale Information Technology Services.
Timeline that includes the year 2017. The timeline has arrows at both ends, indicating continuity before and after this specific period.
2018
  • CHIT Collaboration formed.
  • Cross-Collection Discovery (CCD) working group and Cultural Heritage IT Architecture (CHITA) group formed.
Timeline that includes the year 2018. The timeline has arrows at both ends, indicating continuity before and after this specific period.
2018-2021
International Image Interoperability Framework (IIIF) implemented for Yale digital assets.
Timeline spanning from 2018 to 2021, with marks indicating specific points or events throughout those years. The line has arrows at both ends, suggesting continuity beyond the indicated years.
2019
  • University librarian named Vice Provost for Collections & Scholarly Communication.
  • Cross Collection Discovery Project begins to take shape.
  • Project manager hired.
  • Workshop held with a broad group of stakeholders to define requirements for a new cross-collection discovery platform.
  • The name LUX, or light, is chosen for the platform.
Timeline that includes the year 2019. The timeline has arrows at both ends, indicating continuity before and after this specific period.
2020
  • Unified metadata scheme created.
  • Prototype installed using Blacklight and Apache Solr for testing.
  • Mellon Foundation grant awarded to Yale to support metadata reconciliation and library/museum collaboration.
  • Rob Sanderson hired as Director for Cultural Heritage Metadata.
Timeline that includes the year 2020. The timeline has arrows at both ends, indicating continuity before and after this specific period.
Timeline that includes the year 2021. The timeline has arrows at both ends, indicating continuity before and after this specific period.
2021
  • Software system selection process to build LUX carried out.
  • MarkLogic system chosen to build the platform.
2021-2023
LUX build and launch!
Timeline spanning from 2021 to 2023, with marks indicating specific points or events throughout those years. The line has arrows at both ends, suggesting continuity beyond the indicated years. A rocket icon with flames coming out of its engine is positioned at the beginning of the timeline, symbolizing a launch or start in the year 2023.
Timeline, starting with the year 2023 indicated at the bottom, suggesting the beginning of an event or series. The end date is open-ended, implying continuation beyond the starting point. A playful cartoon rocket with an eye-shaped window is depicted at the onset of the timeline, symbolizing a launch or commencement. The rocket is facing left and surrounded at the bottom by swirling blue lines, suggesting a sense of turbulence. The progress bar extends horizontally across the image, with a yellow line marking a specific point and an arrow at the end pointing rightwards, denoting ongoing progress or future developments from 2023 onwards.
2023–
Production phase and iterative improvements

Goals of LUX: Yale Collections Discovery

  • Reveal the cultural heritage collections of Yale University to the world.
  • Provide a unified gateway to the holdings of Yales museums, archives, and libraries.
  • Enhance user access by providing a novel approach to engaging with both physical and digital collections at Yale.
  • Uncover relationships among items, prompting users to explore the collections more deeply.

Collaboration!

  • Over the course of the project, around 100 individuals collaborated across IT and cultural heritage units at Yale.
Organizational chart of the Cultural Heritage IT Steering Committee. At the top, an elliptical node labeled Cultural Heritage IT Steering Committee connects to a central diamond-shaped node labeled Projects. This central node branches out to five rectangular nodes, three of which are directly below it in green, labeled Bias Awareness & Responsibility, Cultural Heritage IT Architecture, and LUX Program (Cross-Collections Discovery), respectively. The LUX Program node branches further into two yellow nodes labeled Metadata WG and Rights WG, which both connect to another set of two yellow nodes labeled Search & Discovery AG and User Interface/Experience WG, respectively. The diagram represents a hierarchical structure with the steering committee at the top, overseeing various projects that are further broken down into specific working groups and action groups.

Challenges of connecting Yales cultural heritage

  • Differences among organizational cultures, systems, and standards.
  • No one wanted to create another traditional search engine.
  • Units should own their data; no desire to maintain a new central system of record.
  • Goal: a coherent, engaging, and useful system.
Four different elements that are part of a collage. In the top left corner, there is a fish fossil found by Benjamin Silliman. In the top right corner, a handwritten letter from Silliman addressed to George Peabody Esq. is displayed with elegant and detailed script. In the bottom left corner, a delicate drawing of the portrait of Harriet Trumbull, niece of the artist John Trumbull, is seen. Finally, in the bottom right corner, a vibrant painting of a battle made by John Trumbull and his teacher, Benjamin West, is presented. Red arrows connect each of these works, illustrating the connections between different pieces in the Yale collections.

Frameworks for Collaboration

Marcos de metadatos

Alineación transversal de colecciones

Tabla de configuración de metadatos con varias columnas tituladas Solr Grouping, Solr Nesting, Solr Multi, Vend Lowercase, Fieldname y Field Control. Los datos presentados se relacionan con categorías como notes y agents, y contienen especificaciones como DoubleNest y yes en distintas combinaciones, así como nombres de campos como note_alt_display : character_set, agent_display, language_code, entre otros. Algunos registros están destacados en amarillo y azul, indicando categorías o notas especiales, tales como local harmonization, URI y local vocab. La tabla representa una guía para la indexación y presentación de metadatos.

Categorías que atraviesan colecciones

  • Tipos de contenido
    • Obras de Audio
    • Obras Cartográficas
    • Colecciones
    • Conjuntos de Datos
    • Imágenes en Movimiento
    • Objetos
    • Partituras y Notaciones
    • Software y Medios Electrónicos
    • Obras Textuales
    • Obras Visuales
  • Tipos de formato

Linked Art

Logo of Linked Art featuring a stylized graphic in the shape of a polygon with three peaks, possibly representing a range of data or network connections, set against a grid background. Beneath the polygon, the word LINKED ART appears in uppercase with a bold font in coral color.

A vision in search of a framework

  • The teams working on LUX needed to agree on a common framework.
  • When Rob Sanderson came to Yale, he presented two basic proposals:
    1. A new approach to Linked Data that emphasized usability.
    2. A metadata model (Linked Art) for representing cultural heritage information.

LOUD: Linked Open (Usable) Data

  • In 2016, Rob Sanderson and colleagues at the Getty Foundation proposed a new approach to linked data, known as LOUD (Linked Open Usable Data).
  • LOUD aims to make linked data easier for developers by designing for JSON documents instead of RDF triples.
Key Features
  • Privileges JSON-LD.
  • Emphasizes design patterns oriented towards web service APIs, instead of SPARQL queries.

Linked Art: implementing LOUD for the cultural heritage domain

  • Emerging standard for describing art and its cultural context.
  • Follows the principles of LOUD, applying them to the Conceptual Reference Model of the International Committee on Documentation (CIDOC-CRM).
  • Community effort with participation from institutions in North America and Europe.
  • Goes beyond art and art history, also covering the description of bibliographic and archival resources.

El programador como usuario

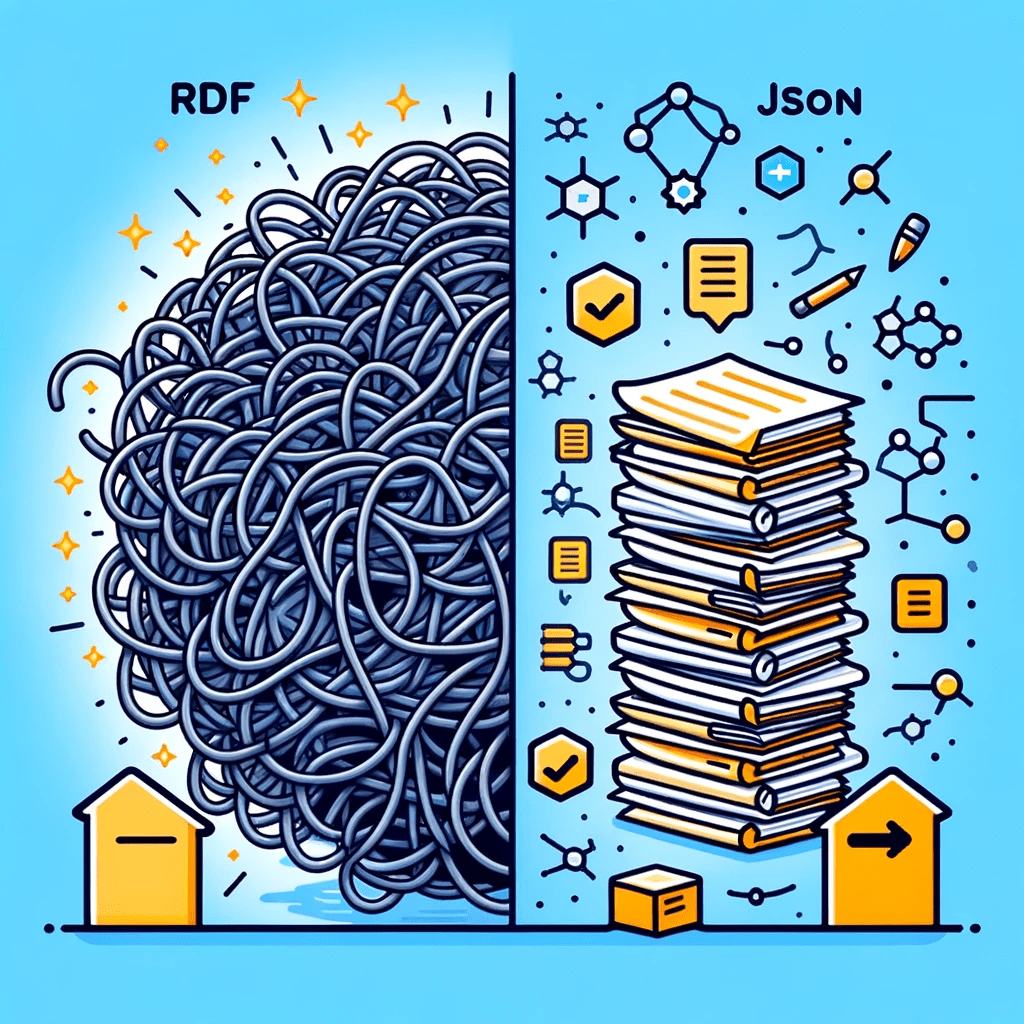
Imagen generada por DALL·E en ChatGPT 4.

Comparación visual entre RDF y JSON generada por DALL·E en ChatGPT 4. En el lado izquierdo, se muestra una gran maraña de cables sobre un fondo azul con la etiqueta RDF arriba, sugiriendo complejidad o confusión. En el lado derecho, contra un fondo azul similar, hay una pila ordenada de libros con la etiqueta "JSON" en la parte superior, indicando estructura y organización. Entre los libros y los cables, hay una línea divisoria. La parte de JSON también incluye íconos de verificación, diálogos, estructuras moleculares y casillas de selección, lo que implica funcionalidad y claridad.
{
  "id": "https://lux.collections.yale.edu/data/text/469c6229-0f5d-465b-8ef8-af90b1e94ad5",
  "type": "LinguisticObject",
  "about": [
    {
      "id": "https://lux.collections.yale.edu/data/concept/9a50d719-a171-4744-9d09-d554898278d6",
      "type": "Type",
      "_label": "Neruda, Pablo, 1904-1973 -- Fiction"
    },
    {
      "id": "https://lux.collections.yale.edu/data/concept/55b71204-b187-46f8-8840-4a96a3afe90f",
      "type": "Type",
      "_label": "Allende Gossens, Salvador, 1908-1973 -- Fiction"
    },
    {
      "id": "https://lux.collections.yale.edu/data/concept/c91ad346-ba28-4a54-ad03-f3c85866b55e",
      "type": "Type",
      "_label": "Chile -- Politics and government -- 1970-1973 -- Fiction"
    }
  ],
  "_label": "The Neruda case",
  "@context": "https://linked.art/ns/v1/linked-art.json",
  "language": [
    {
      "id": "https://lux.collections.yale.edu/data/concept/dfa53b96-4eda-4c9a-b091-10008a726c38",
      "type": "Language",
      "_label": "English"
    },
    {
      "id": "https://lux.collections.yale.edu/data/concept/9dc99a8c-fc3d-4f27-8ffb-a6e88883f64c",
      "type": "Language",
      "_label": "Spanish"
    }
  ],
  "used_for": [
    {
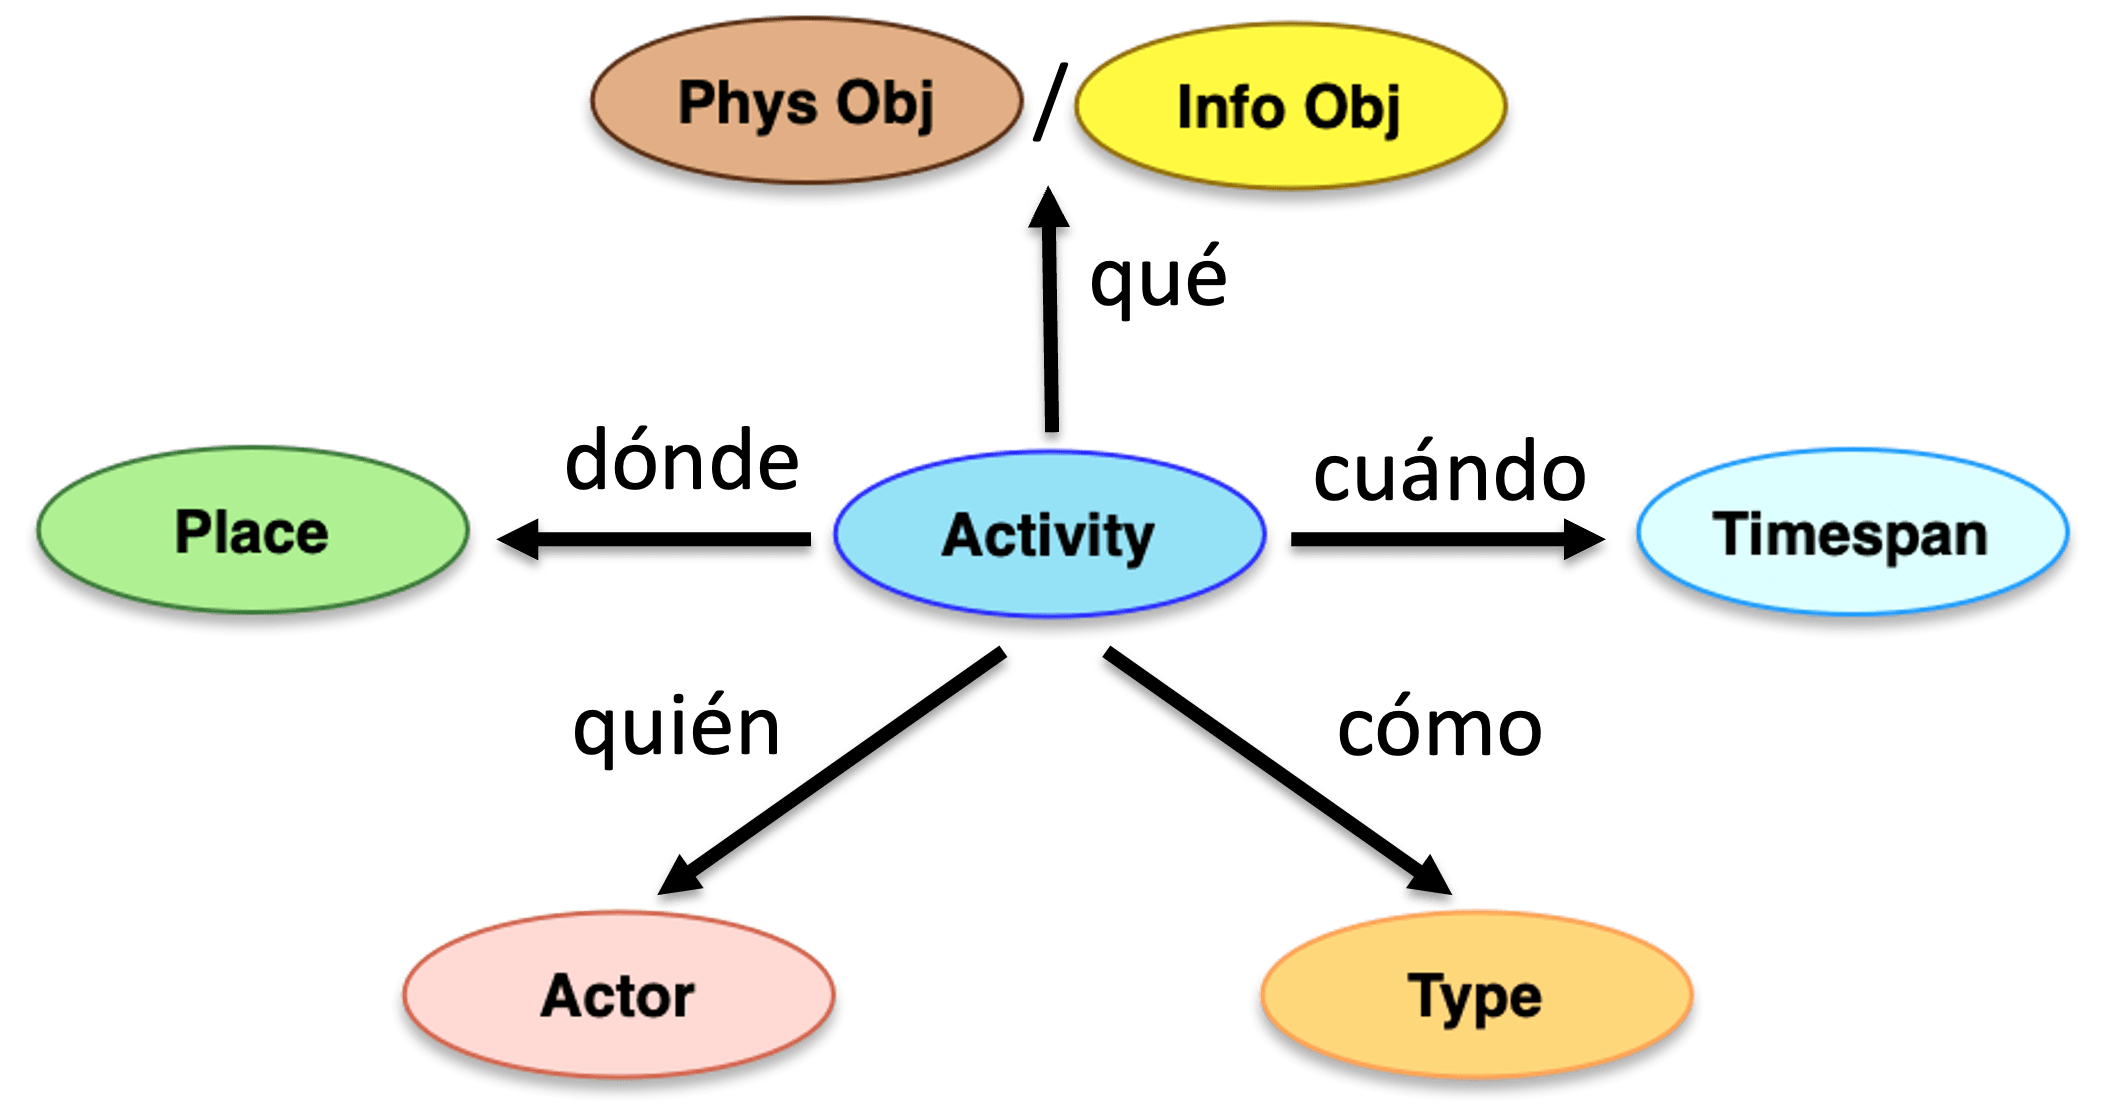
      "@type": "Activity",

El perfil de Linked Art (https://linked.art

Dominio
Patrimonio cultural, especialmente obras de arte
Modelo
CIDOC-CRM
Ontología
Codificación RDF de CRM 7.1, con algunas extensiones
Vocabulario
Tesauro de arte y arquitectura del Instituto Getty Research Institute, con algunas extensiones
Formato
JSON-LD con 10 fronteras documentales principales
Objetivo
Satisfacer 90% de los casos de uso con un 10% de esfuerzo

Arquitectura informacional de Linked Art

Diagrama del enfoque de alto nivel adoptado por el estándar Linked Art, que muestra las relaciones entre Modelo, Ontología, Vocabulario, Perfil y API.

Linked Art and LUX

  • At Yale, the LUX platform was created using Linked Art as its lingua franca.
  • LUX provides integrated access to Yales collections, including museums, libraries, and archives.
A conceptual model diagram with seven oval nodes connected by lines to a central oval node labeled Activity in blue. Starting from the top and moving clockwise, the connected nodes are labeled Phys Obj in brown, Info Obj in yellow, Timespan in blue, Type in orange, Actor in pink, and Place in green. Arrows on the connecting lines indicate directional relationships between Activity and the other nodes. The background is black, highlighting the color-coded nodes for physical objects, informational objects, timespan, types, actors, and places, all related to the concept of Activity.

Metadata transformations

From these...

Displays logos and graphics of different metadata standards used in the cataloging and description of collections and cultural heritage. At the top, the logo of EAD (Encoded Archival Description) is seen, followed by the logo of MARC 21 (Machine-Readable Cataloging). In the center, an image of Charles Darwin represents the Darwin Core, a standard for biodiversity information. To the right is the logo of LIDO (Lightweight Information Describing Objects), focused on the description of museum objects. At the bottom, there is a banner that says Categories for the Description of Works of Art indicating a standard for describing, cataloging, and linking works of art, architecture, and cultural heritage, accompanied by thumbnail images of different types of art and architecture. The image visually communicates the variety of standards employed to organize and present data across different domains of knowledge.

Metadata transformations

Conceptual diagram illustrating the relationships between various concepts in the context of metadata for artworks and culture. In the center, the concept of Creation acts as the main node and is connected to Textual Work, Visual Work, Actor, TimeSpan, and Place. Creation is linked to Actor through created by and to TimeSpan through timespan. Actor is broken down into subcategories like Gender/Ethnicity. Visual Work is connected to Digital Content and Physical Object, indicating the different forms a visual work can take. Textual Work is linked to Concept and Place. The diagram uses colors to differentiate types of concepts and arrows to denote semantic relationships, providing a logical structure to understand how data are related in a linked knowledge environment.

To this!

Domain ownership of data

Credit: Robert Sanderson.

Flowchart detailing a data management process. In the central part, there is a cylinder labeled as Unit System of Record representing the main database of the unit. There are several rectangles representing different components of the process: Activity Stream Entry, Activity Stream Page, and Unit Entity Rec. A diamond labeled Write AS, Rec indicates a write action toward the Activity Stream Entry. To the right, there is a legend that associates acronyms of different Yale units with their respective record systems: YCBA with TMS, YUAG with TMS, YPM with EMu, YUL with Voyager and ASpace, and mentions Overlay Data & future. The diagram reflects a workflow structure for updating and maintaining records in an information system, in a library context or collection management.

Linked Art versus BIBFRAME

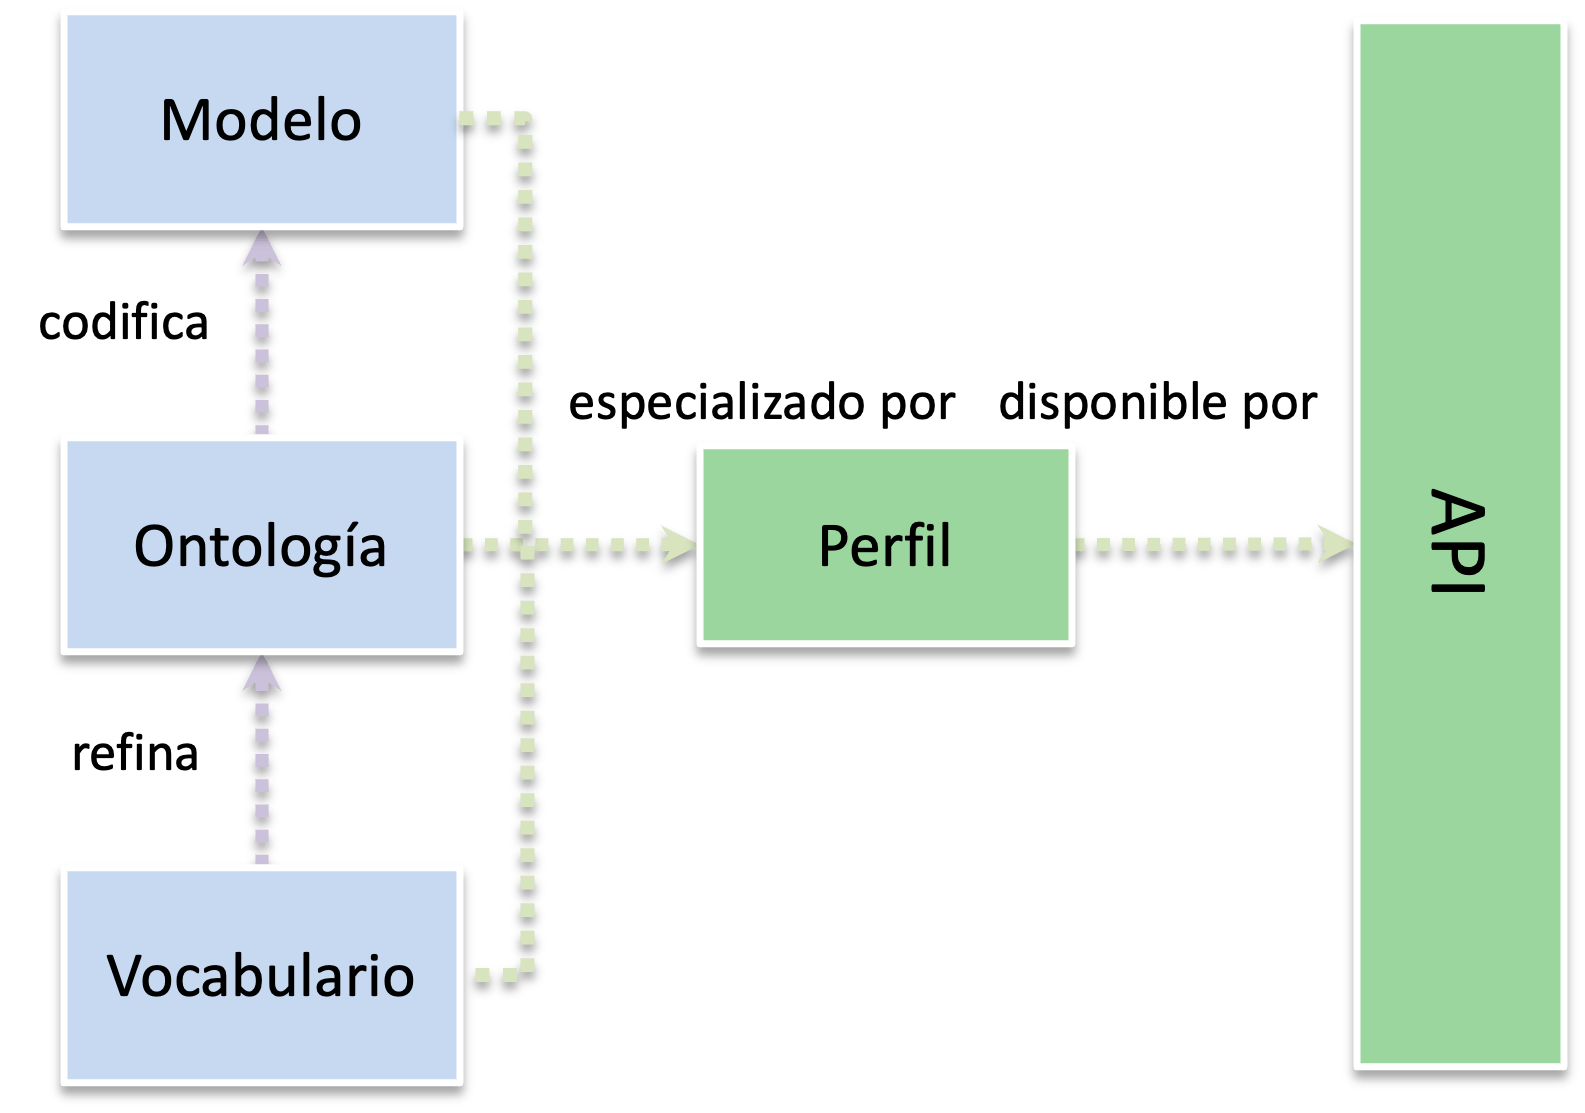
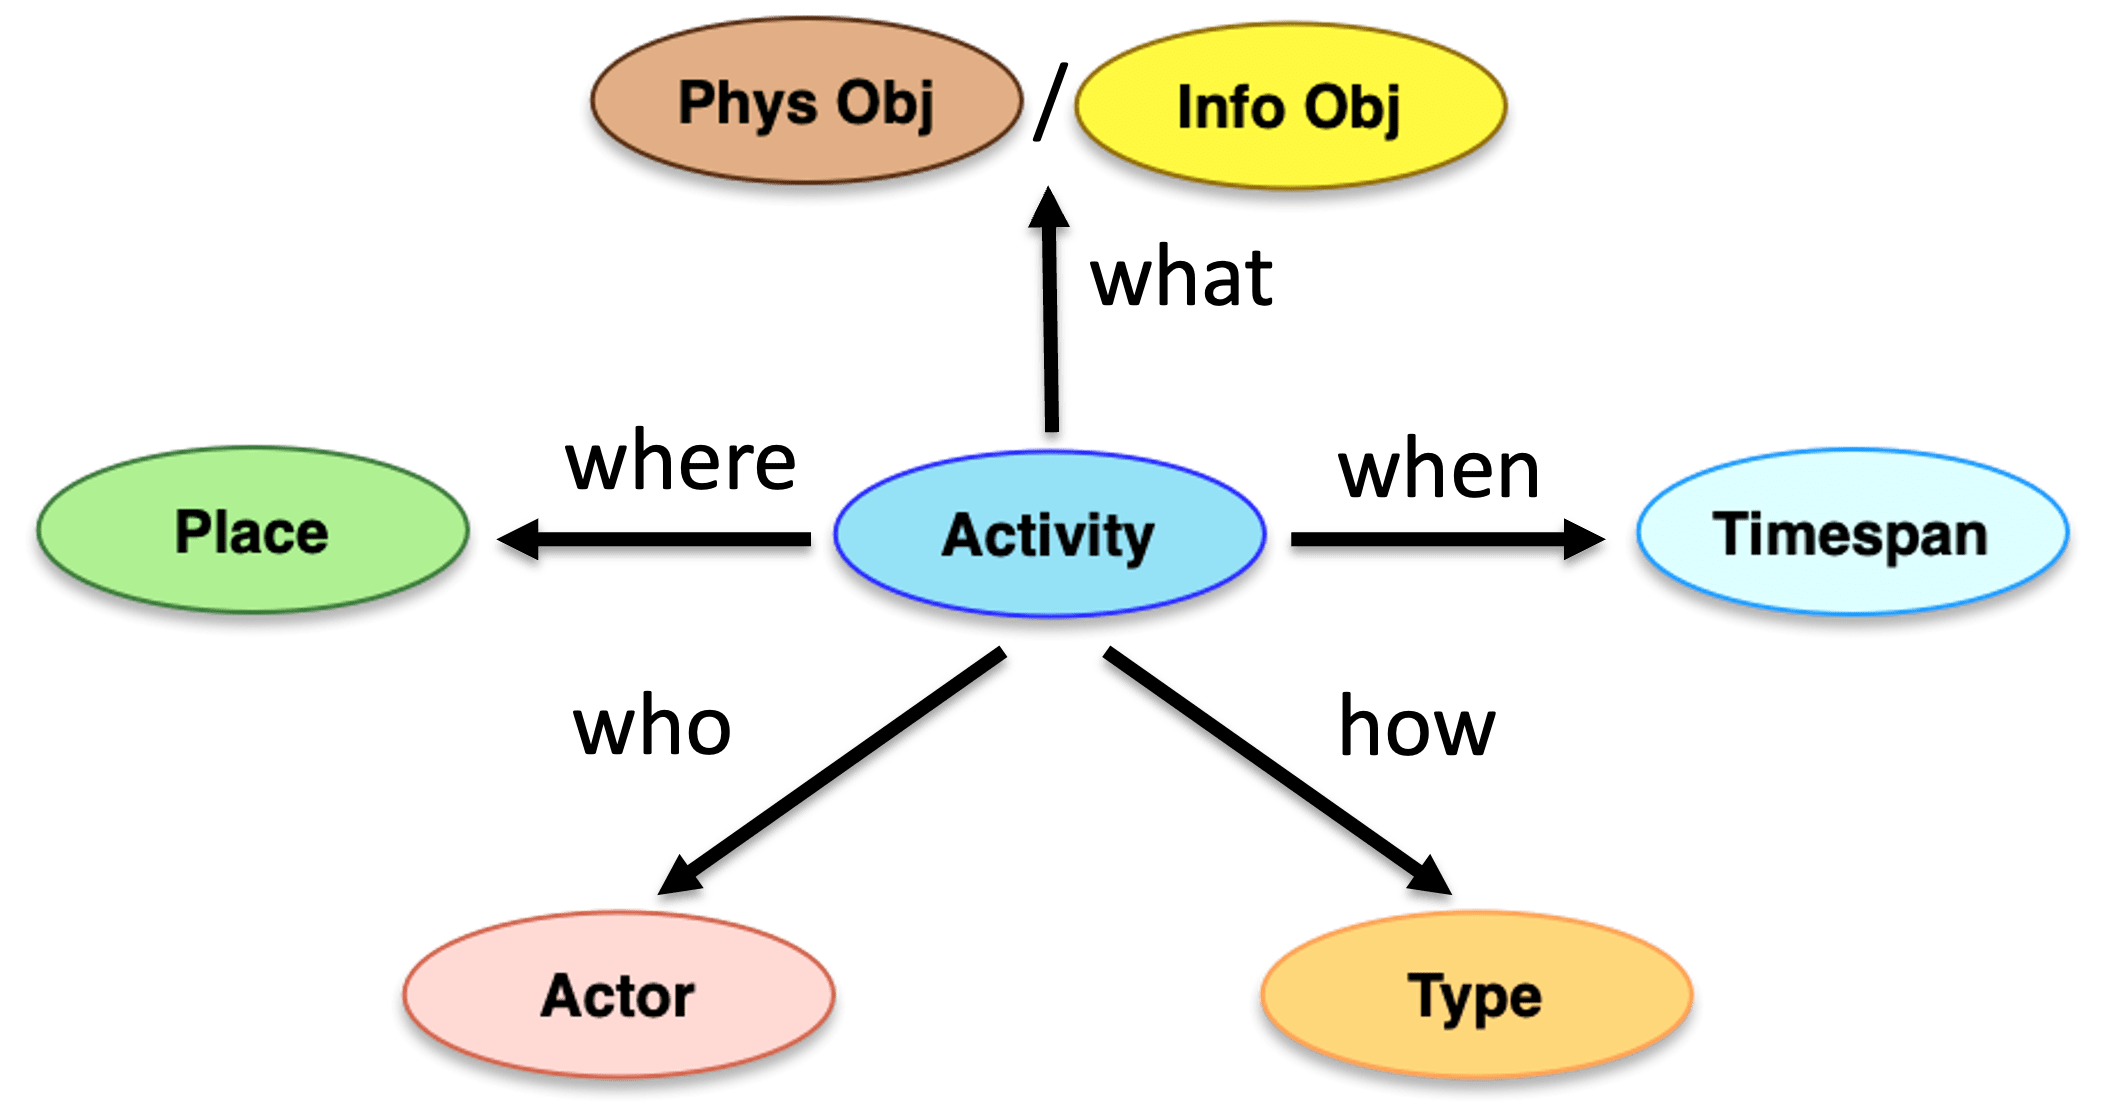
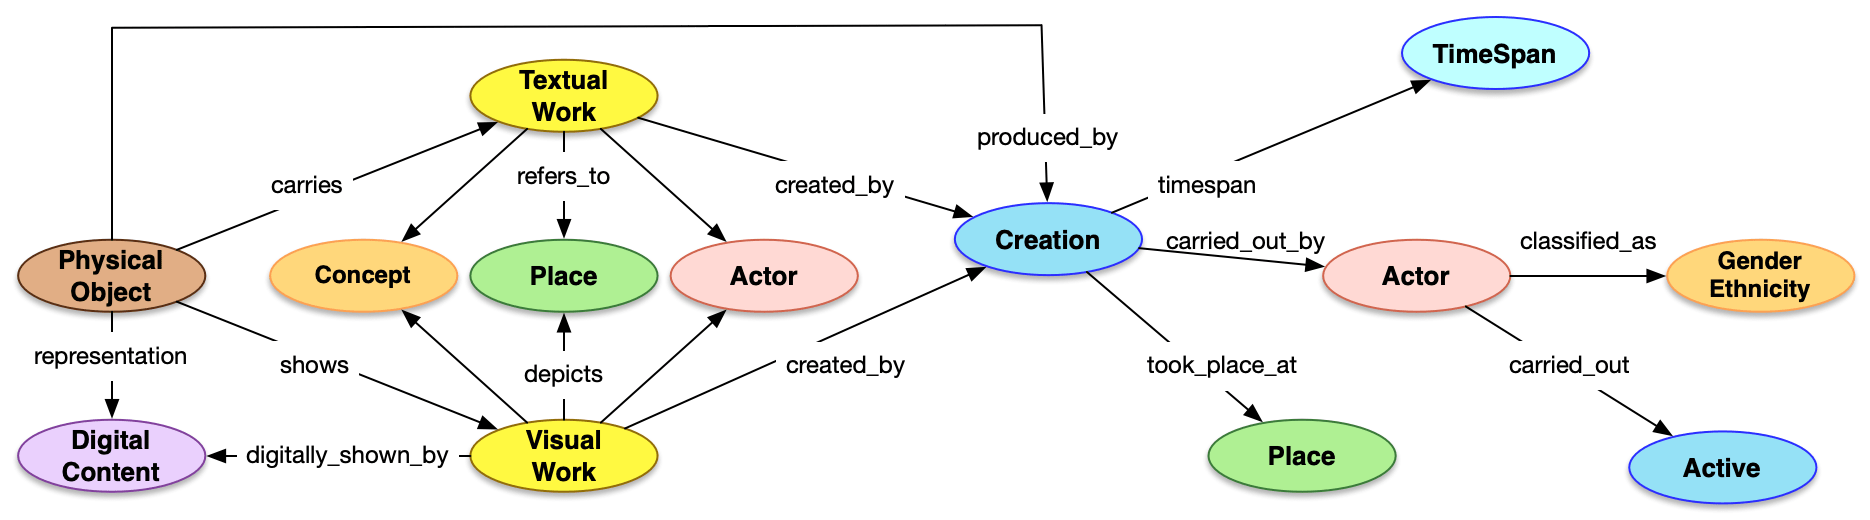
Why did we choose Linked Art as the model for LUX instead of BIBFRAME?

  1. For practical reasons. Linked Art helped us create more balance between the library and the museums.
  2. For methodological reasons. Linked Art was seen as a better fit for developing a linked data discovery platform.

Data about LUX

  • Approximately 41 million entities (as JSON-LD).
  • Approximately 2.5 billion triples.
  • Complete library catalog (12.2 million MARC records; includes e-books, but not articles).
  • Data reconciliation and enrichment from
    • Getty: AAT, ULAN, TGN
    • Library of Congress: LCSH, LCNAF, Vocabularies
    • OCLC: FAST, VIAF
    • Wikidata.
  • Records mapped by contributing units and then enriched through the LUX pipeline.

Change travels at the speed of LUX

  • New organizational structures to support LUX as a production service.
    • CHIT Data Working Group
    • Library Linked Data Advisory Group
  • Impetus for data remediation and exploration of new technologies, including AI.
This is a screenshot of a spreadsheet that lists geographical entities with corresponding URIs and normalized names. Each row represents an entity with five columns: Child URI (the entity's unique resource identifier), Child Name (the common name of the entity), Child Norm (a normalized or standardized version of the entity's name), Parent URI (the unique resource identifier of the entity's parent location), and Parent Name (the common name of the parent location). The entries include a variety of places, such as counties, cities, and countries, with the names written in lowercase. The data seems to be part of a larger database or system, likely used for organizing and linking information in a digital or cultural heritage context.

LUX: System Demo

Thank you!

Questions? Comments?

Tim Thompson

Modelos conceptuales

  • ¿Qué tan diferentes son los modelos conceptuales de las bibliotecas, los museos y los archivos?
  • Para los desarrolladores de la ontología Registros en Contexto (RiC-O, por sus siglas en inglés), que representa el ámbito archivístico:
    Son muy diferentes. Los conceptos semánticos para cosas muy básicas como "persona", "título", "autor" o "procedencia" difieren enormemente entre estas comunidades, incluso si los términos son compartidos entre ellas.

¿Qué opinan ustedes?

Diferencias entre Linked Art y BIBFRAME

  • Linked Art se enfoca en publicar datos enlazados en la web.
  • Permite la clasificación de entidades usando vocabularios controlados.

Clasificaciones en Linked Art

  • En Linked Art, se utiliza la propiedad 
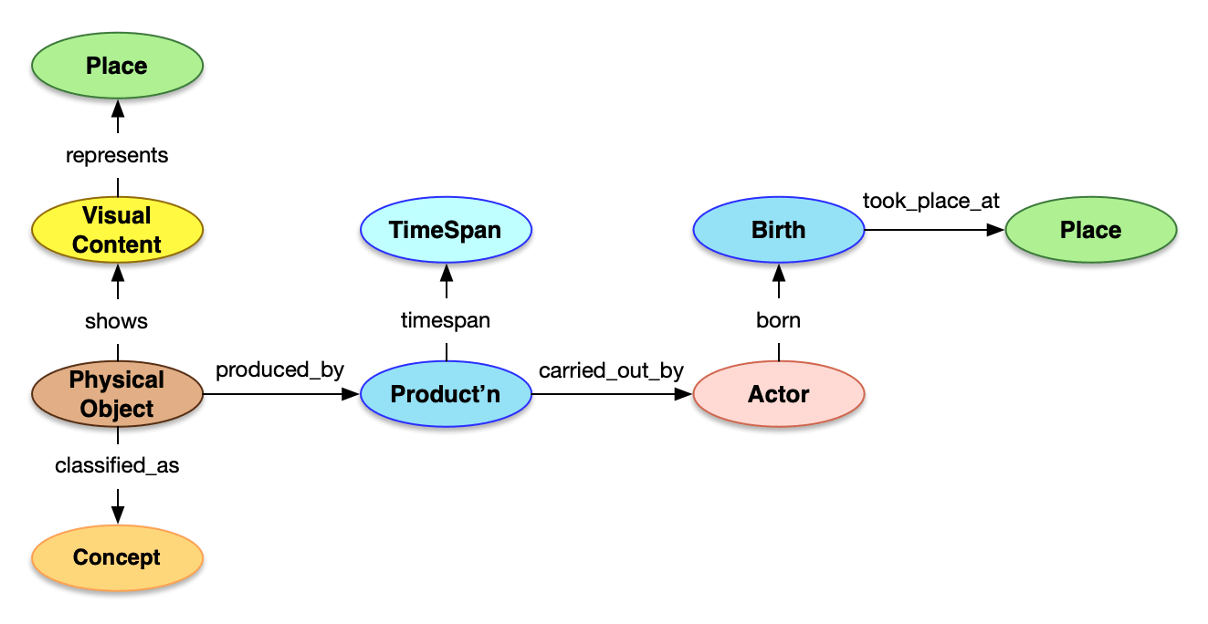
classified_as, o clasificado como, para asignar tipos más específicos de clases genéricas.
  • Se puede también crear meta-clasificaciones de otras clasificaciones.
  • En BIBFRAME, por otro lado, todas las subclases de Obra, por ejemplo, ya están enumeradas en la ontología.
 
Gráfico de nodos y conexiones que representan la estructura de clasificación de objetos dentro de una base de datos de Linked Art. En el centro, hay un HumanMadeObject en forma de elipse y color ámbar. Desde este nodo, se extienden relaciones a otros nodos: un VisualItem en forma de caja y color rojo pálido, con la etiqueta Portrait of Lynette Yiadom-Boakye, Jacob Morland of Capplethwaite, que indica lo que el objeto muestra; y varios nodos de Type, cada uno en forma de elipse y color azul claro, que clasifican el objeto como Paintings, Type of Work, Visual Works, y Super Type. Cada conexión está etiquetada para mostrar la relación entre los nodos, como shows y classified_as. Los colores y formas de los nodos ayudan a diferenciar las categorías de entidades en la visualización.

Linked Art: modelo conceptual a grandes rasgos

Diagrama de conceptos clave utilizados en la modelización de datos para el arte y la cultura. Los conceptos están representados por óvalos de colores con las palabras Place, Activity, Timespan, Actor, Type, Phys Obj para objeto físico e Info Obj para objeto de información. Estos términos están distribuidos en un fondo negro, posiblemente representando cómo interactúan en un modelo de datos o en un grafo de conocimiento. El diagrama es un ejemplo simplificado de cómo se pueden conectar los datos en el campo del patrimonio cultural para mejorar la búsqueda y el descubrimiento de información.

LUX: ¿cómo funciona?

Pipeline de datos

Diagrama de flujo complejo que representa la infraestructura de datos de la plataforma LUX. En la parte superior del diagrama, hay un Unit System of Record que se relaciona con varios sistemas como YCBA: TMS, YUAG: TMS, YPM: EMu, entre otros. El proceso comienza con la escritura en el Activity Stream Entry y fluye a través de diferentes caches y acciones como Harvest Recs, Fixes, y Reconcile. Se integran datos de autoridades externas como Getty: AAT, ULAN y TGN, y LC: LCSH, entre otros. El diagrama también muestra procesos de reconciliación de identificadores, fusión de datos, y exportación hacia formatos como JSON y bases de datos como MarkLogic. Las diferentes fases están conectadas por líneas que indican el flujo de datos a través de la red y de diferentes procesos como Load Data, Map to Model, y Export. El diagrama refleja un proceso técnico de integración y gestión de datos en una arquitectura de sistemas interconectados.

Crédito por el contenido: Robert Sanderson.

Enfoque en estándares

  • Énfasis en la interoperabilidad y código abierto donde fuera posible.
  • Linked Art, Activity Streams, JSON-LD, IIIF.
  • Tecnologías comunes (ReactJS, Python, Drupal).
  • Calidad empresarial y fiabilidad.
  • MarkLogic como base de datos.

5 tipos de entidades principales

Objeto Fabricado por el Ser Humano (HumanMadeObject)
Objeto físico que se puede tocar.
Objeto Lingüístico (LinguisticObject)
Contenido en lenguaje humano que se puede leer o escuchar.
Elemento Visual (VisualItem)
Contenido con una apariencia identificada que se puede ver.
Objeto Digital (DigitalObject)
Cosa digital que existe en una computadora.
Conjunto (Set)
Agrupamiento identificable de cero o más entidades.

5 tipos de entidades conectadas

Persona (Person)
Ser humano, vivo o fallecido.
Grupo (Group)
Una o más personas, u otros grupos, que actúan colectivamente.
Lugar (Place)
Extensión geoespacial, descriptible con coordenadas.
Concepto (Type)
Cosa conceptual, a menudo utilizada para caracterizar o clasificar.
Evento/Actividad (Event/Activity)
Evento o actividad que ocurrió en algún momento en el tiempo.

Modelo

Modelo de datos conceptual con varios nodos y relaciones. Los nodos son Place, Visual Content, Physical Object, Concept, TimeSpan, Product'n, Birth, y Actor. Cada nodo está conectado por flechas que representan relaciones como represents, shows, classified_as, produced_by, timespan, carried_out_by, took_place_at y born. Place está vinculado a Visual Content y a Birth, mientras que Physical Object está conectado a Visual Content y Concept. TimeSpan se relaciona con Product'n, que a su vez está conectado a Actor. Actor también está conectado a Birth. El diagrama visualiza cómo se interrelacionan diferentes entidades en un sistema de gestión de información.

Persona/Grupo

Lugar

Lugar

Período de Tiempo

Obra

Objeto

Concepto

Actividad

Evento

Valores a partir de datos

Diagrama de relaciones entre varios conceptos relacionados con una obra de arte. Yosemite está conectado a image a través de la relación represents. Image está vinculado a yuag: 1931.389 con la relación shows, y este último está clasificado como painting. En otra parte del diagrama, ca. 1873 está conectado a Product'n con la relación timespan y Product'n está relacionado con Bierstadt a través de carried_out_by, quien a su vez nació en Germany como indica la relación took_place_at desde Birth. El diagrama visualiza la conexión entre el lugar, la imagen visual, el objeto físico (con su identificador en la galería de arte), la categoría de la obra, el tiempo de producción, el creador y su lugar de nacimiento.

Conciliación de datos entre entidades

Esquema de relaciones entre diversos conceptos en un sistema de gestión de información cultural. Se incluye tgn:7017628 que representa a image, la cual muestra yuag:1931.389 clasificado como http://lux/painting. En otra secuencia, ca. 1873 está conectado a Product'n, que a su vez fue llevado a cabo por ulan:1248. Además, Birth que tuvo lugar en tgn:7000084 está conectado a ulan:1248. Cada uno de estos identificadores prefijados (tgn, yuag, ulan) apunta a sistemas de identificación únicos utilizados para catalogar y referenciar entidades en bases de datos especializadas. El esquema muestra cómo las entidades digitales se vinculan a través de metadatos normalizados en un entorno de datos conectados.

Datos enriquecidos

Diagrama que ilustra las relaciones entre varios conceptos y entidades en un sistema de gestión de información cultural. tgn:7017628, que es parte de California, representa a image, que a su vez muestra yuag:1931.389, clasificado como http://lux/painting. A la derecha, el diagrama indica que ulan:1248 fue clasificado como male y nació en 1830, con su nacimiento teniendo lugar en Europe, que es parte de tgn:7000084. Ca. 1873 es el periodo de tiempo durante el cual Product'n fue producido por ulan:1248. Este esquema muestra cómo se conectan las entidades como lugar, imagen, objeto físico, y persona dentro de una infraestructura de datos para representar información detallada sobre una obra de arte y su creador.

Al final, ¿por qué?

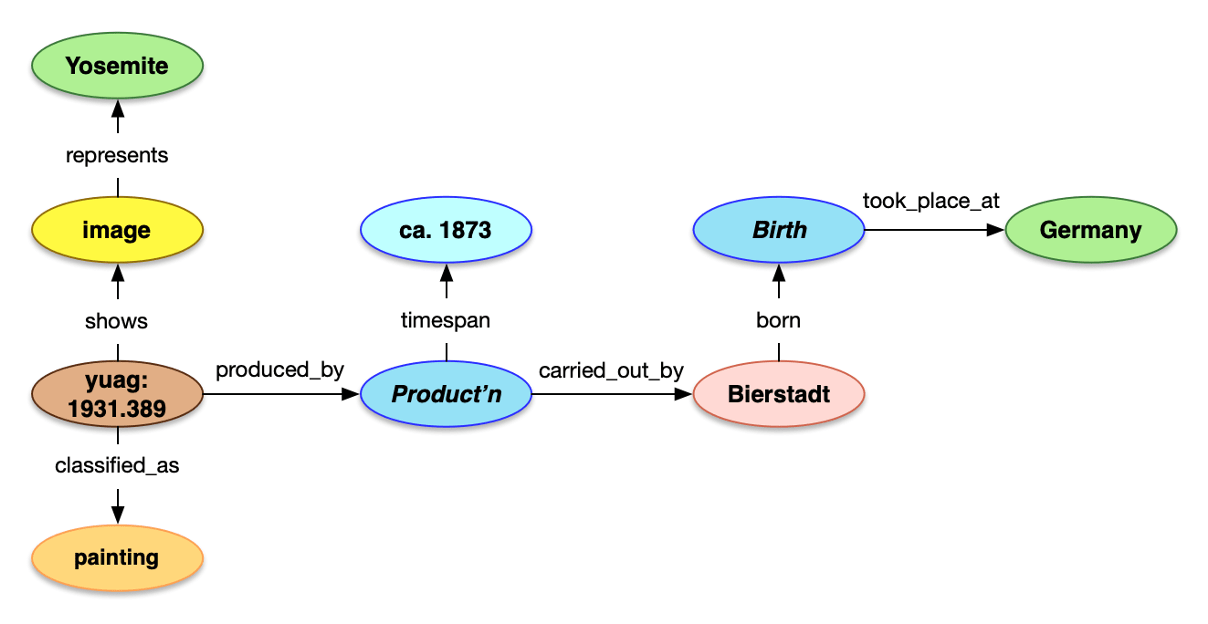
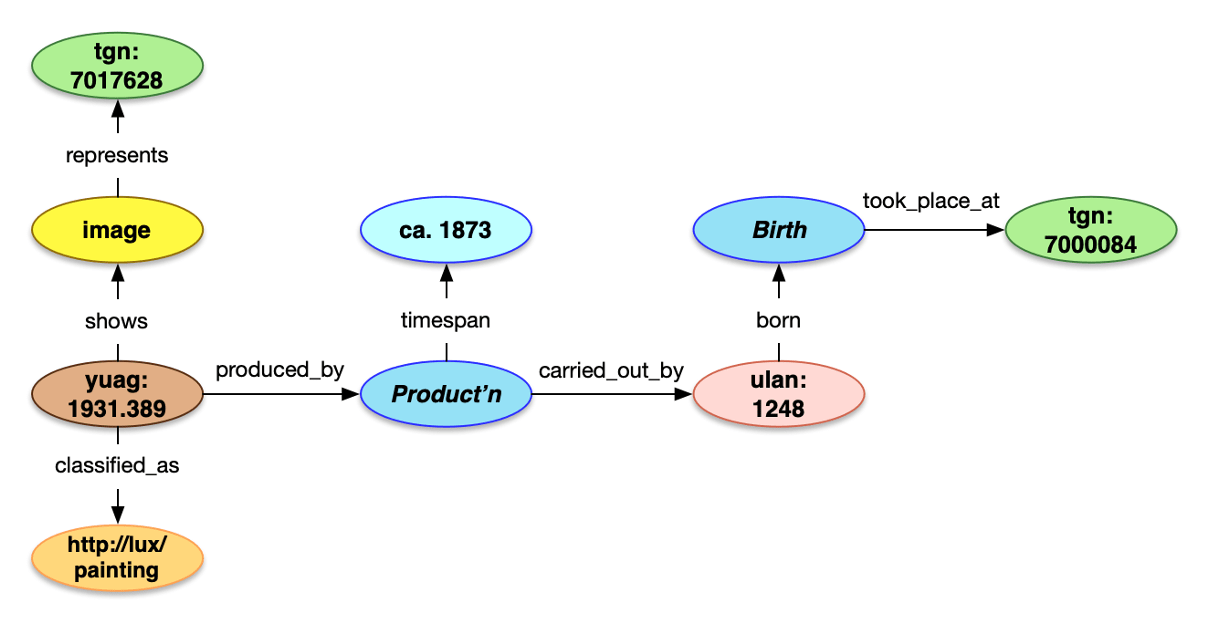
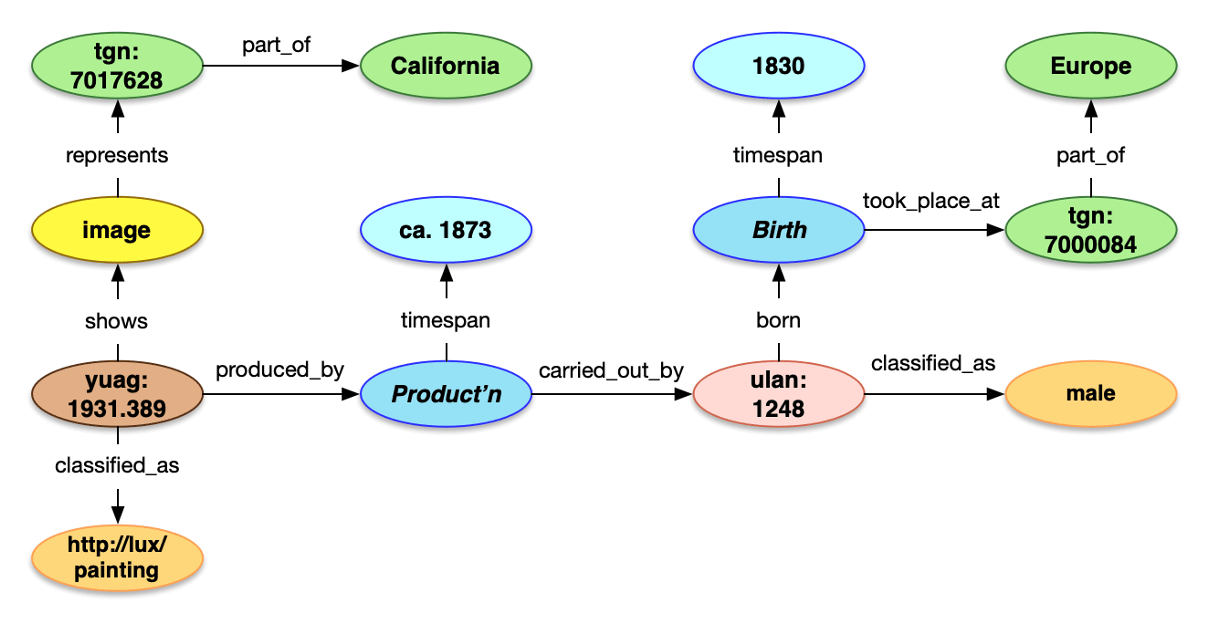
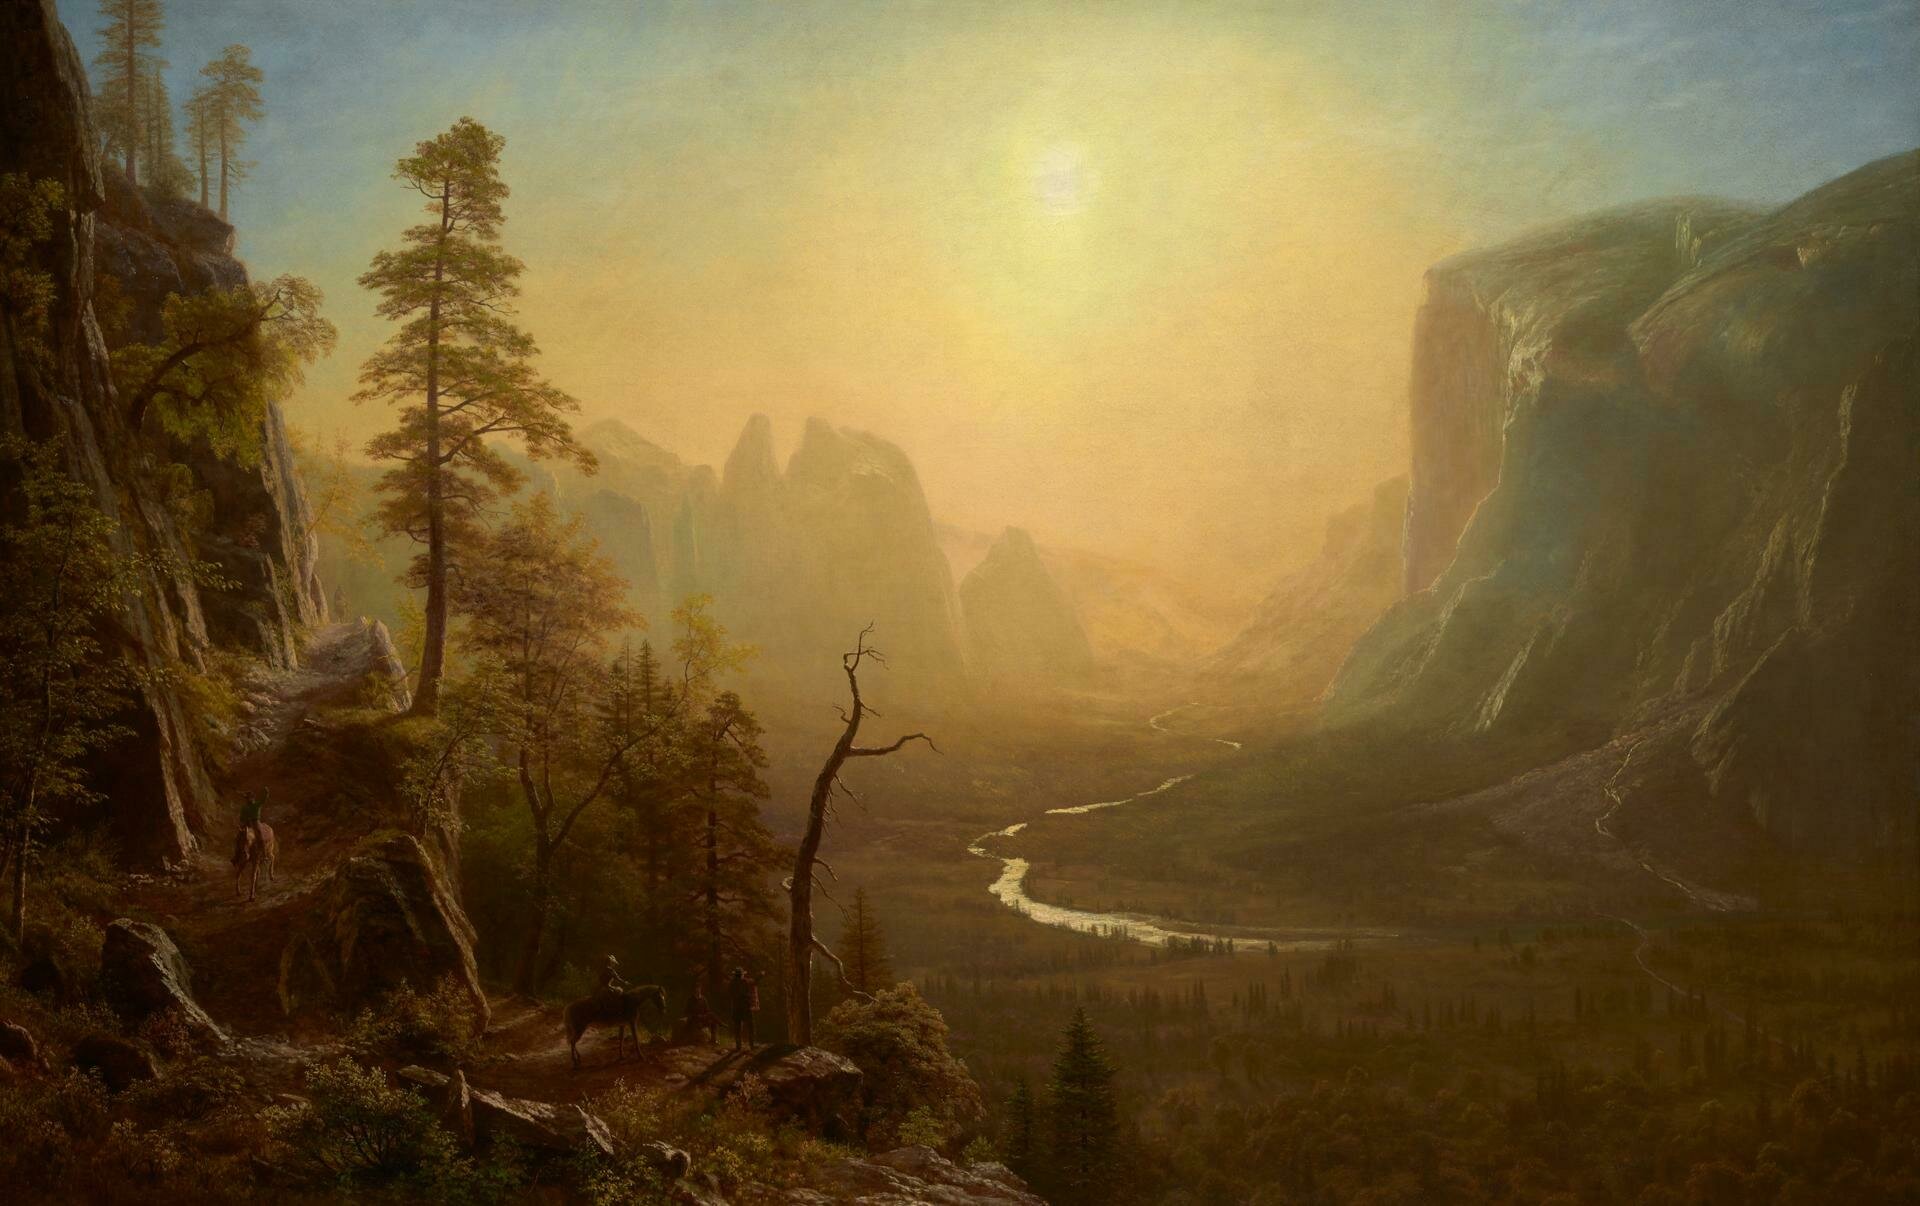
¿Cómo pintaron los artistas europeos el Oeste Norteamericano durante el siglo XIX?

Yosemite Valley, Glacier Point Trail, Albert Bierstadt, 1873, Yale University Art Gallery

Pintura del artista Albert Bierstadt que captura la majestuosidad del paisaje del Oeste americano, probablemente una representación del Parque Nacional de Yosemite. La luz del sol filtra a través de un cielo brumoso, iluminando las montañas y valles con una calidad etérea. La obra de arte está imbuida con un sentido de la sublime grandeza de la naturaleza, una característica distintiva del estilo de Bierstadt y de la escuela del paisajismo americano conocida como Hudson River School. La composición incluye detalles minuciosos de la flora y la fauna, así como figuras humanas que proporcionan escala y una sensación de la presencia humana en el vasto entorno natural.

Búsqueda simple

Búsqueda avanzada

{
  "AND": [
    {"hasDigitalImage": 1}, Objeto
    {
      "carries": {  Obra
        "aboutPlace": {"name": "chile"}  Lugar
      }
    }
  ]
}

¿Qué hay de Chile en LUX?

¿Qué hay de Chile en LUX?

Though the Galápagos are often cited as the most important source of his ideas, Darwin's time in Chile was as influentialif not more.

Patience Schell

Using linked open data to build a culture of collaboration at Yale University

By Tim Thompson

Using linked open data to build a culture of collaboration at Yale University

Learn about the challenges, goals, and vision for connecting cultural heritage collections. Discover how LOUD and Linked Art are transforming the cultural heritage domain.

  • 42