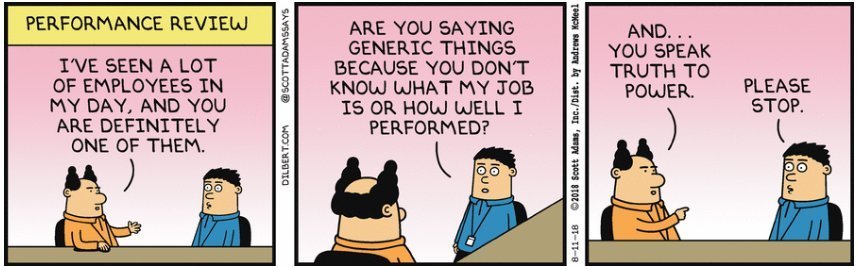
Impress Your Boss with Interactive Visualizations

Right here

Impress Your Boss with Interactive Visualizations
Impressive
Interactive Visualizations
Agenda
- Describe the talk
- Apologize for not using React (Sorry)
- "Things you need to impress your boss"
- Tools, Code Samples, and Demos
- Jupyter
- Streamlit
- SVG / d3.js
- ObservableHQ
- How to / how not to design a visualization
"... Includes Python Notebooks, d3.js, and straight React SVG. ..."
-- Tim, 2019
Things you'll need
- Story to tell
- Data
- Tooling
- "Visual intuition"
Things you'll need
- Story to tell
- Data
- Tooling
- "Visual intuition"

Things you'll need
- Story to tell
- Data
- Tooling
- "Visual intuition"
[
    {
        "name": "Calibrate the Kubernetes Cluster",
        "points": 2,
        "owner": "Heather",
        "iterationStartDate": "2019-07-08",
        "workStartDate": "2019-07-10",
        "finishDate": "2019-07-10"
    },
    {
        "name": "Reimplement the Cache",
        "points": 5,
        "owner": "Eli",
        "iterationStartDate": "2019-07-08",
        "workStartDate": "2019-07-09",
        "finishDate": "2019-07-16"
    },
    {
        "name": "Restore the Secret Store",
        "points": 5,
        "owner": "Heather",
        "iterationStartDate": "2019-07-08",
        "workStartDate": "2019-07-08",
        "finishDate": "2019-07-10"
    },
    {
        "name": "Calibrate the Feature Flag for B",
        "points": 3,
        "owner": "Heather",
        "iterationStartDate": "2019-07-08",
        "workStartDate": "2019-07-08",
        "finishDate": "2019-07-08"
    },
    {
        "name": "Address the Mongo Backend",
        "points": 21,
        "owner": "Eli",
        "iterationStartDate": "2019-07-08",
        "workStartDate": "2019-07-08",
        "finishDate": "2019-07-31"
    },
    {
        "name": "Fix the Azure Configuration",
        "points": 2,
        "owner": "Sam",
        "iterationStartDate": "2019-07-08",
        "workStartDate": "2019-07-08",
        "finishDate": "2019-07-09"
    }
]
Things you'll need
- Story to tell
- Data
- Tooling
- "Visual intuition"
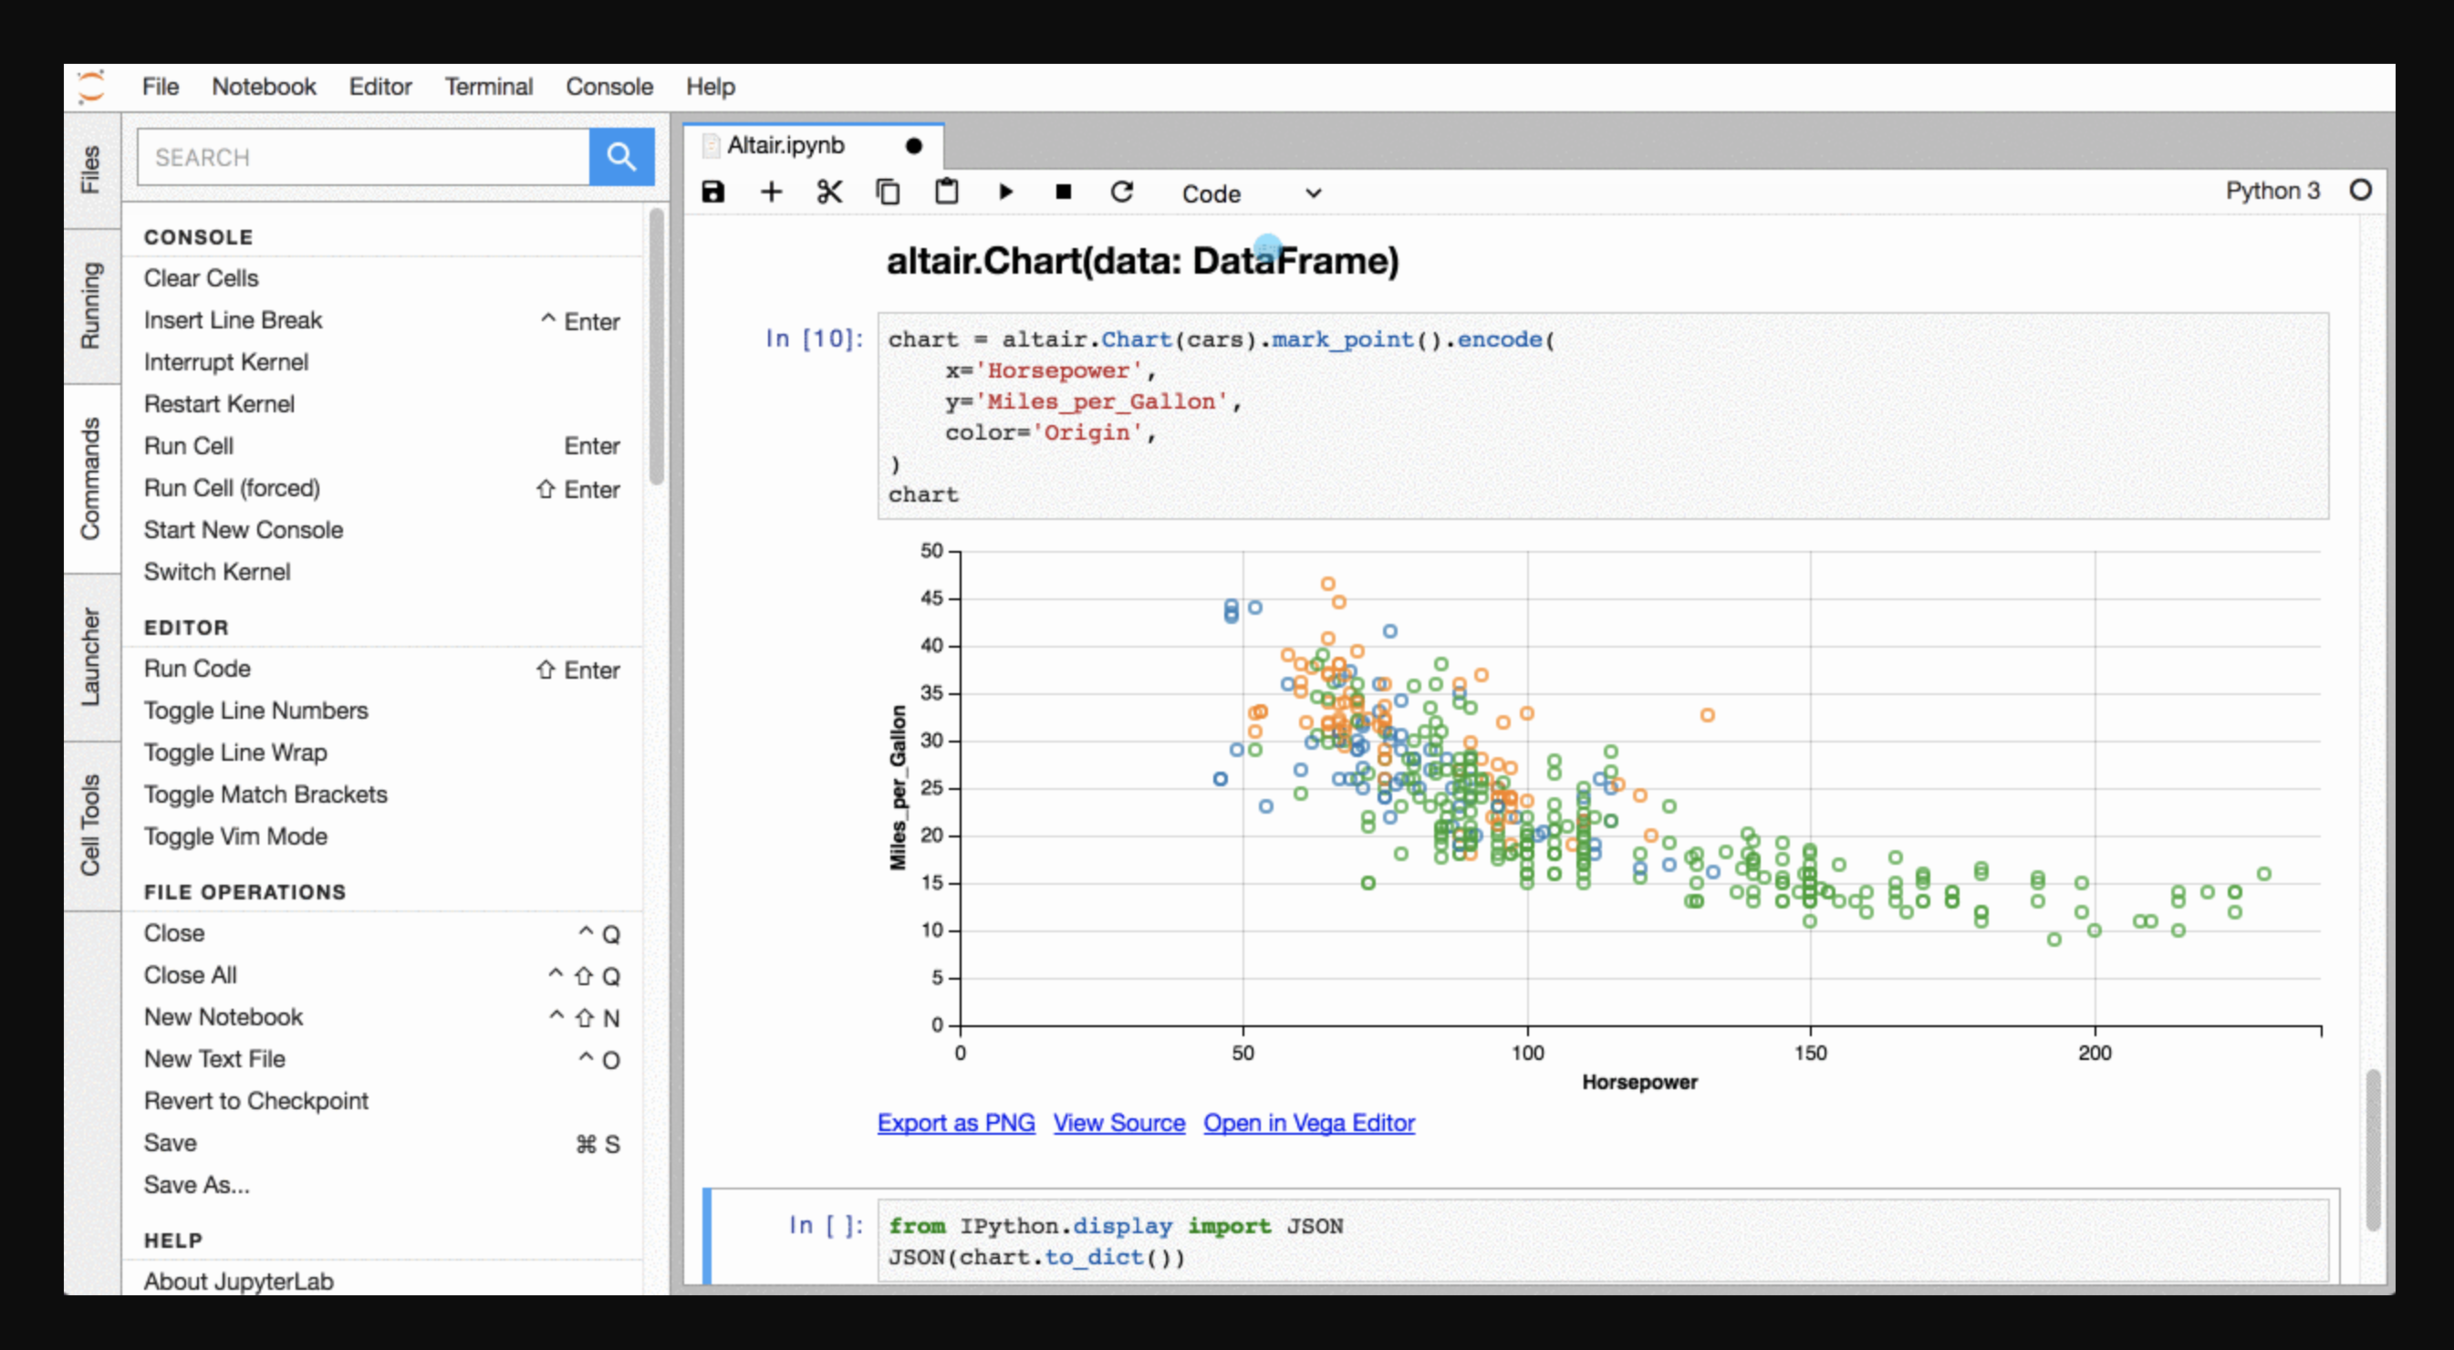
Jupyter
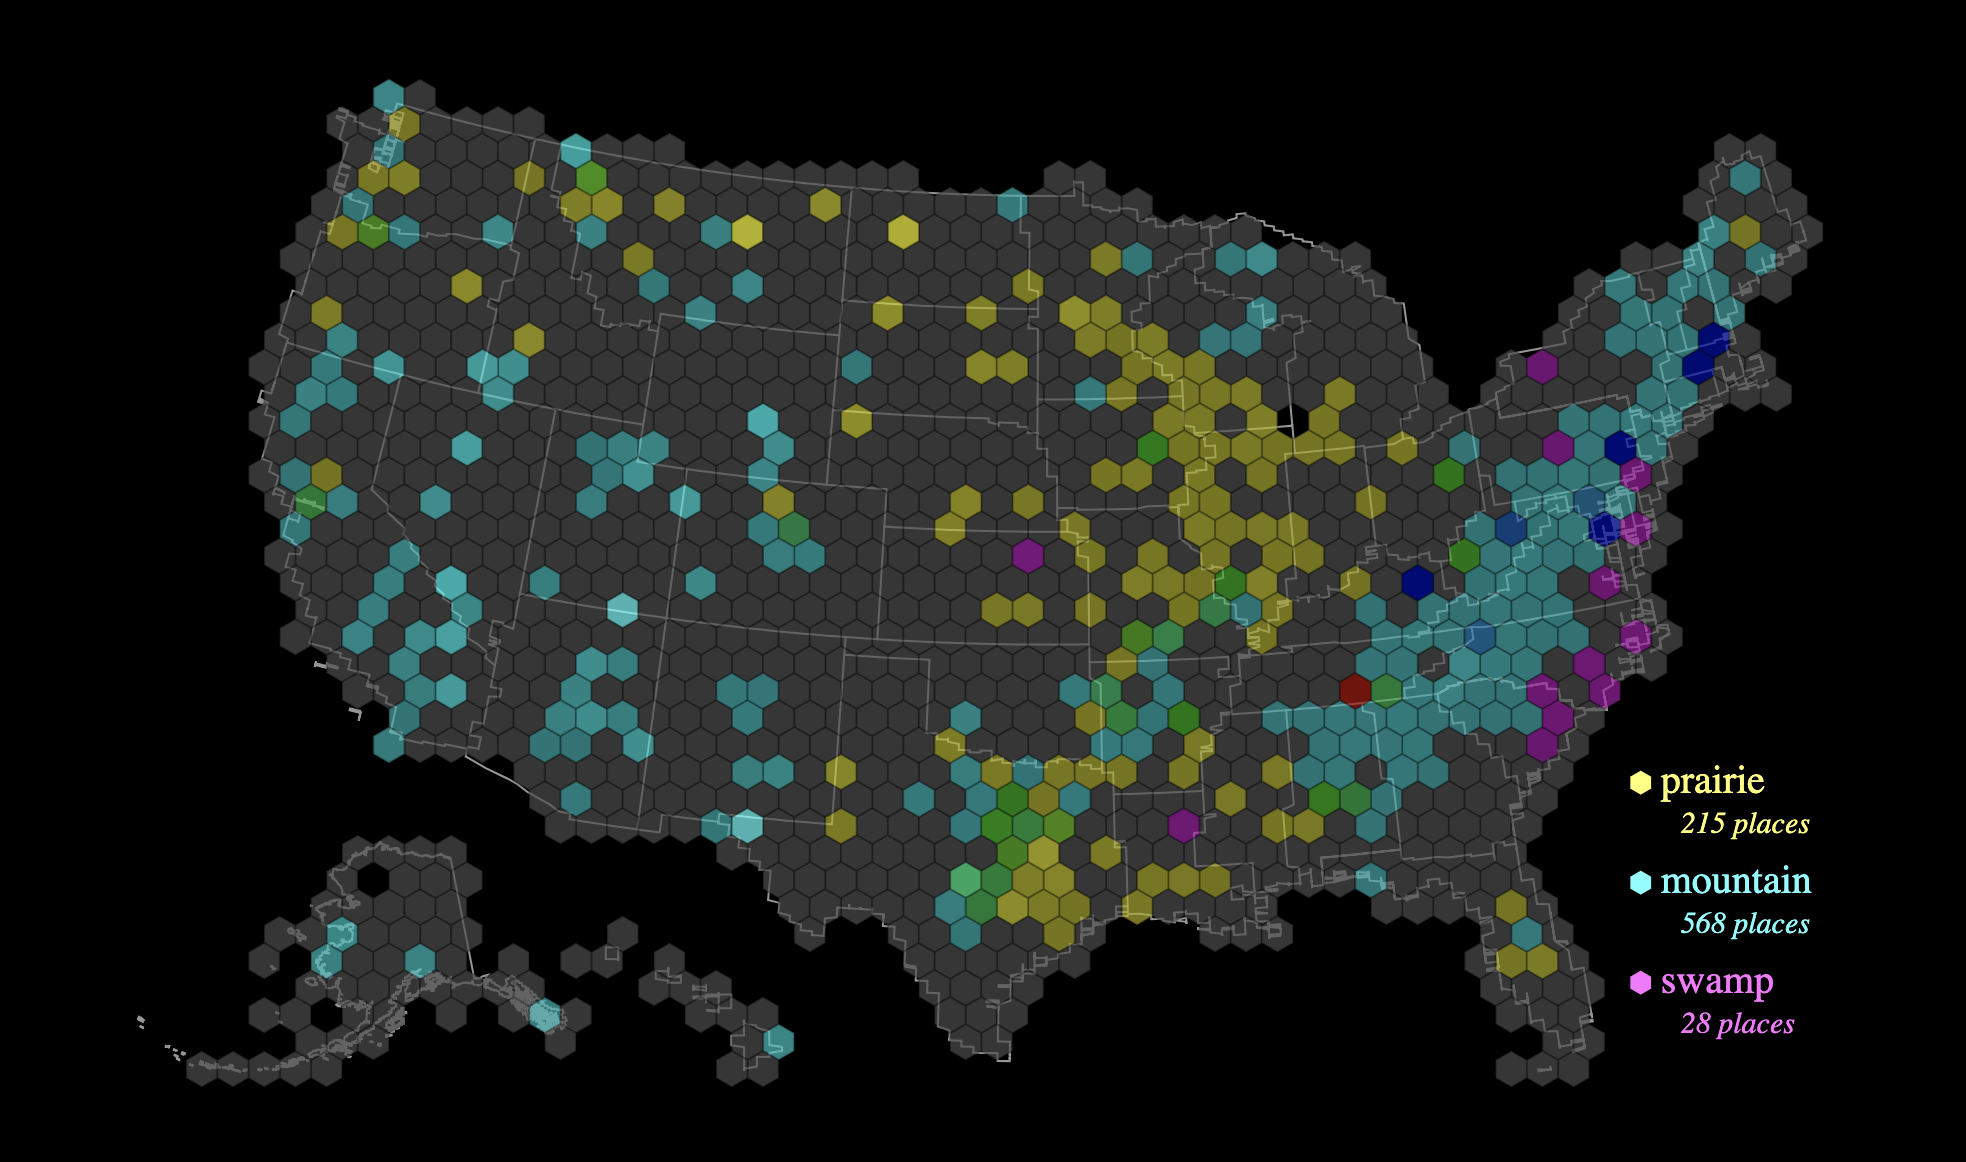
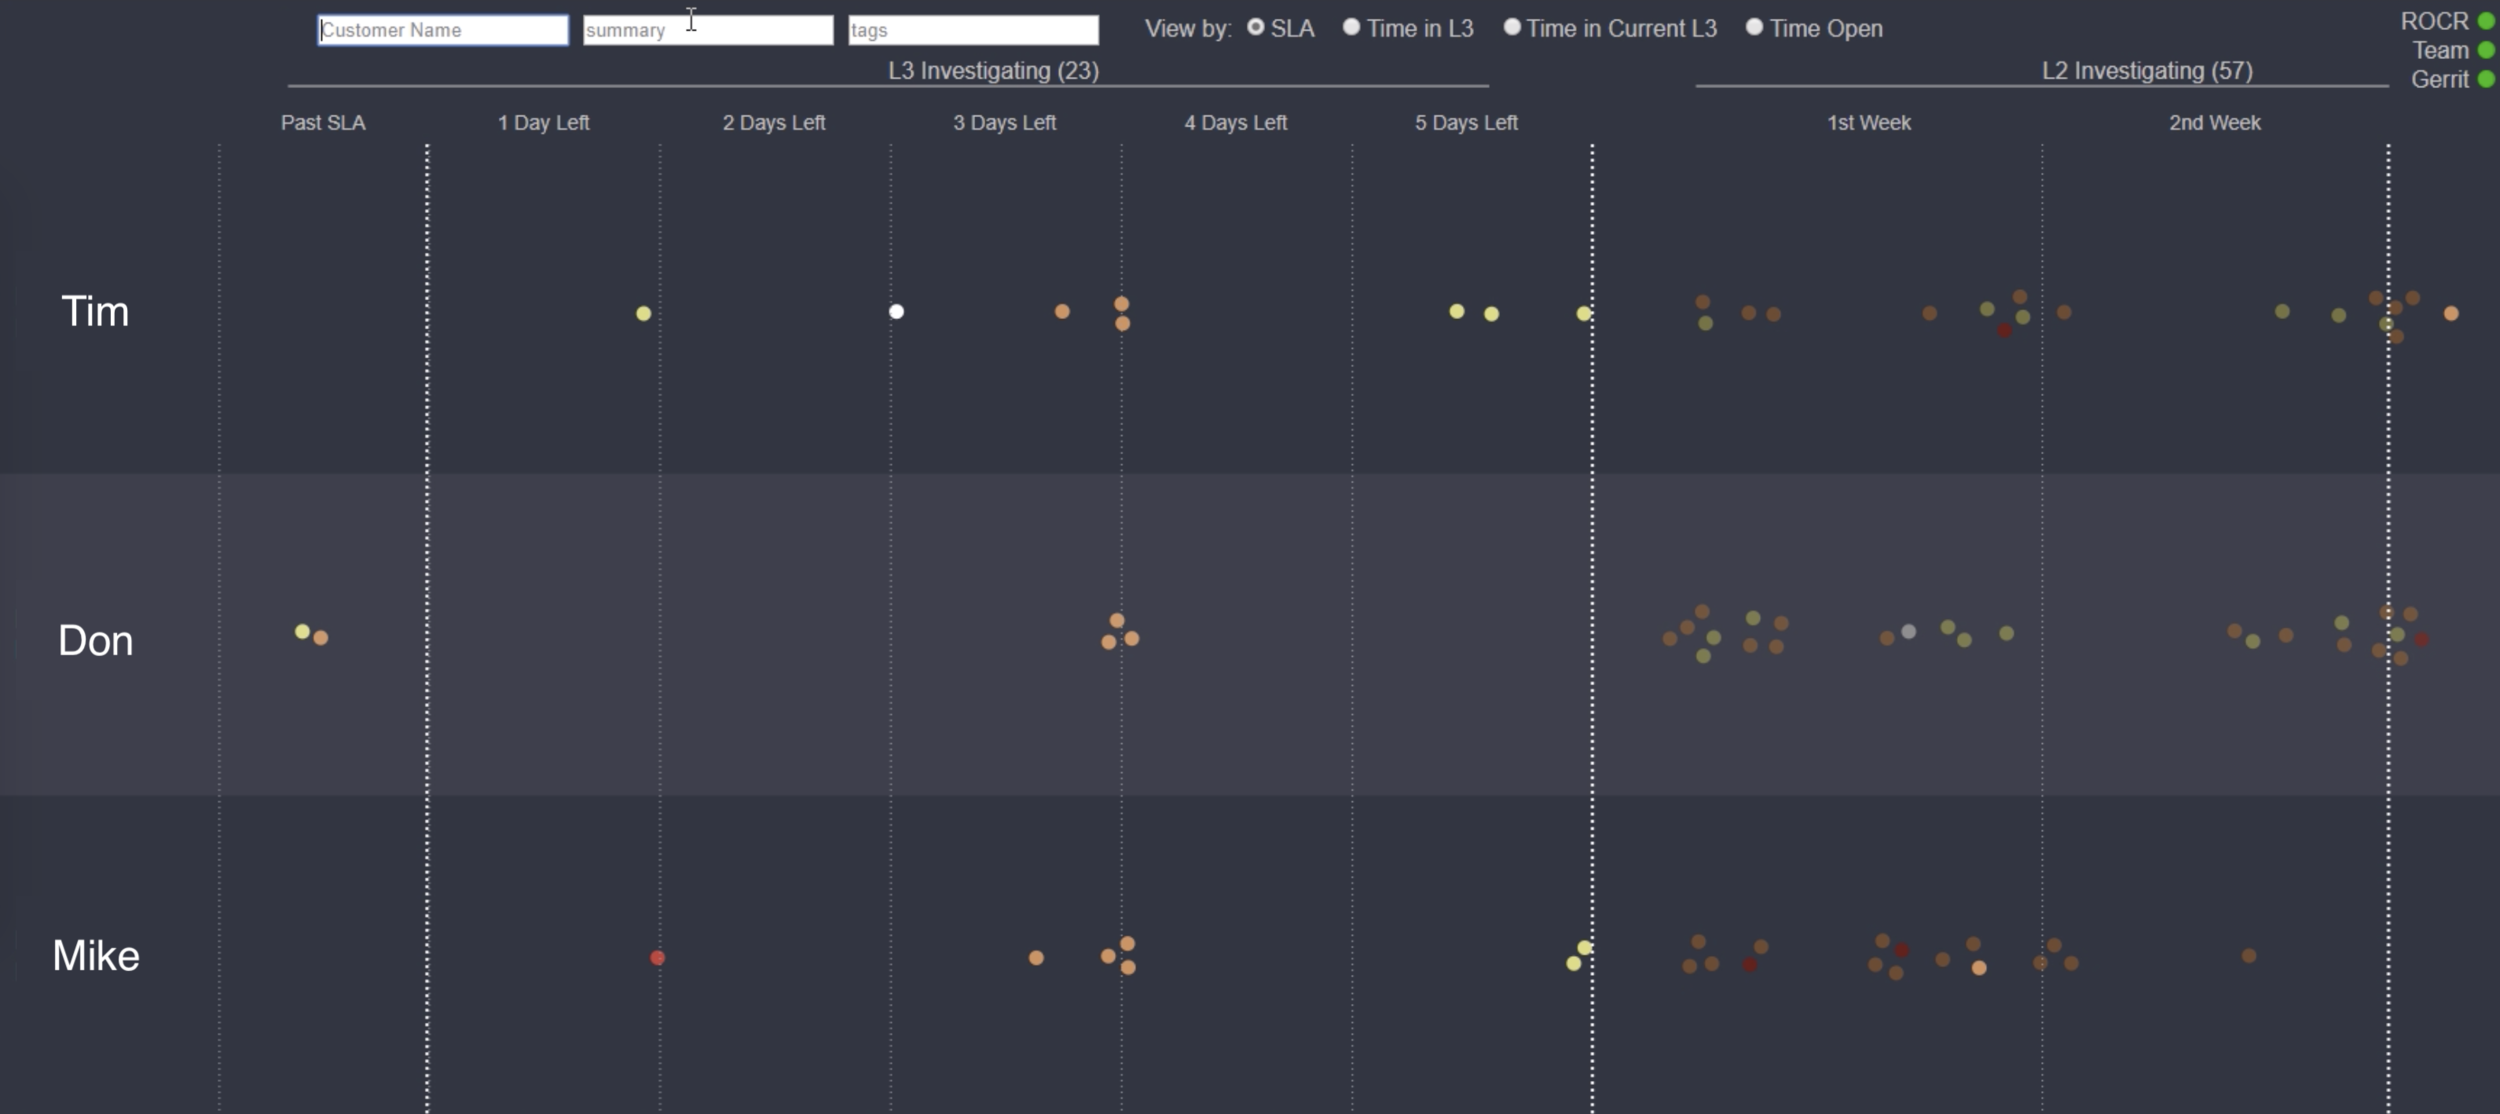
SVG/d3.js
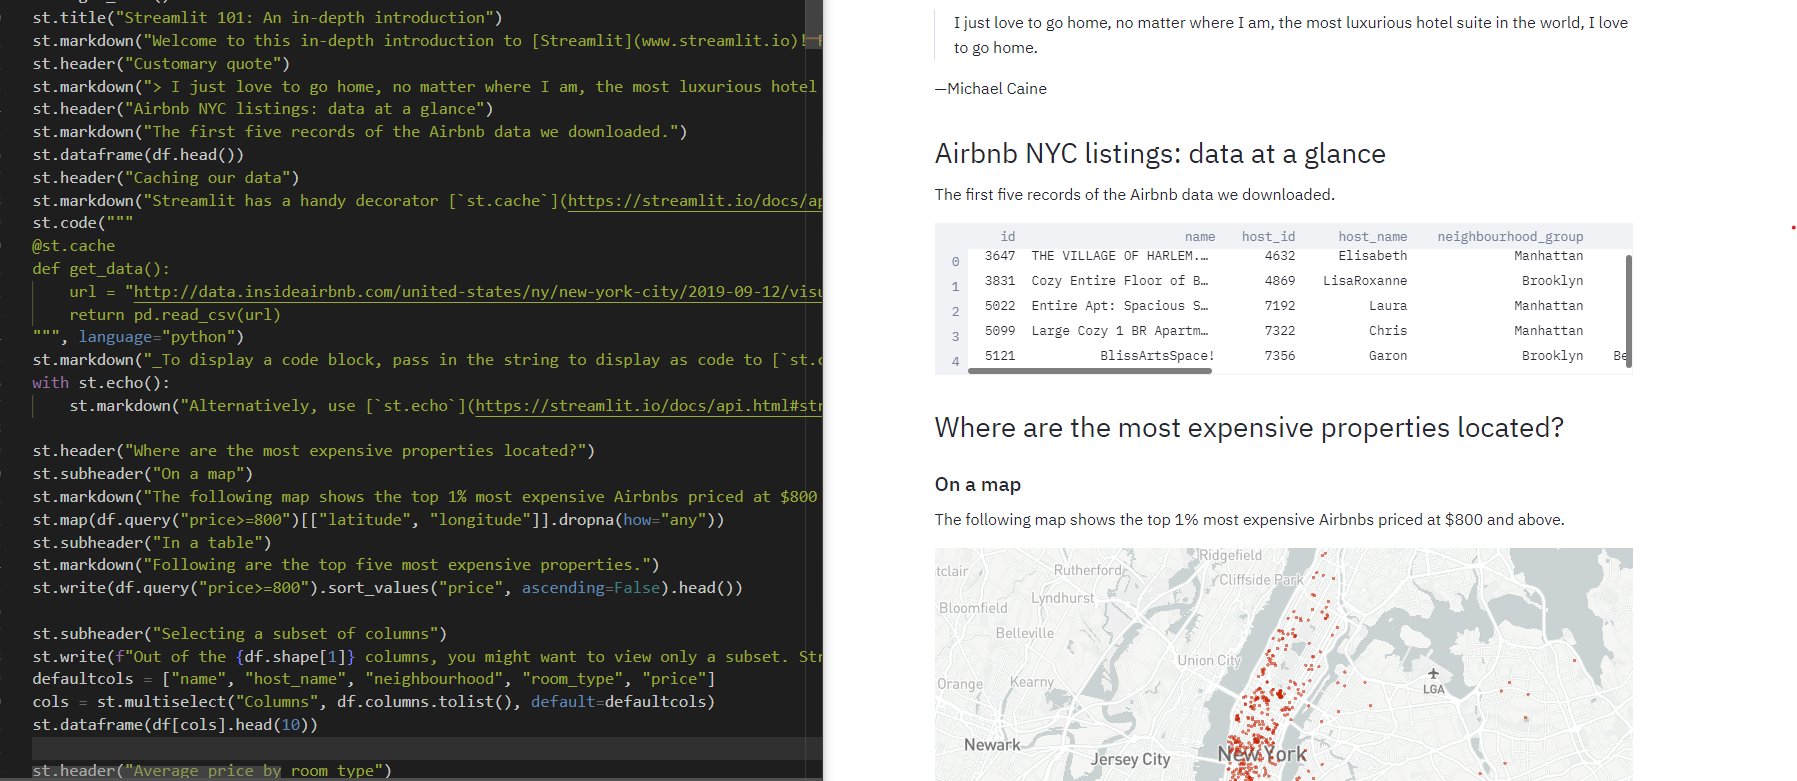
streamlit
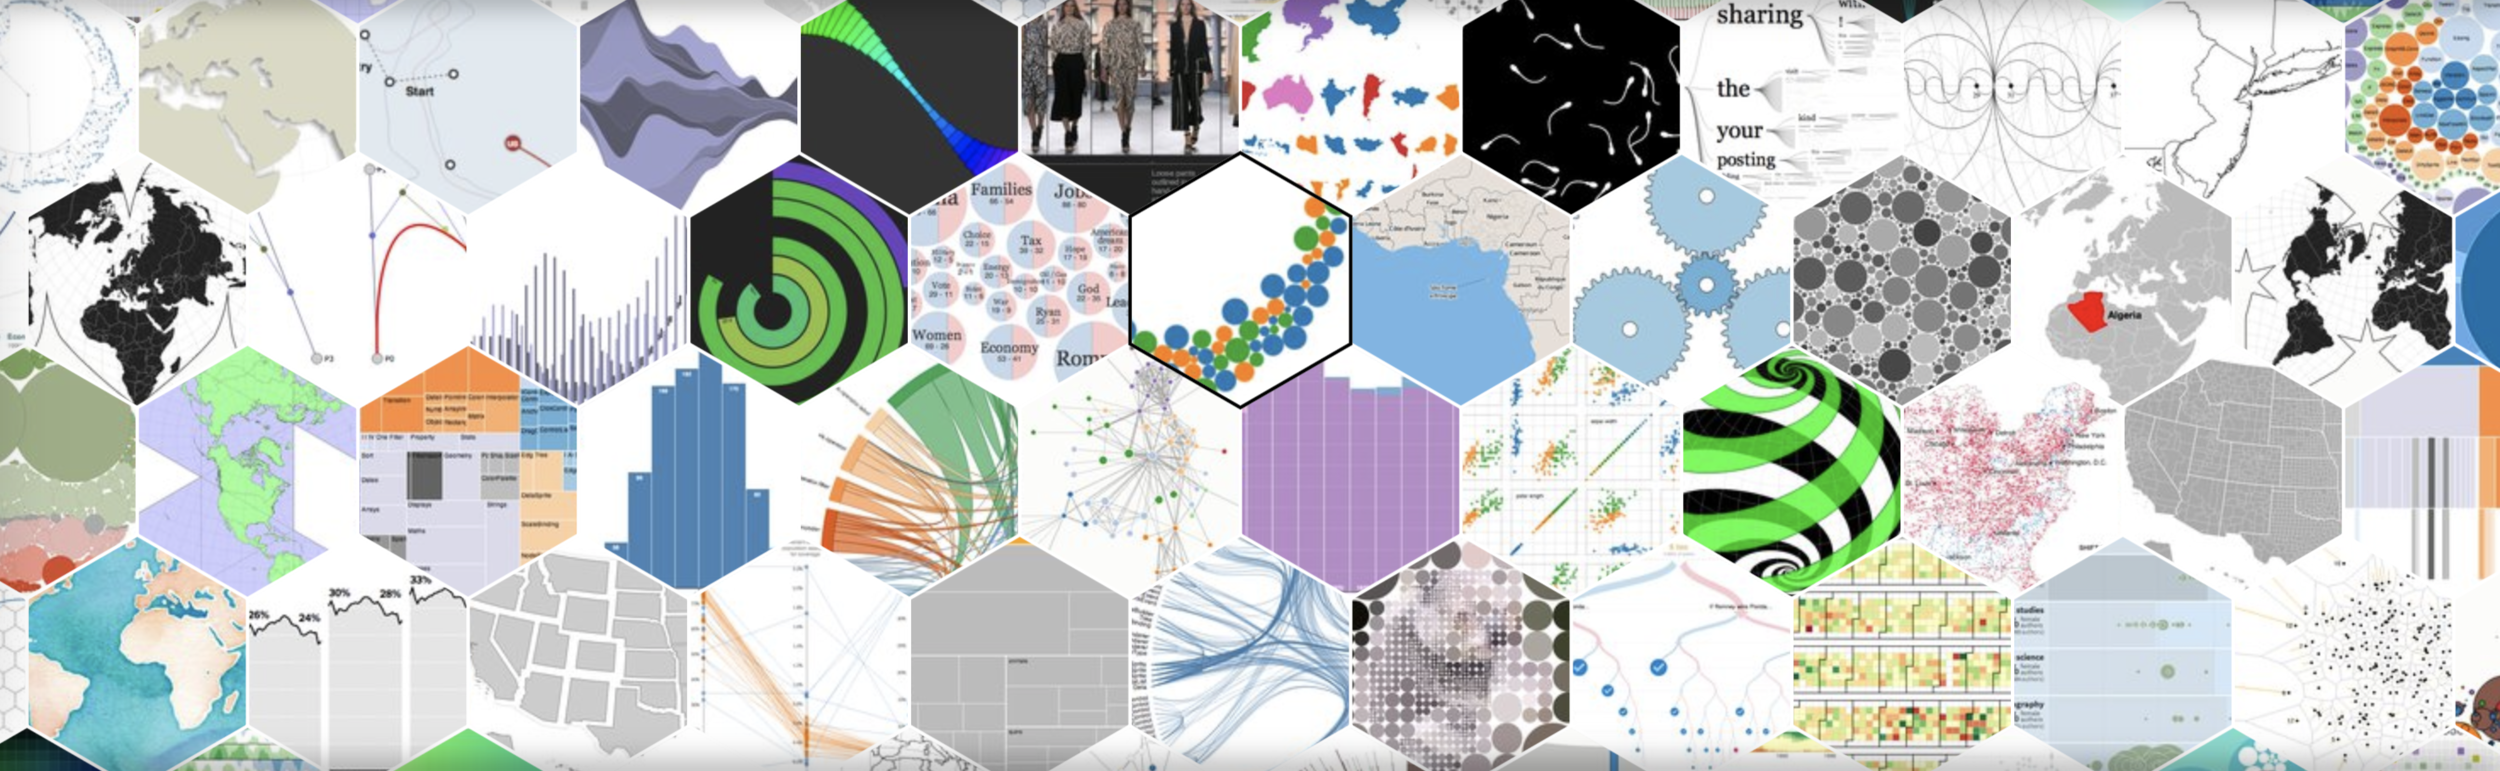
ObservableHQ
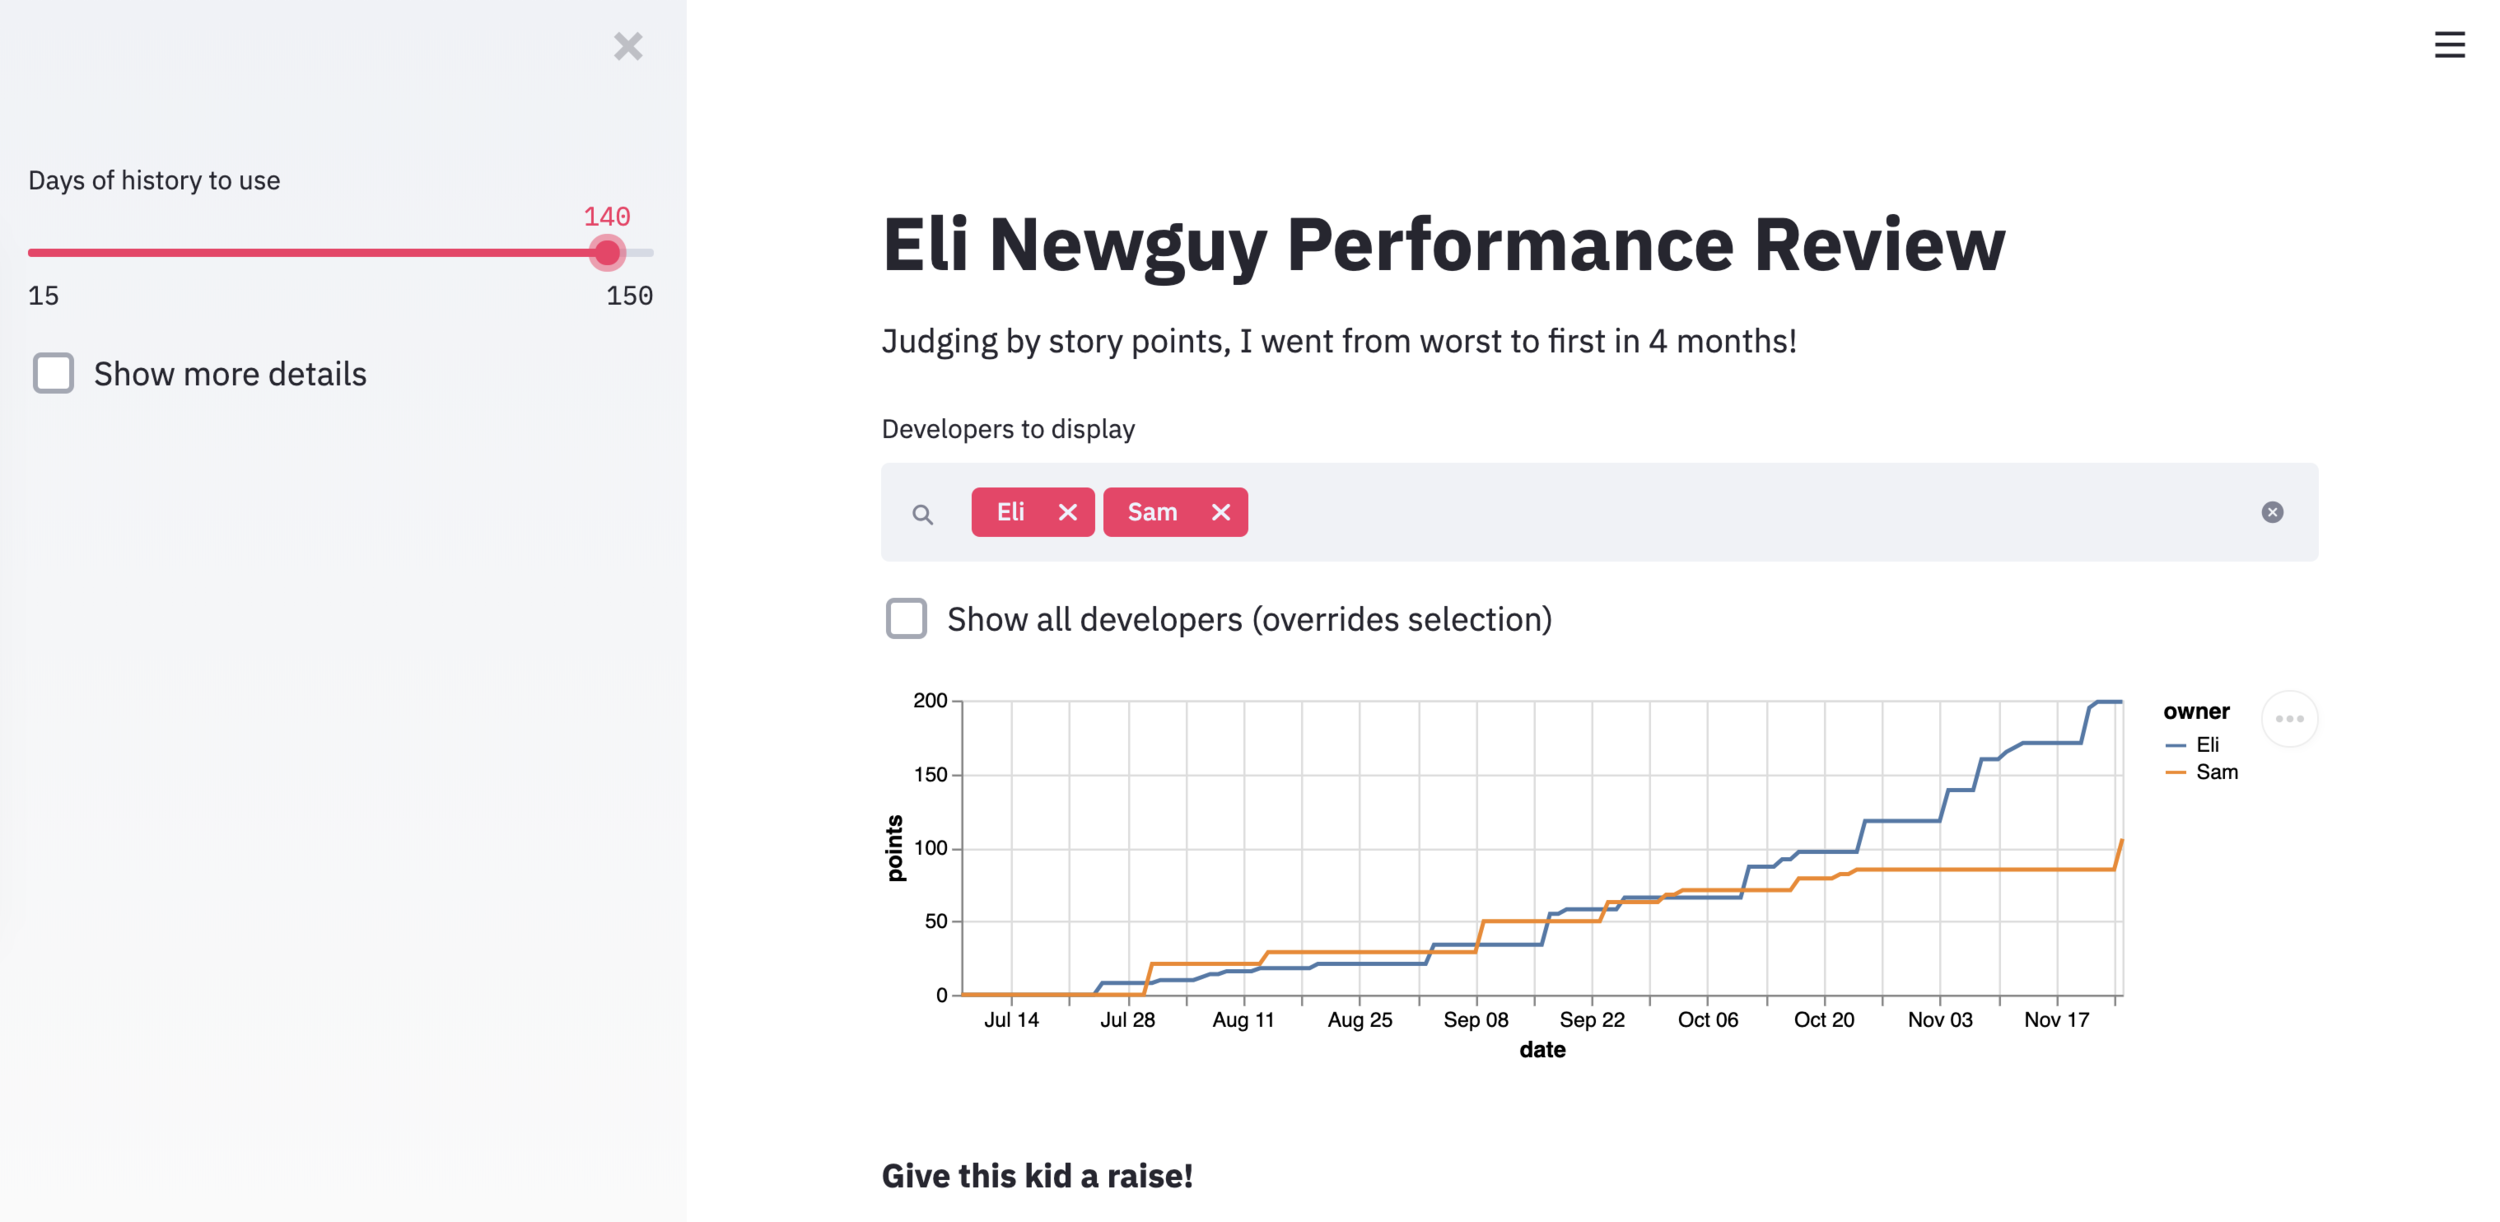

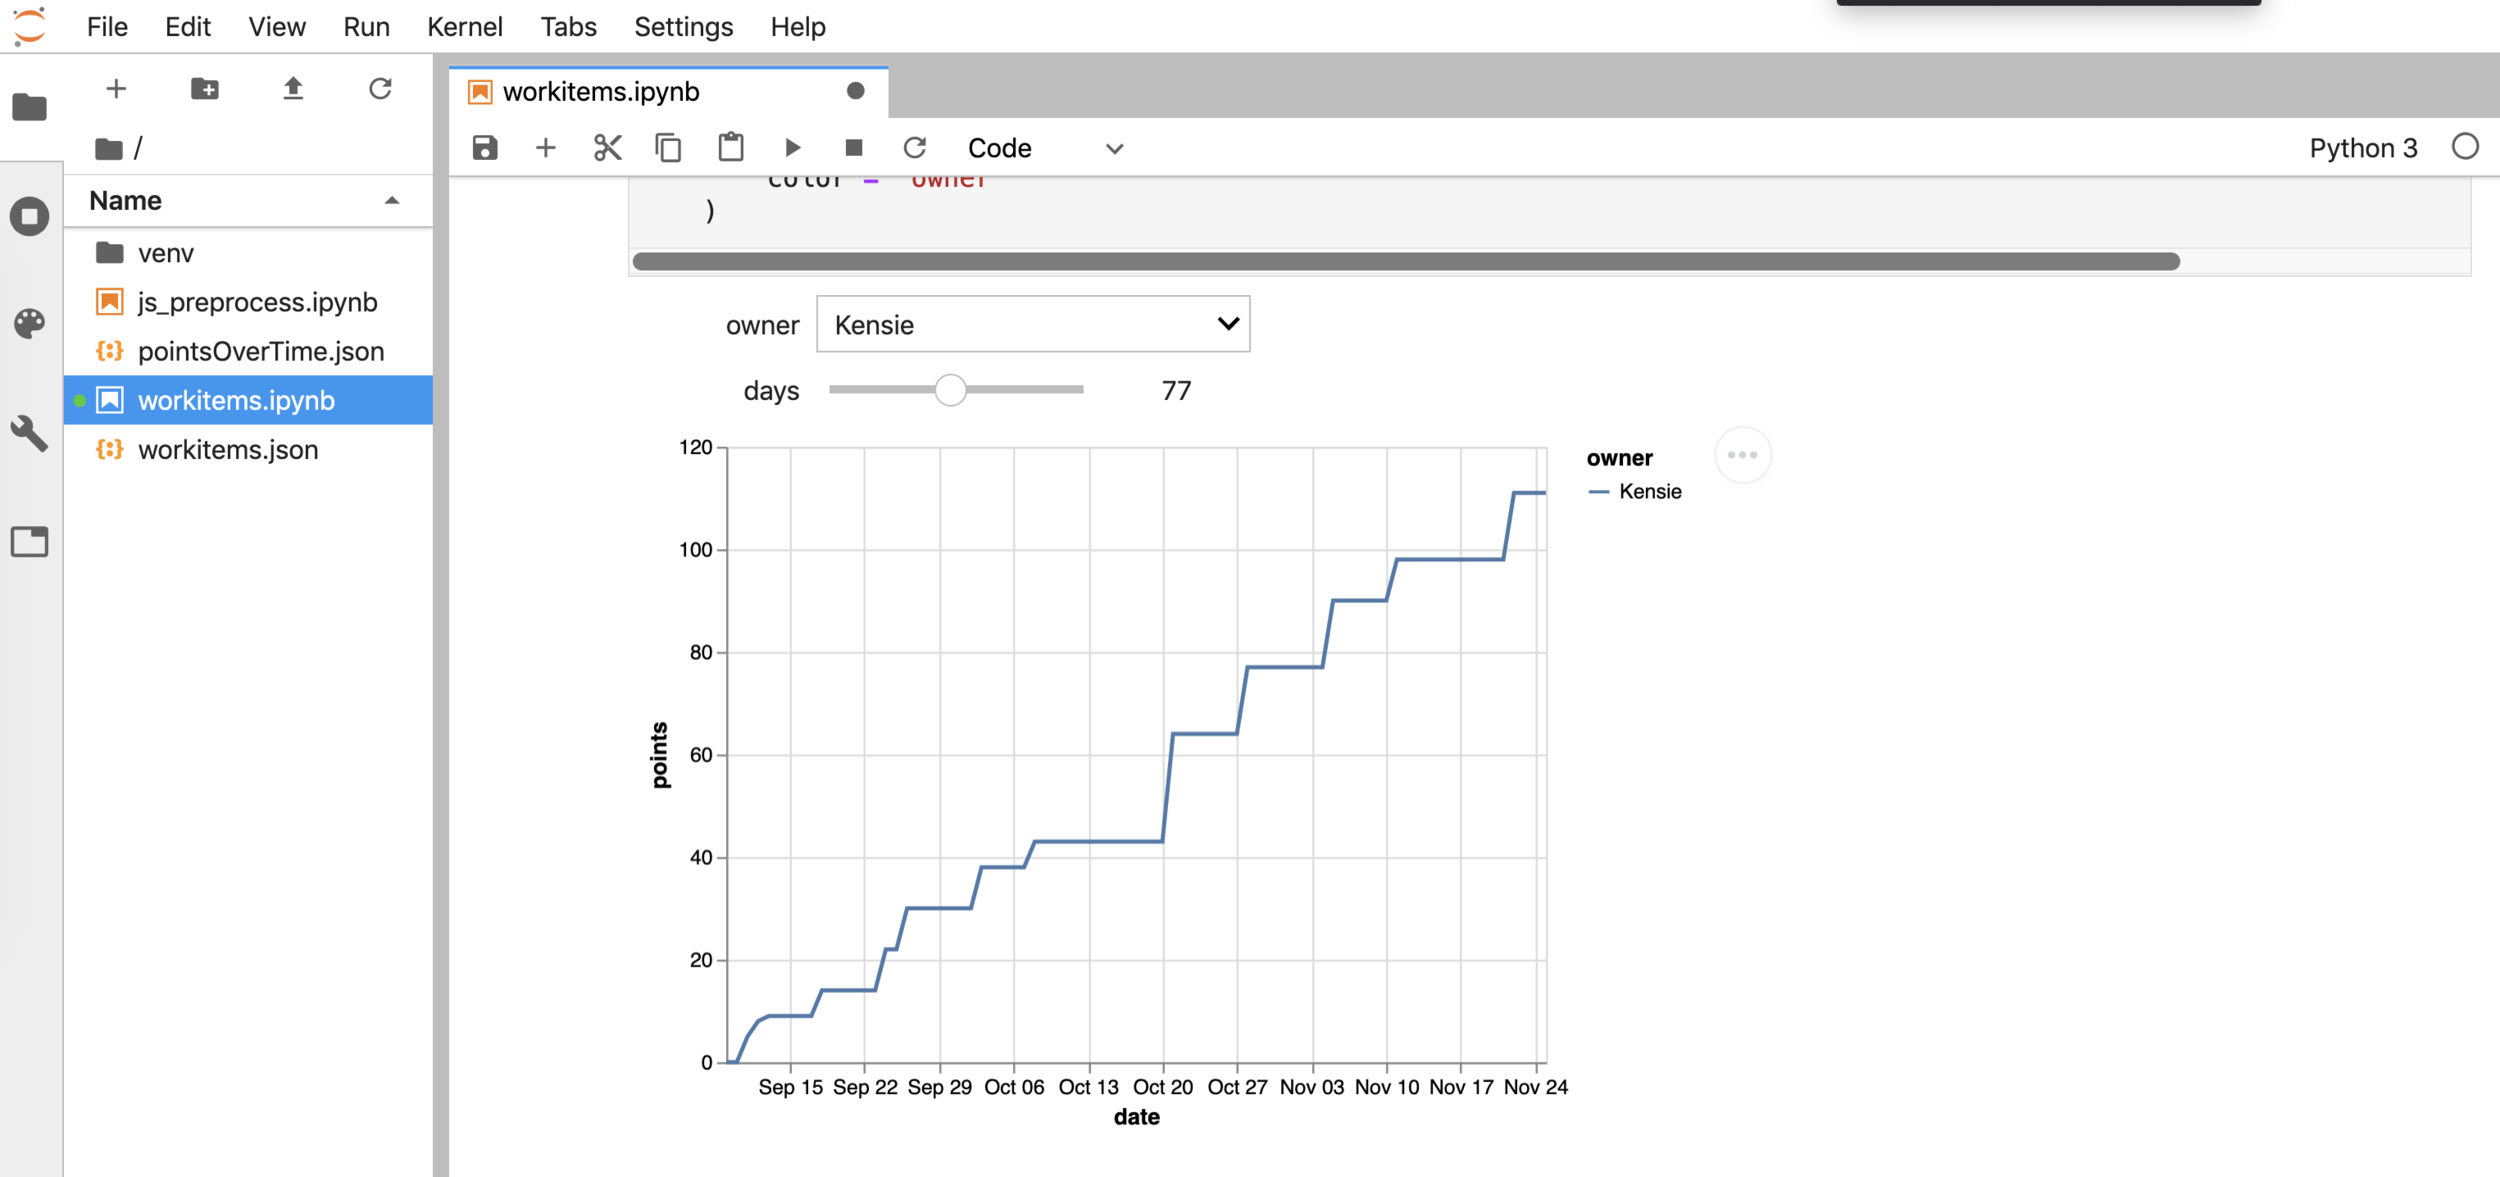
Jupyter
Time for something more impressive
Streamlit
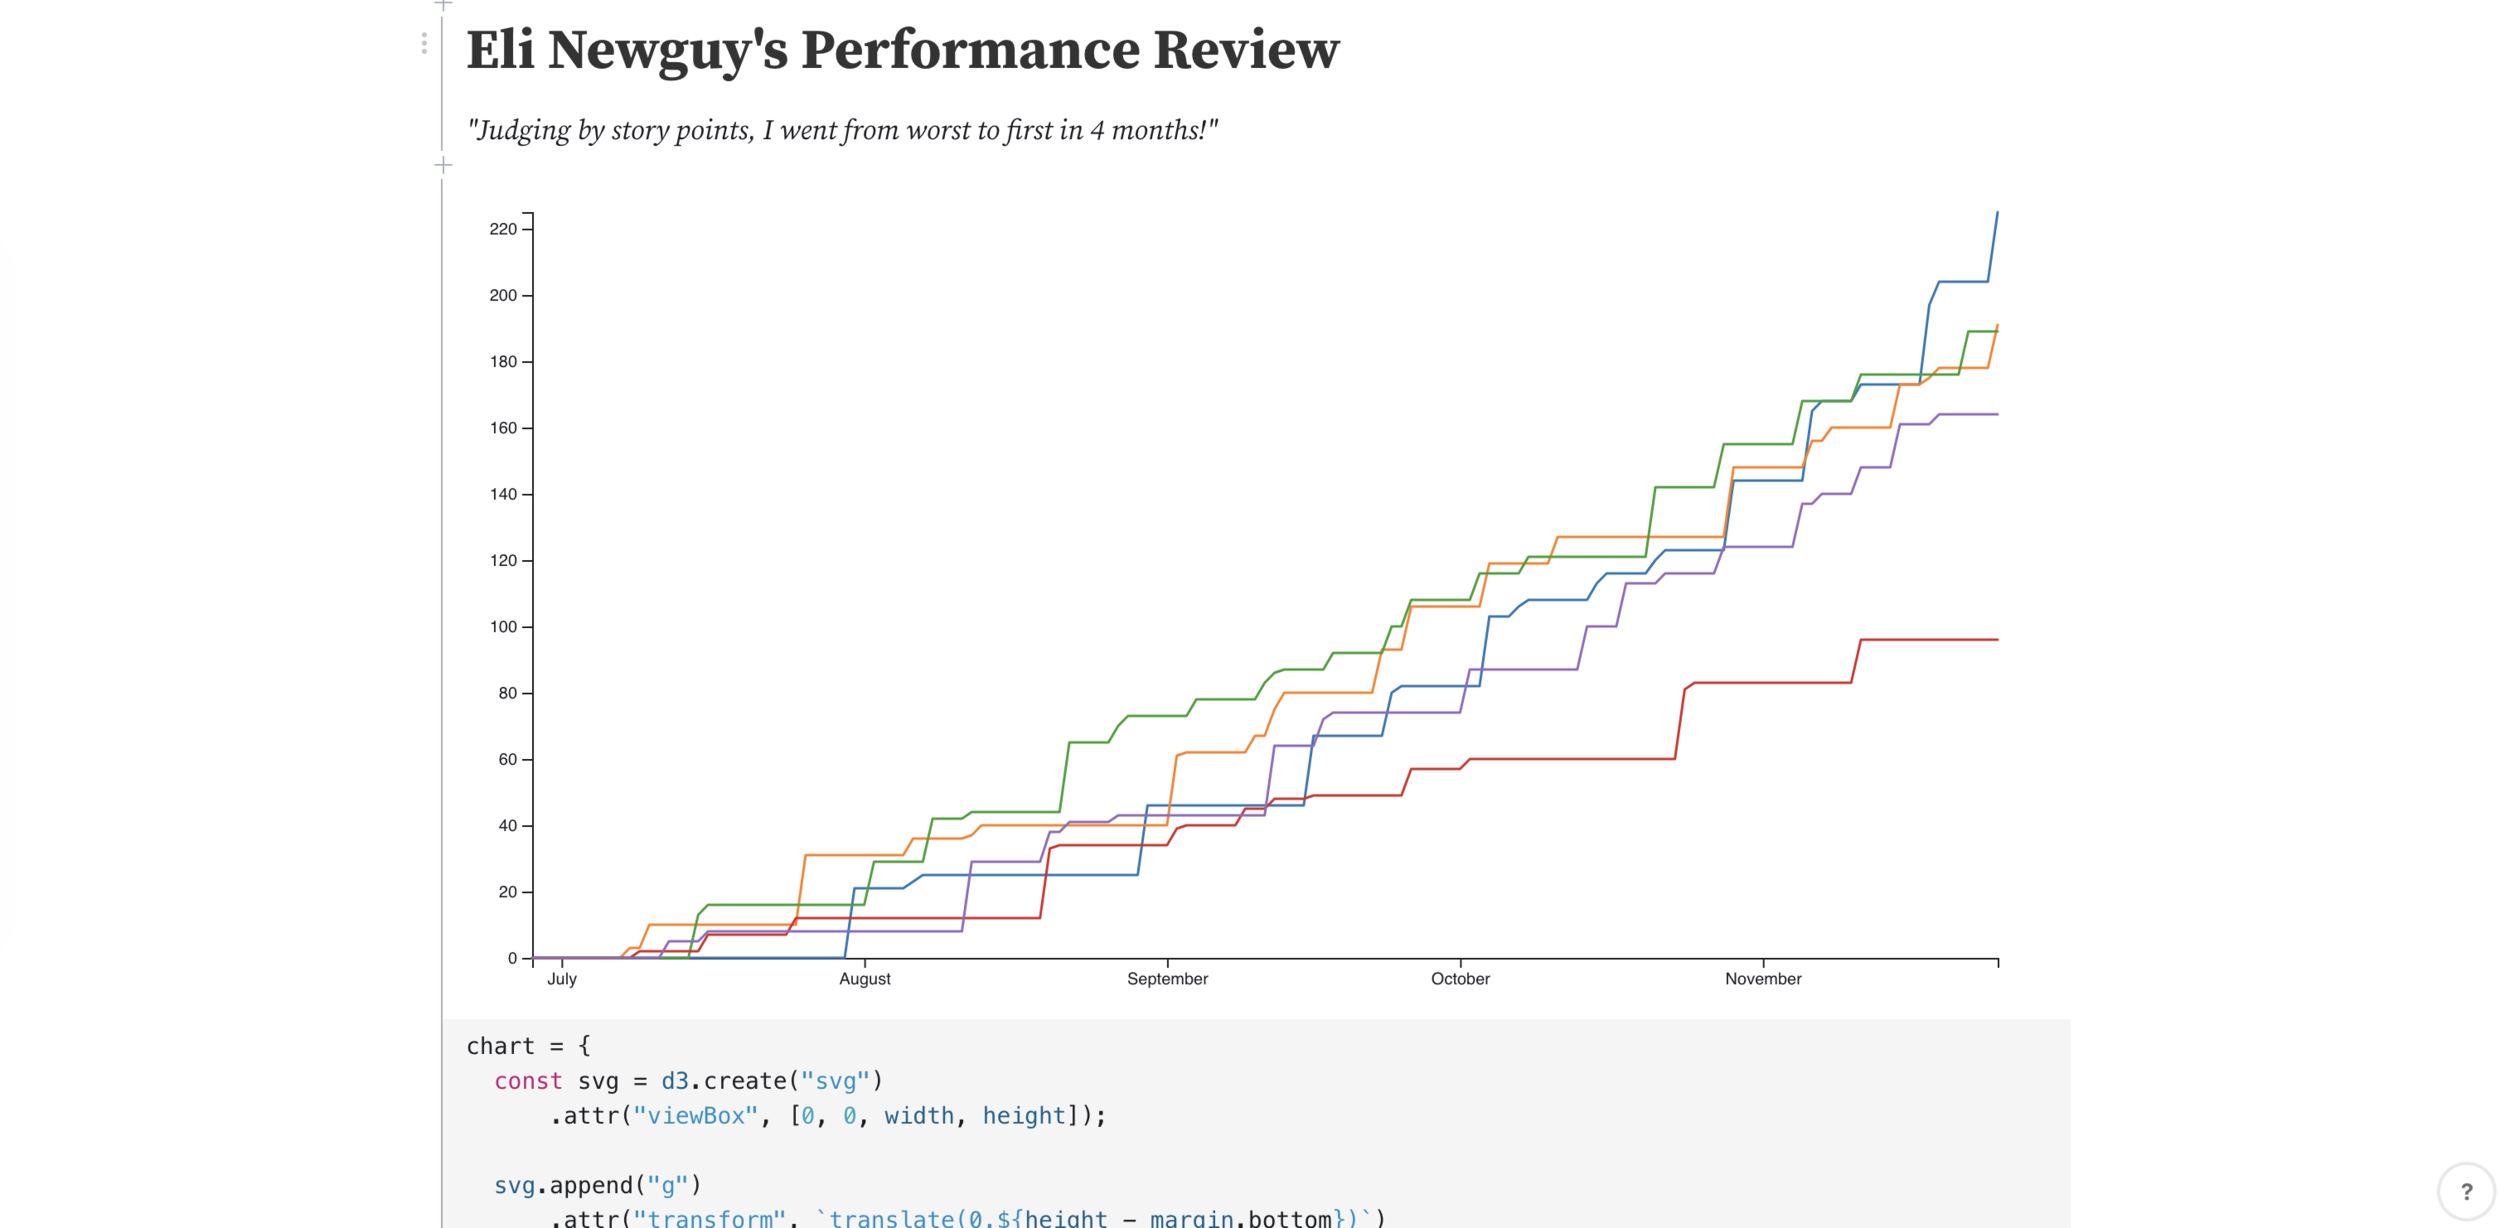
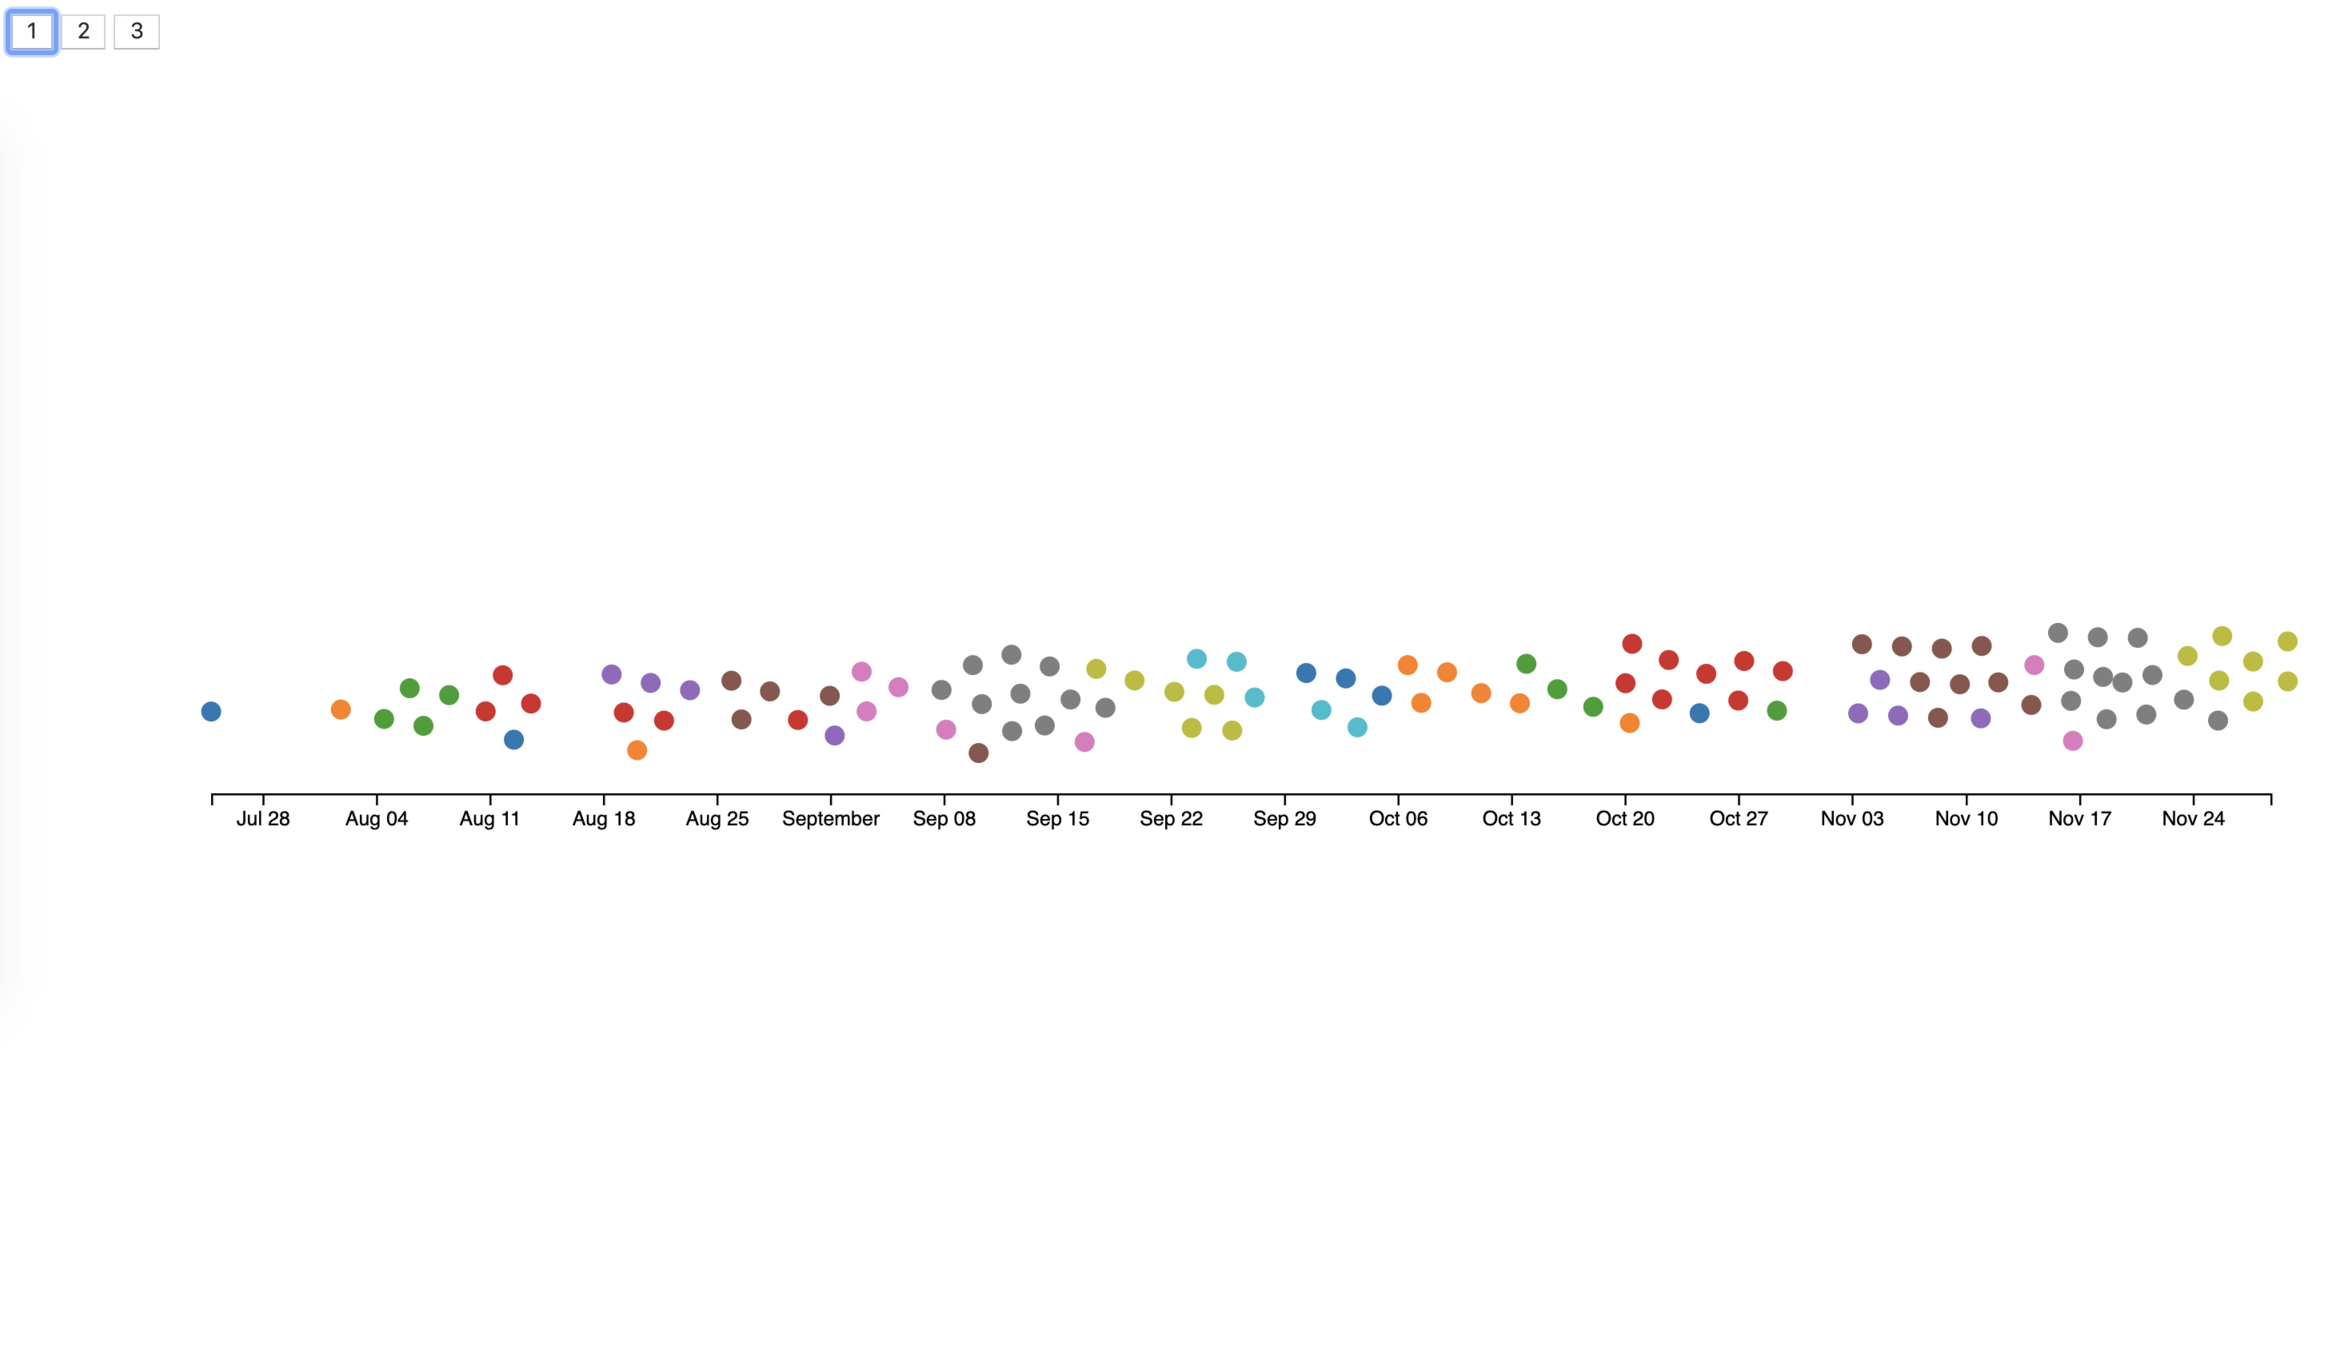
SVG / D3.js
SVG?
<svg width="500" height="140">
  <g>
    <circle
     cx="50" cy="50"
     r="50"/>
  </g>
</svg>
var width = window.innerWidth,
    height = window.innerHeight
    positionStrength = 0.025;

var margin = {
  top: 50,
  left: 100,
  bottom: 50,
  right: 50
}
function updateDOM() {
let dots = svg.selectAll('circle').data(workitems);
dots.enter()
.append('circle')
.style("stroke", currentStroke)
.style("fill", currentFill)
.attr("r", 5);
dots
.attr("cx", d => d.x)
.attr("cy", d => d.y)
let xaxis = d3.axisBottom(x ? x : d3.scaleLinear())
let xAxisG = svg.selectAll('g.xaxis').data(x ? [0] : [])
xAxisG.enter()
.append('g')
.classed('xaxis', true)
.call(xaxis)
.style("opacity", 0)
.attr("transform", `translate(0,${xAxisTransform})`)
.transition()
.delay(500)
.duration(750)
.style("opacity", 1);
xAxisG.exit().remove();
} document.getElementById("first").onclick = function() {
x = d3.scaleTime()
.domain(d3.extent(workitems, d => d.finishDate))
.range([margin.left, width - margin.right]);
y = null;
simulation
.force("charge", d3.forceManyBody().distanceMax(20).strength(-15))
.force("center", null)
.force("x", d3.forceX(d => x(d.finishDate)).strength(positionStrength))
.force("y", d3.forceY(height / 2).strength(positionStrength))
.alpha(1)
.restart();
xAxisTransform = height / 2 + 50;
svg.selectAll('g.xaxis')
.transition()
.duration(500)
.attr("transform", `translate(0, ${xAxisTransform})`);
};var simulation = d3.forceSimulation()
.alphaDecay( 1 - (0.001**(1 / 600)) )
.force("charge", d3.forceManyBody().distanceMax(20).strength(-15))
.force("collide", d3.forceCollide().radius(5))
.force("center", d3.forceCenter( width / 2, height / 2))
.nodes(workitems)
.on("tick", updateDOM);
...
// Later, in "1"
simulation
.force("charge", d3.forceManyBody().distanceMax(20).strength(-15))
.force("center", null)
.force("x", d3.forceX(d => x(d.finishDate)).strength(positionStrength))
.force("y", d3.forceY(height / 2).strength(positionStrength))
.alpha(1)
.restart();
...
// Later, in "2"
simulation
.force("charge", null)
.force("center", null)
.force("x", d3.forceX(d => x(d.finishDate)).strength(positionStrength))
.force("y", d3.forceY(d => y(d.iterationStartDate)).strength(positionStrength))
.alpha(2)
.restart();ObservableHQ
(Last one, I promise)
Things you'll need
- Story to tell
- Data
- Tooling
- "Visual intuition"
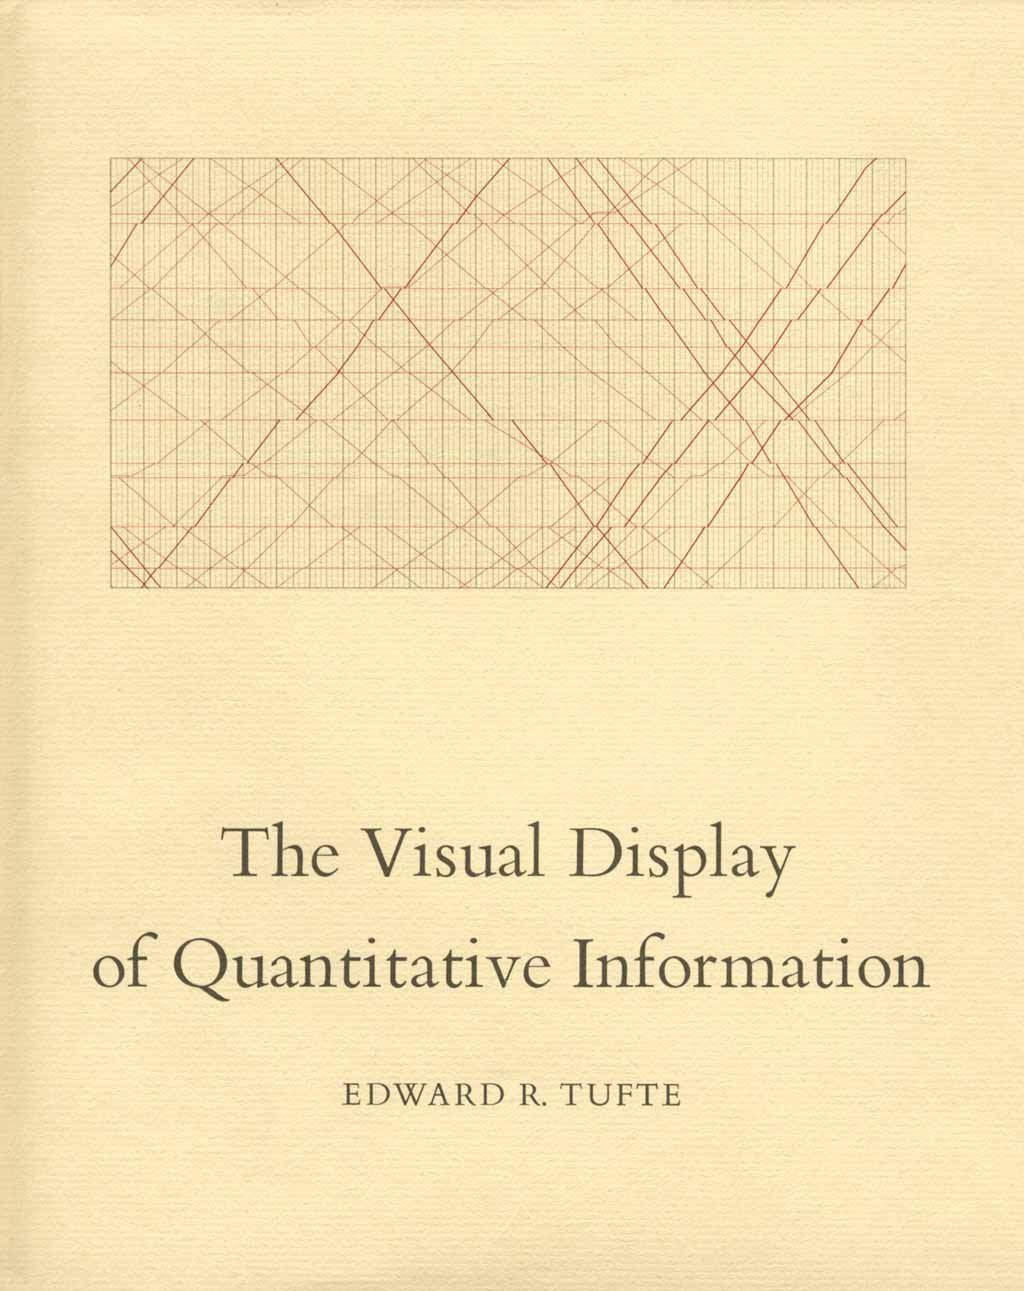
"Graphical excellence is that which gives to the viewer the greatest number of ideas in the shortest time with the least ink in the smallest space."
data\ density = {\#\ entries \over area\ of\ display}
data\ density = {\#\ entries \over area\ of\ display}
| Jupyter | Streamlit | d3.js | ObservableHQ | |
|---|---|---|---|---|
| Language | Python | Python | Javascript | Javascript |
| Easy to Learn | ✓ | ✓ | ✖ | ✖ |
| Interactive | ✖ | ✓ | ✓ | ✓ |
| Custom Viz | ✖ | ✖ | ✓ | ✓ |
| Run locally? | ✓ | ✓ | ✓ | ✖ |
Thank You!
Tim Garvin
@tcgarvin
Dedicated to Pete Garvin
Impress Your Boss with Interactive Visualizations
By Tim Garvin
Impress Your Boss with Interactive Visualizations
Created for CodeMash 2020.