Benchmarking
First Loading Performance in Cost
Tim Wang @timwangdev
The Problem
The first page loading performance on the ACC/ BIM360 Cost website is slow.
But how slow?
First loading:
- An authorized user with full access opening Cost initial page for the first time.
- No previous browser cache exists.
Field Test
- Monitoring real-world user metrics via NewRelic and other tools. (RUM, Real User Monitoring)
- Page loading time could be affected by user network bandwidth, user location, and browser performance etc.
- The 75th percentile often used for analysis.
- Require production code change and time for collection.
Data Collection
Lab Test
Lab data, also known as synthetic data, is collected from a controlled environment (eg. Jenkins), rather than actual users.
Testing Environment:
- Operation System: Windows 10 (Cloud PC)
- Browser: Chrome 89 (Incognito Mode)
- Location: US-WEST
Data Collection
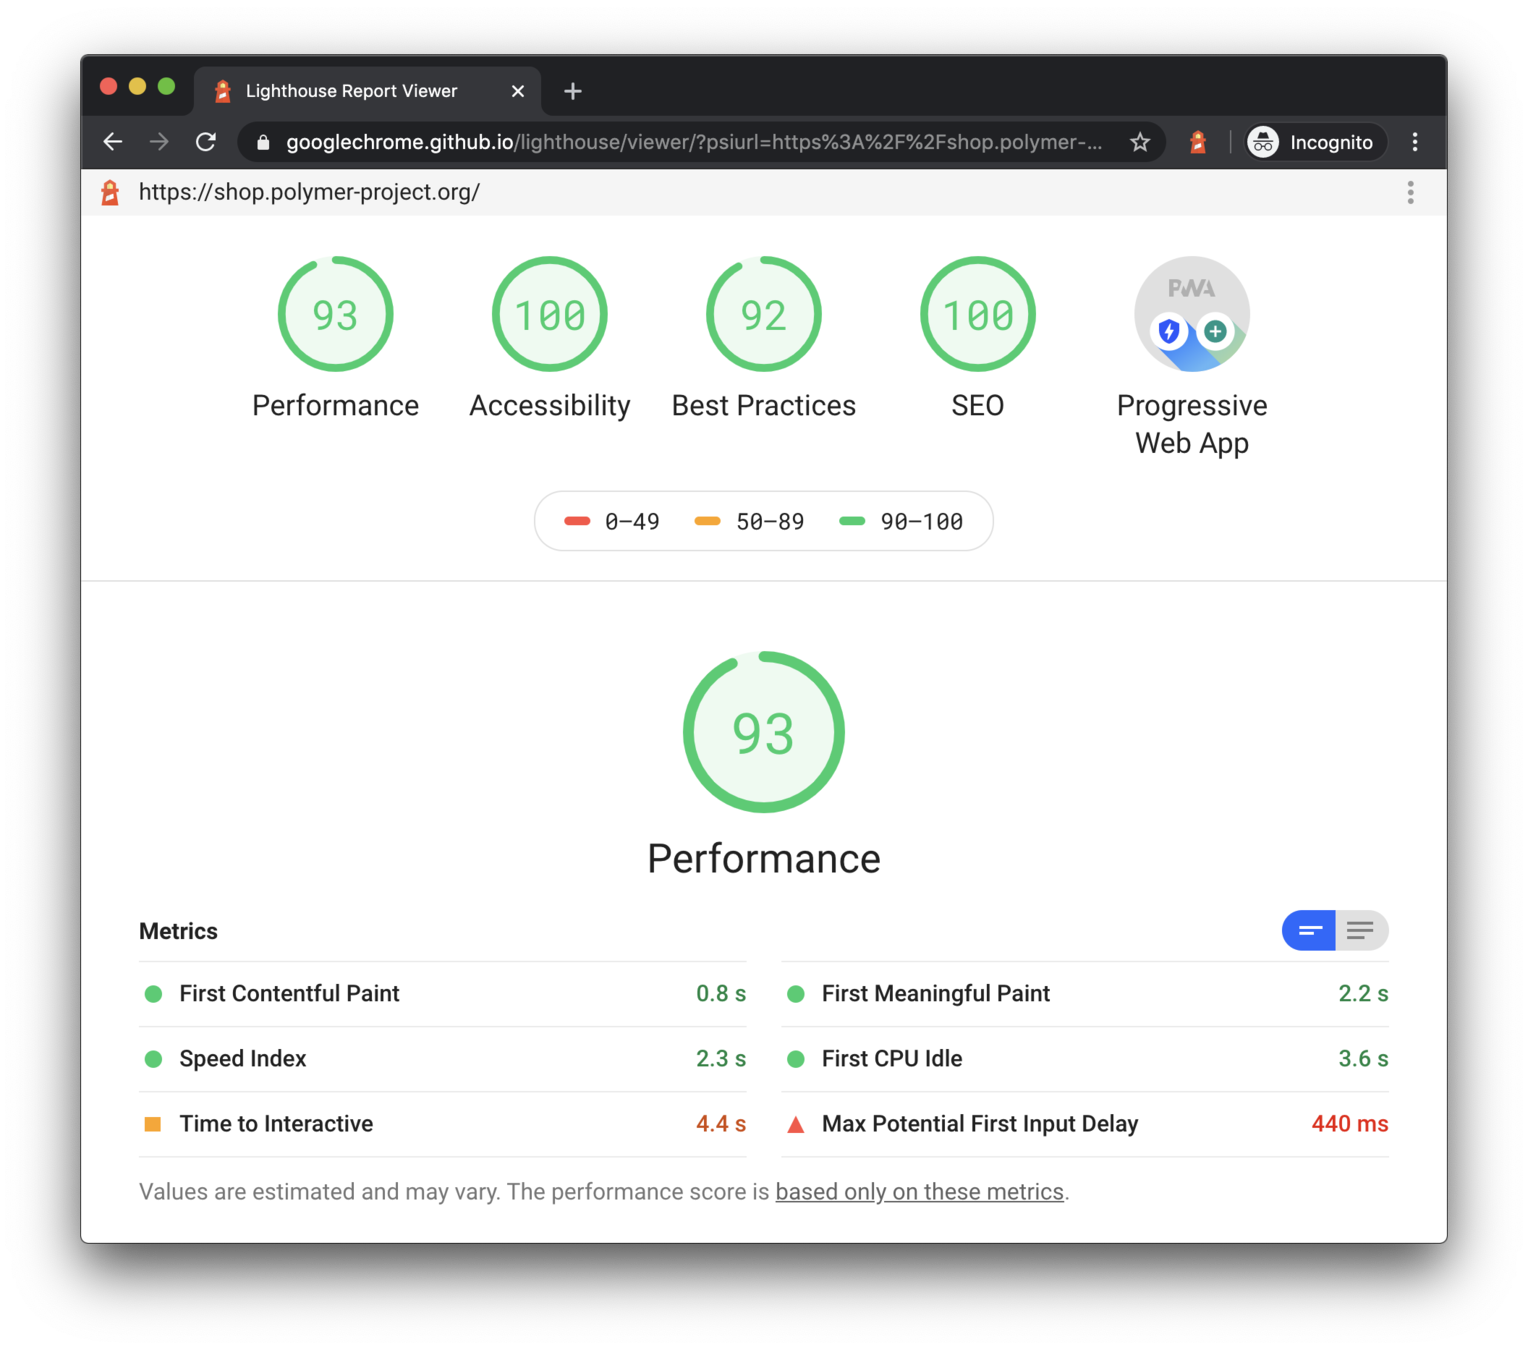
Lighthouse is an open-source, automated tool for auditing the quality of web pages. Lighthouse can be run in Chrome DevTools, from the command line, or as a Node module.
-
Device emulated: Desktop
-
Network throttling: 40 ms TCP RTT, 10,240 Kbps throughput (Simulated)
-
CPU throttling: 1x slowdown (Simulated)
In Cost, FCP stands for the user seeing the project skeleton for the first time. It indicates the app is starting to load page content. And LCP stands for main table structure (header, actions menu, etc) was shown to the user.
Web Vitals
First Contentful Paint (FCP)
Largest Contentful Paint (LCP)
Cumulative Layout Shift (CLS)
Benchmark Result
- FP - First Paint (Static loading screen was shown): Under 1 s
- FCP - First Contentful Paint: 5.5 s
- LCP - Largest Contentful Paint: ~25 s
- CLS - Cumulative Layout Shift: Under 0.1s
Diagnostics
Understand how browser loads first page from initial index.html request.
- Analyze critical resource chains
-
Eliminate render-blocking resources
- Preload key chunks for initial rendering
-
Keep request counts low and transfer sizes small
-
Render partial content as soon as it is ready
- Styles
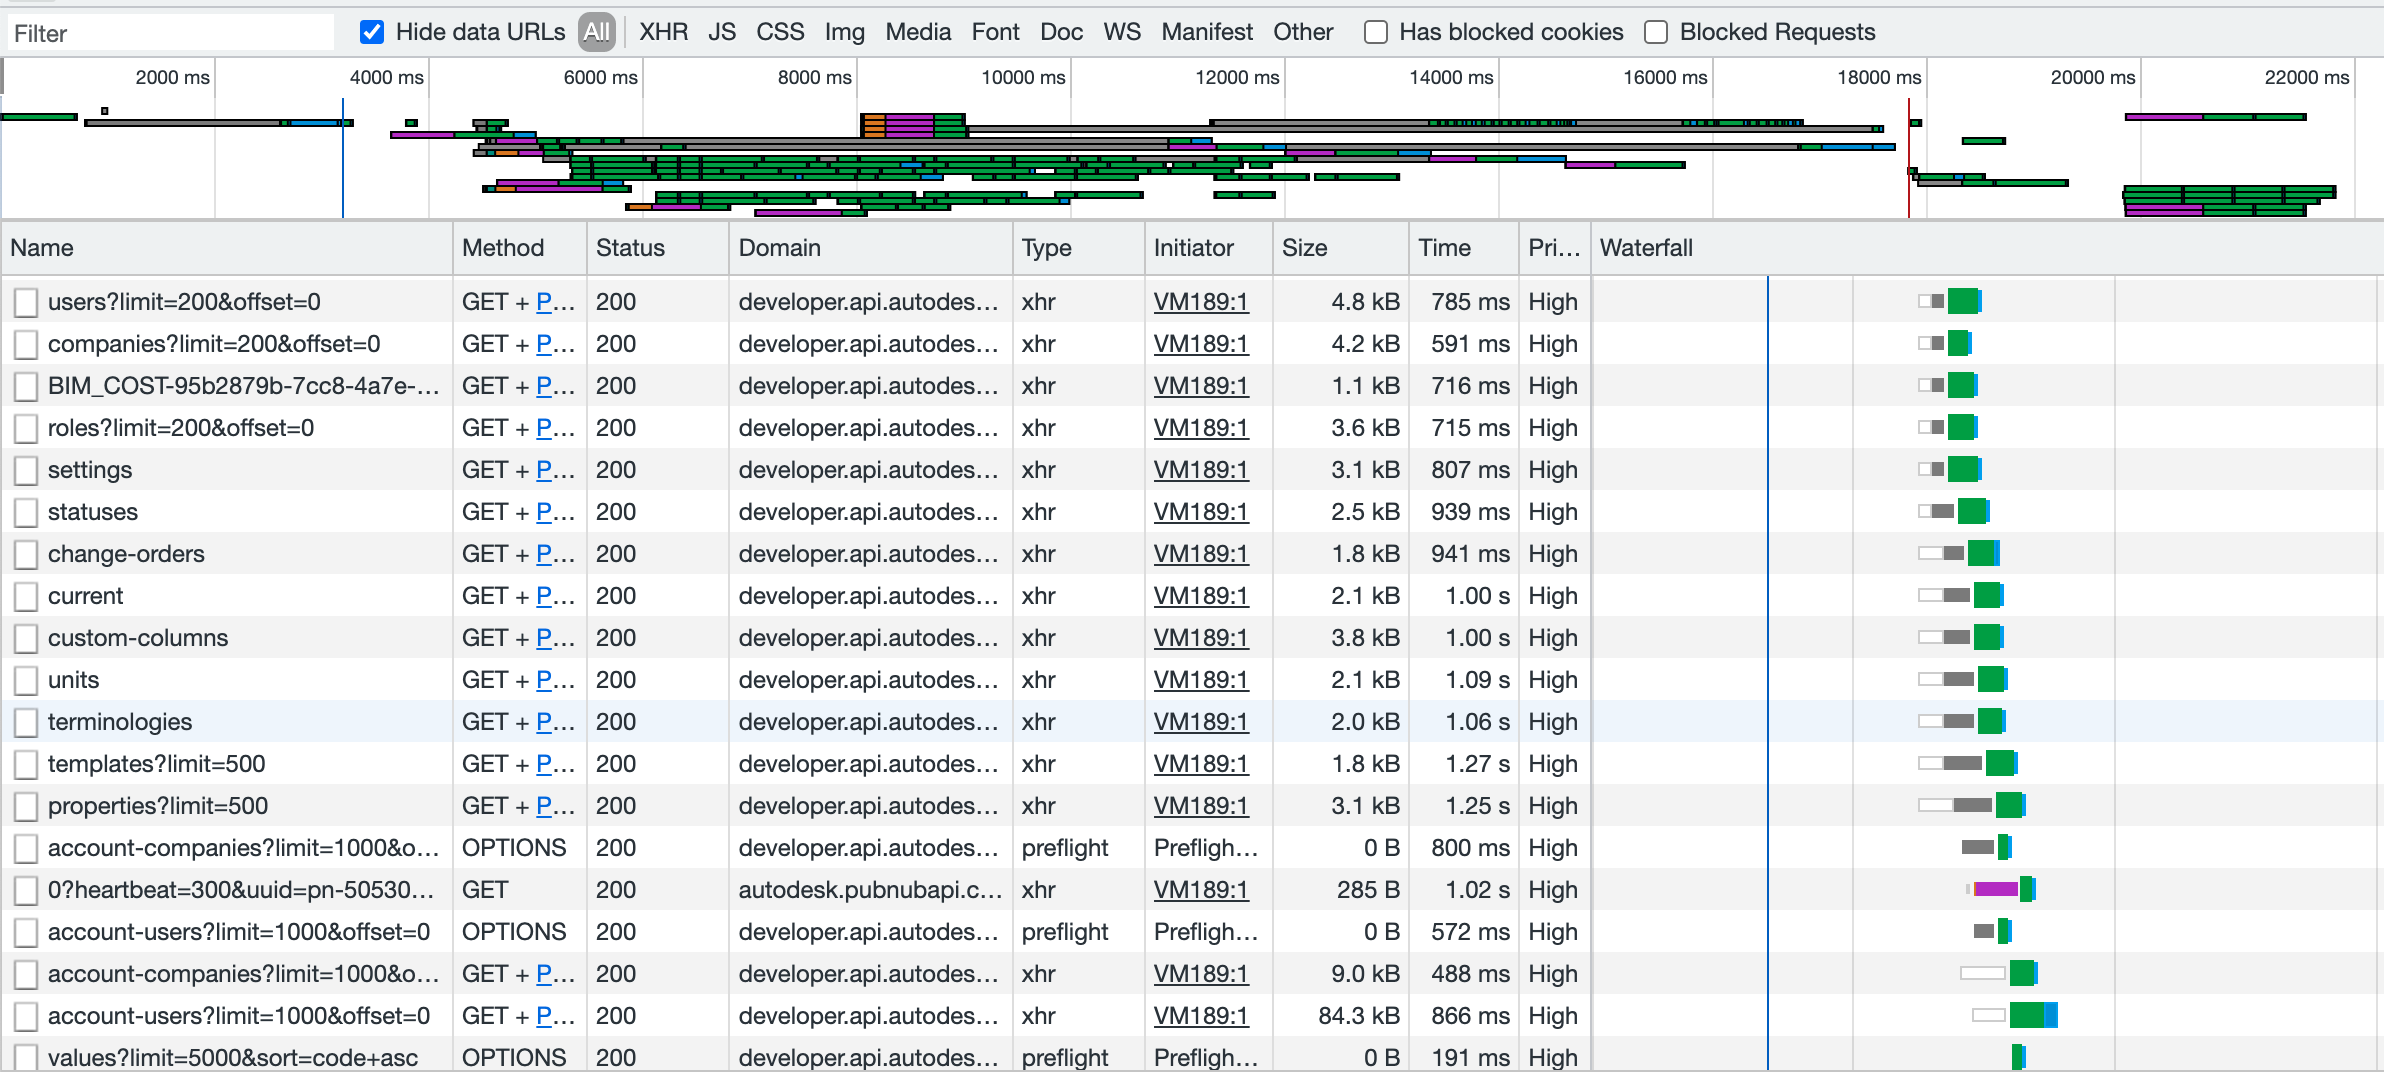
Network Request Waterfall
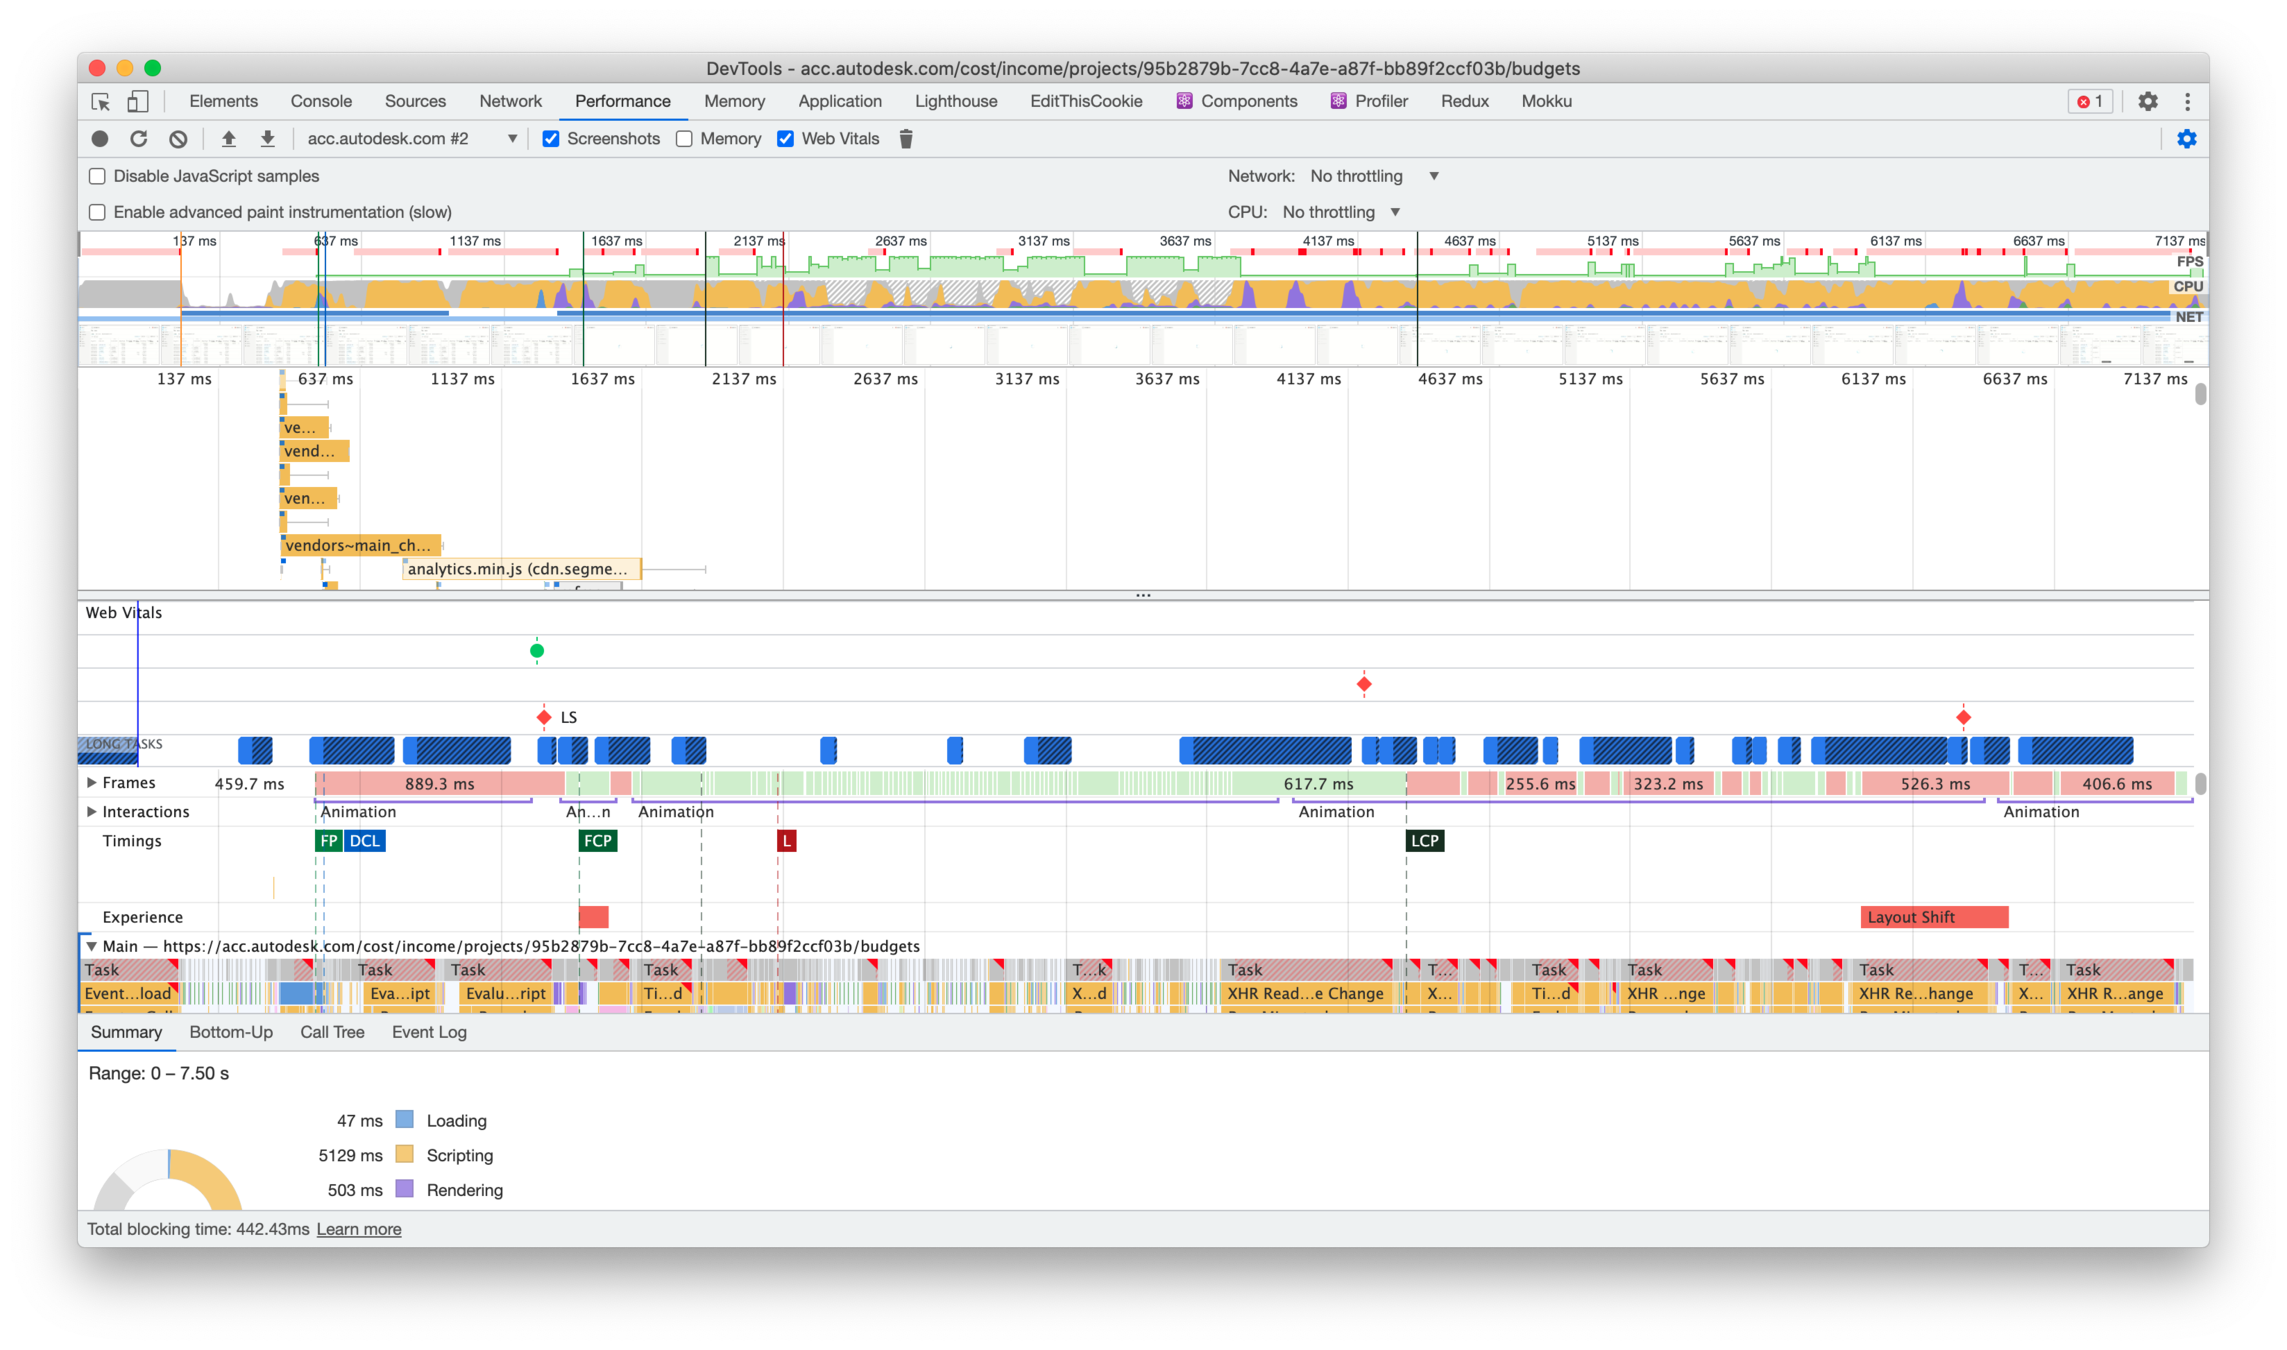
Chrome DevTools Profiling
- Webpack Bundle Analyzer
- Key bundle loaded without compassion (11.36 MB vs 2.79 MB expected)
- CloudFront will only compress files between 1,000 and 10,000,000 bytes.
- Styles are bundled for separated chunks that would increases request count and contains duplicated rules.
- Alloy modules could have a lot of potential on size reduction.
Bundle size

- Token validation: Init
- Third-party initialization (Segment, LaunchDarkly feature flags, FullStory, MixPanel)
-
Meta/Project resources
- project_entitlements
- account_entitlements
- current
- status
- users
- roles
- companies
- notification
API Call Chains
-
Cost resources (requests sent to developer.api.autodesk.com/cost)
- status
- settings
- terminologies
- change-orders
- current
- templates
- units
- custom-columns?associationType=Budget
- custom-columns?associationType=Contract
- properties
- document-templates
- workflow/definations
- account-user
- account-company
- segment/values
- status
- contracts/meta
- budget/meta
- schedule-of-values
- main-contracts
- saved-views
-
Load budget: Finish table rendering
- budgets
- budgets/summary
- budgets/overview
API call chain requests take over half of the initial loading time, and requests are heavily queued with browser limitation.
Optimizations for API call chains:
- Reduce API endpoint latency by adding region header
- Make non-critical API calls non-block (project_entitlements)
- Reduce the number of requests (custom-columns, budgets/overview)
- Defer resources preloading that would affect initial rendering (*/meta)
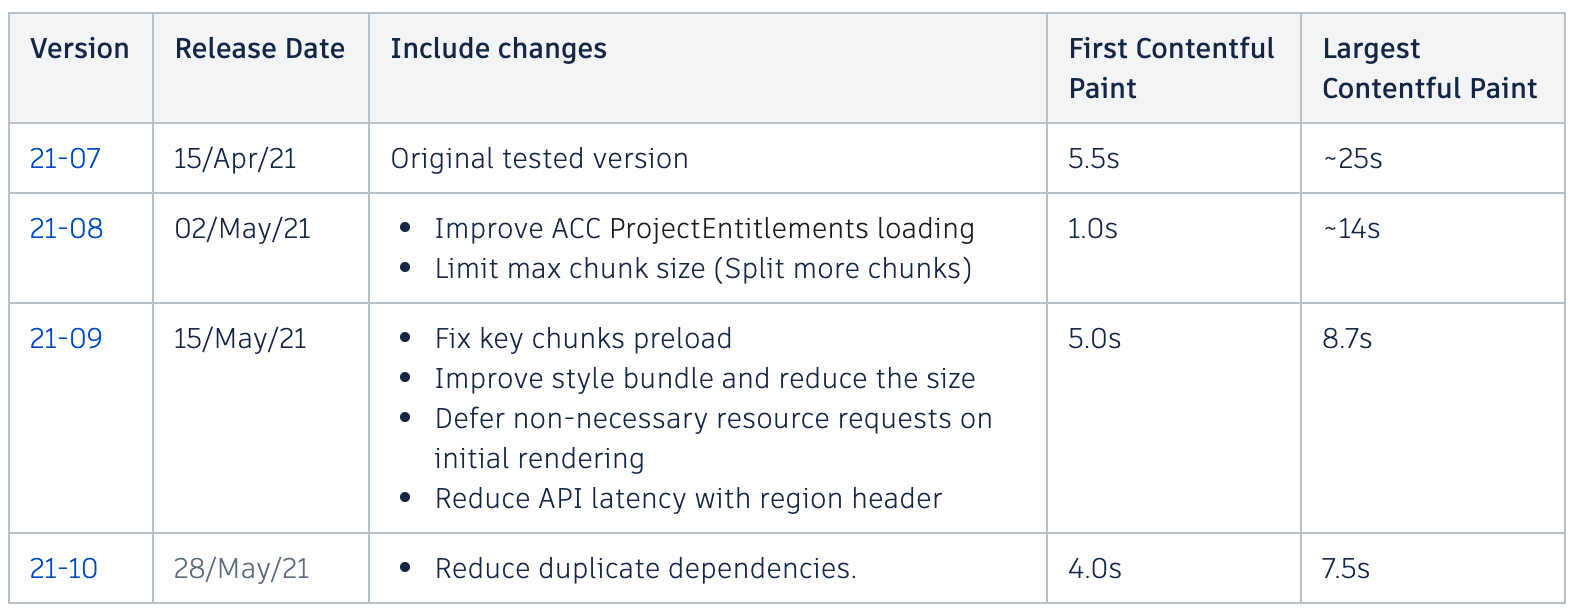
Optimization Results Comparison
Automation Testing with Lighthouse
User Timing with Web Performance API
Using the Performance API - Web APIs | MDN - https://developer.mozilla.org/en-US/docs/Web/API/Performance_API/Using_the_Performance_API
const markerNameA = "example-marker-a"
const markerNameB = "example-marker-b"

// Run some nested timeouts, and create a PerformanceMark for each.
performance.mark(markerNameA);
setTimeout(function() {
  performance.mark(markerNameB);
  setTimeout(function() {

    // Create a variety of measurements.
    performance.measure("measure a to b", markerNameA, markerNameB);
    performance.measure("measure a to now", markerNameA);
    performance.measure("measure from navigation start to b", undefined, markerNameB);
    performance.measure("measure from navigation start to now");

    // Pull out all of the measurements.
    console.log(performance.getEntriesByType("measure"));

    // Finally, clean up the entries.
    performance.clearMarks();
    performance.clearMeasures();
  }, 1000);
}, 1000);
Q&A
Bench
By Tim Wang

