ggplot2 v2 and friends
modern visualization techniques


Anton Antonov
R is growing
- R Consortium
- user groups, conferences
- CRAN grows exponentially
- growing developer activity
- industry giants promote R
- business-oriented solutions
R's growth points
- overly hyped algorithms
- reproducibility, portability
- "smart" analytics
- web
- ...
- visualization
If we were in 00's
-
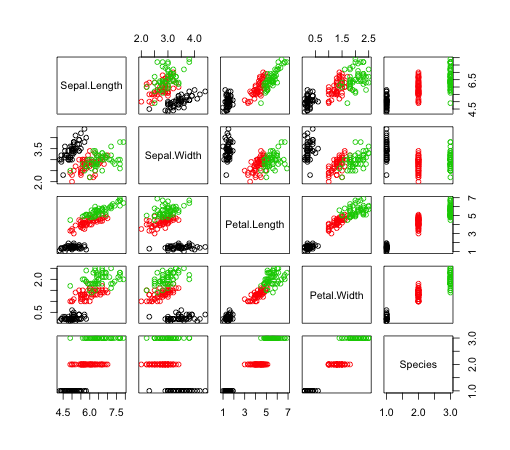
base plotting
-
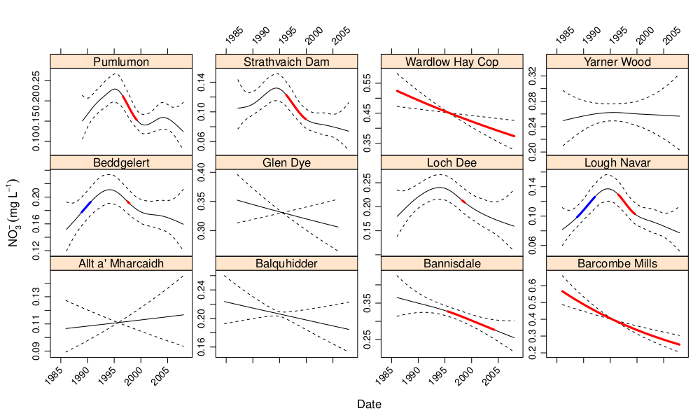
grid: lattice
-
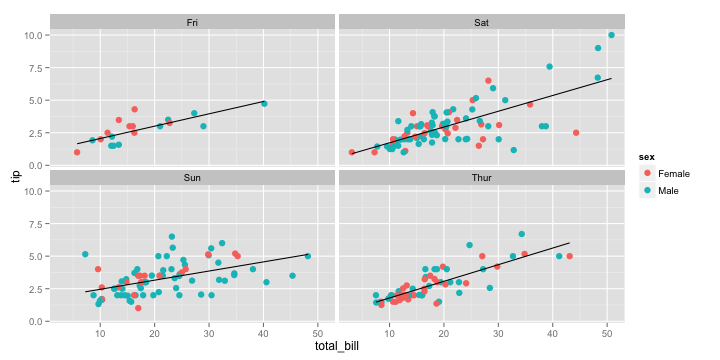
grid: ggplot2
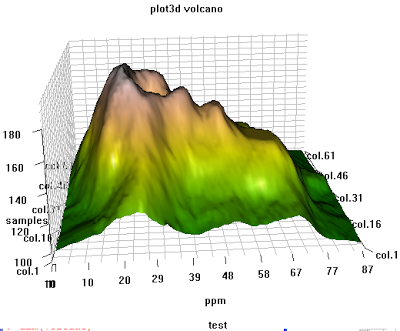
-
rgl

Welcome to 2016
-
base plotting
-
ggplot2 v2
-
ggvis
-
htmlwidgets
leaflet, dygraphs,
plotly, rglwidget
... (71 total) -
googleVis
-
(rmarkdown, shiny)
HTML
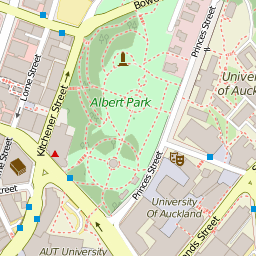
leaflet
Check out http://gallery.htmlwidgets.org/ for much more
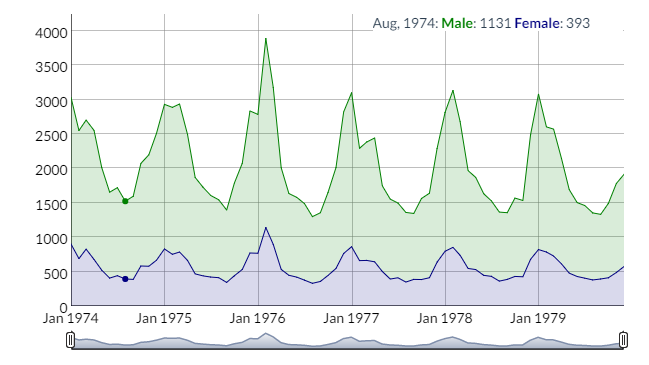
dygraphs
plotly (https://plot.ly/r/)
HTML is fine, but
- hope you like CSS, JavaScript, etc.
- data is
either embedded => ++MB
or hotlinked => connection - good luck exporting to static formats
ggplot2 is still your best bet!
ggplot2: philosophy
- don't draw graphical primitives
- don't draw strictly layer by layer
- draw geometric entities
(points, lines, histograms, densities, ...)
and statistical transformations
(binnings, summaries, quantiles, ...)
in terms of data bindings
Killer features
- high-level abstraction => short and clear code
- (almost) no low-level data manipulation in typical scenarios
- publication quality
- supports all reasonable devices
(eps, pdf, jpeg, tiff, png, bmp, svg, ...) - data bindings, geoms and stats are separate from visual appearance (theme elements)
- facets
- legends
- standard visualisations out of the box
- highly customizable

p <- ggplot(diamonds, aes(x=carat, y=price, color=clarity))
p + geom_point()
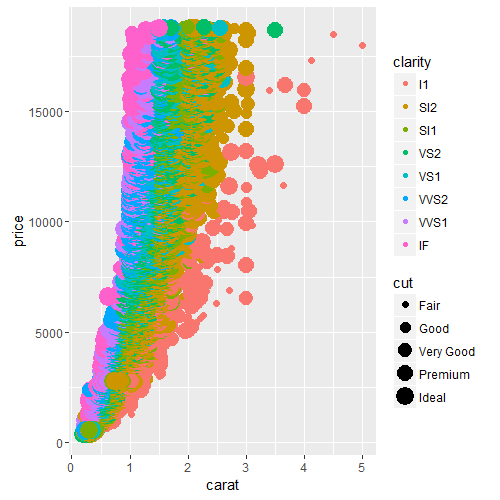
p + geom_point(aes(size = cut))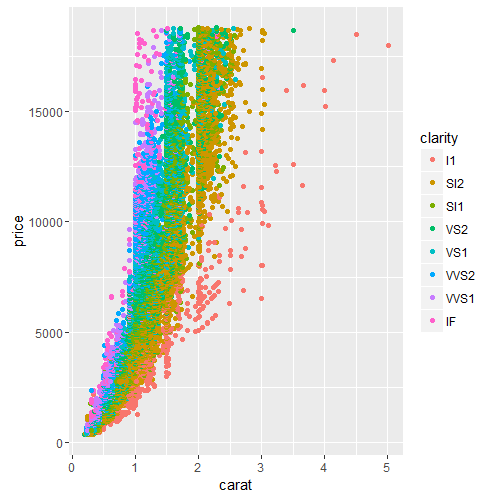
pp <- ggplot(diamonds, aes(x=color, y=price, fill=cut)) +
geom_boxplot() +
scale_y_log10()
pp
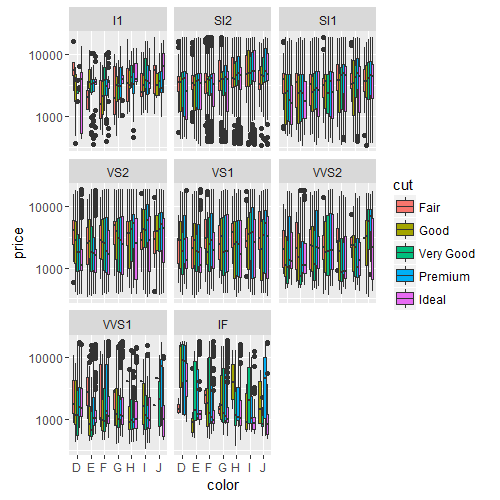
pp + facet_wrap(~clarity)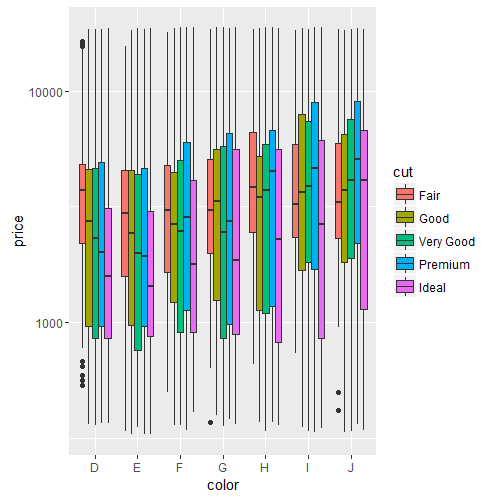
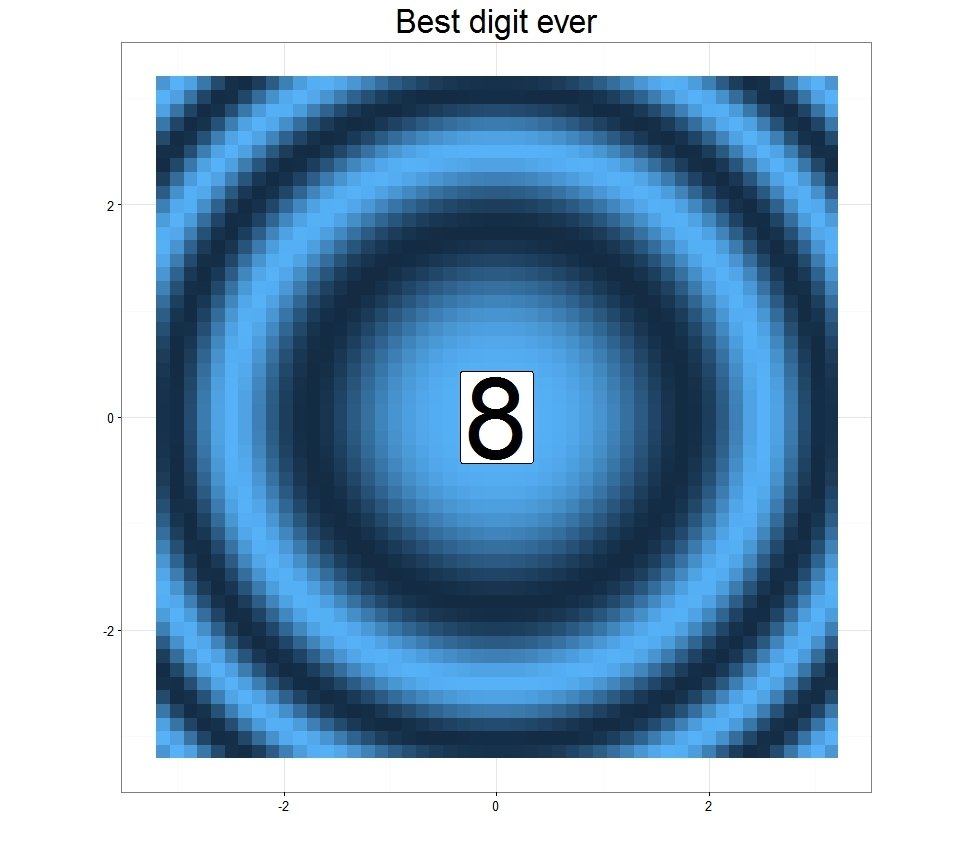
autoplot
autoplot.digit <- function(d, title = "", ...) {
  # background image
  grid <- expand.grid(
    x = seq(-pi, pi, length = 50),
    y = seq(-pi, pi, length = 50)
  )
  grid$z <- cos(grid$x ^ 2 + grid$y ^ 2)
  # ggplot object
  ggplot(grid, aes(x, y)) +
    geom_raster(aes(fill = z)) +
    geom_label(data = data.frame(x = 0, y = 0),
               label = as.character(d), size = 30) +
    coord_fixed() +
    theme_bw() +
    theme(legend.position = "none") +
    labs(x = "", y = "", title = title)
}

d <- 8
class(d) <- "digit"
autoplot(d, "Best digit ever") +
  theme(plot.title = element_text(size = 25))
For actual usage, see ggfortify, xts/zoo
standard generic
for class "digit"
further extend ggplot call
calculate something, return ggplot object
ggplot2 v2
- new and updated geoms
- tweaked appearance
- convenient facet labels
- more documentation
- ...
- extensibility
Extension mechanism
library(ggplot2)
library(grid)

GeomRegularPolygon <- ggproto(
  "GeomRegularPolygon", Geom,
  required_aes = c("x", "y"),
  default_aes = aes(colour = "black", fill = "red",
                    alpha = 0.2, size = 1),
  draw_key = draw_key_polygon,
  draw_panel = function(data, panel_scales, coord) {
    coords <- coord$transform(data, panel_scales)
    index <- seq_len(nrow(data))
    range_x <- max(coords$x) - min(coords$x)
    range_y <- max(coords$y) - min(coords$y)
    do.call(grid::gList, lapply(index, function(i) {
      grid::polygonGrob(
        x = c(coords$x[i] - range_x/10, coords$x[i],
              coords$x[i] + range_x/10, coords$x[i]),
        y = c(coords$y[i], coords$y[i] + range_y/10,
              coords$y[i], coords$y[i] - range_y/10),
        gp = grid::gpar(col = coords$colour[i],
                        fill = coords$fill[i],
                        alpha = coords$alpha[i],
                        lwd = coords$size[i] * .pt)
      )
    }))
  }
)
"constructor"
drawing "method"
actual drawing with grid
passing aesthetics
geom_regpoly <- function(mapping = NULL, data = NULL, stat = "identity",
                         position = "identity", na.rm = FALSE, show.legend = NA,
                         inherit.aes = TRUE, ...) {
  layer(
    geom = GeomRegularPolygon, mapping = mapping, data = data, stat = stat,
    position = position, show.legend = show.legend, inherit.aes = inherit.aes,
    params = list(na.rm = na.rm, ...)
  )
}

gg <- ggplot(mpg, aes(displ, hwy))
gg + geom_regpoly()
gg + geom_regpoly(fill = "blue")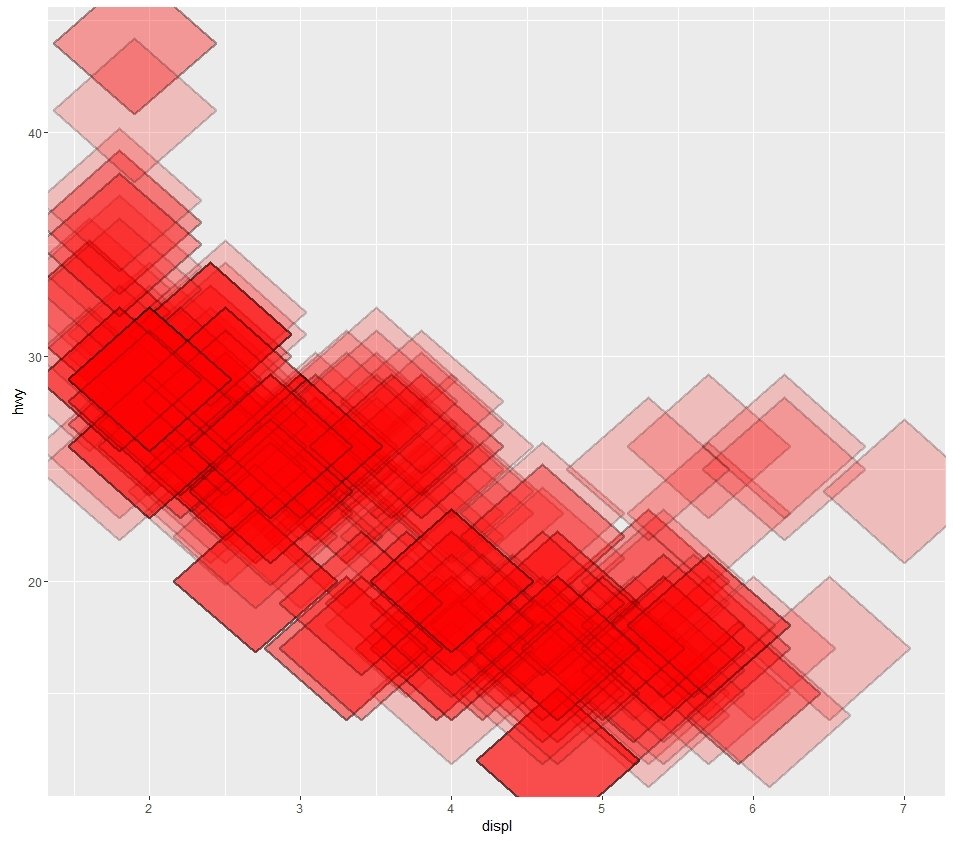
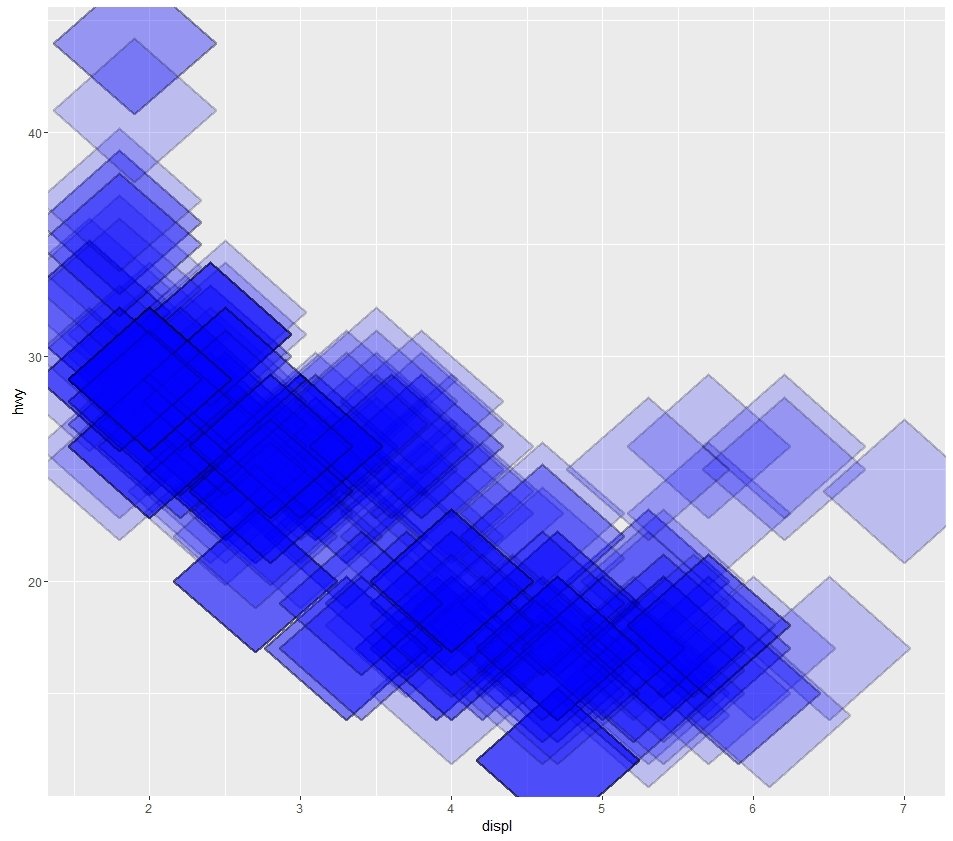
gg + geom_regpoly(aes(fill = class), size = 2)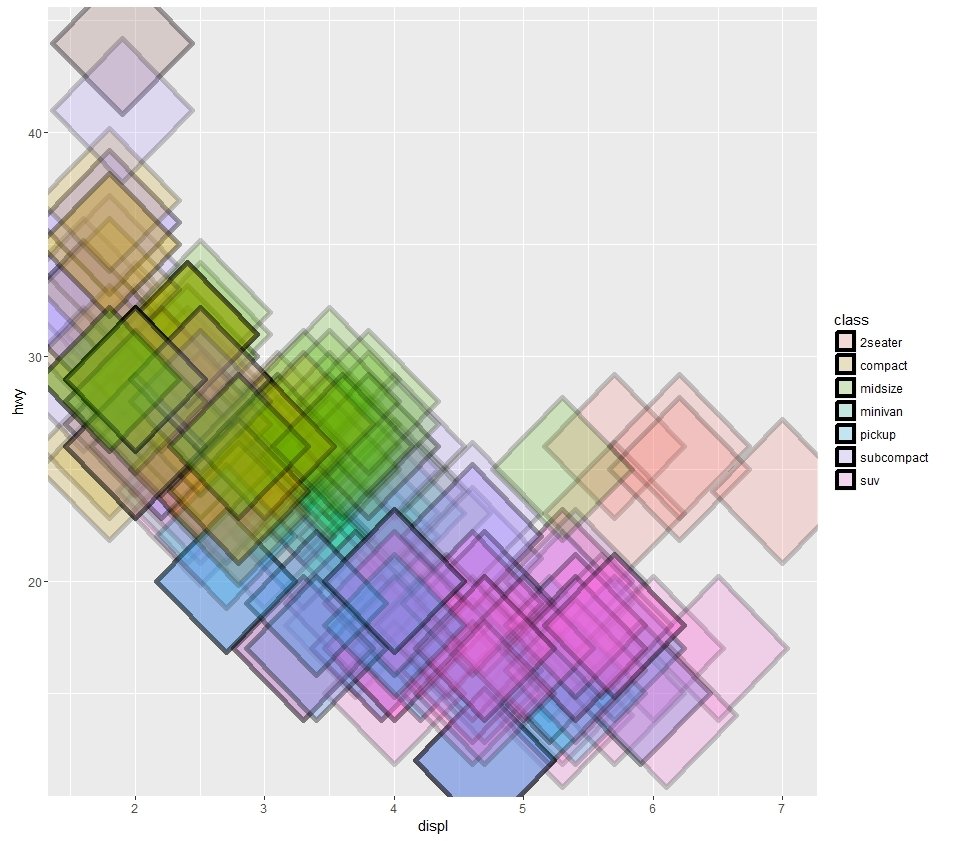

Not a magic wand
- can be rather slow
- nse in programming
- fine tuning can be painful
- some things are simply not possible*
- cryptic at times
Error in <my code> : object of type 'closure' is not subsettable*see gridExtra though
Friends
- scales
- gtable -- for complex layouts
- ggthemes
- ggmap
- https://www.ggplot2-exts.org/
- ...
- gridExtra
gridExtra
library(ggplot2)
library(gridExtra)

p1 <- ggplot(<...>)
p2 <- ggplot(<...>)

g_legend<-function(a.gplot) {
  tmp <- ggplot_gtable(ggplot_build(a.gplot))
  leg <- which(sapply(tmp$grobs, function(x) x$name) == "guide-box")
  legend <- tmp$grobs[[leg]]
  return(legend)
}

mylegend <- g_legend(p1)

p3 <- grid.arrange(arrangeGrob(p1 + theme(legend.position="none"),
                               p2 + theme(legend.position="none"),
                               nrow=1),
                   mylegend, nrow=2, heights=c(10, 1))
Result: shared legend
Ask on StackOverflow!
flexdashboard
- a new template for R markdown
- easy interactive dashboards
- static images or htmlwidgets
- custom layouts
- http://rmarkdown.rstudio.com/flexdashboard/
- rich and powerful
- flexible and extensible
- looks fancy
- any static format
- will stay strong for long
Bottomline
ggplot2
HTML tools
- rich and powerful
- flexible and extensible
- looks fancy
- dynamic, embeddable
- under heavy development


Useful links
Vote St. Petersburg

ggplot2 v2 and friends
By Antonov Anton
ggplot2 v2 and friends
The talk I gave at spbr4, the fourth meetup of St. Petersburg R user group (21.05.2016).


