DevOps Awesomeness With
Elasticsearch, Kibana and Graphite
Logging Analytics
Observability
Application Metrics
Who am I?
Torkel Ödegaard
@torkelo
github.com/torkelo
Stockholm
Sweden
Coding Instinct
"we are survival machines - robot vehicles blindly programmed to preserve the selfish molecules known as genes"
Why?
Continuous delivery
- Monitoring
- Logging
- Alerting
- Analytics
Distributed systems
- Isolated sub-systems / applications
- Async messaging via queues
- Many servers
Standard logging solution
log4net
log4j
NLog
FileAppender
DatabaseAppender
MailAppender
TcpAppender
EventLog
SELECT * FROM Logs WHERE ....
Standard metrics solution (win)
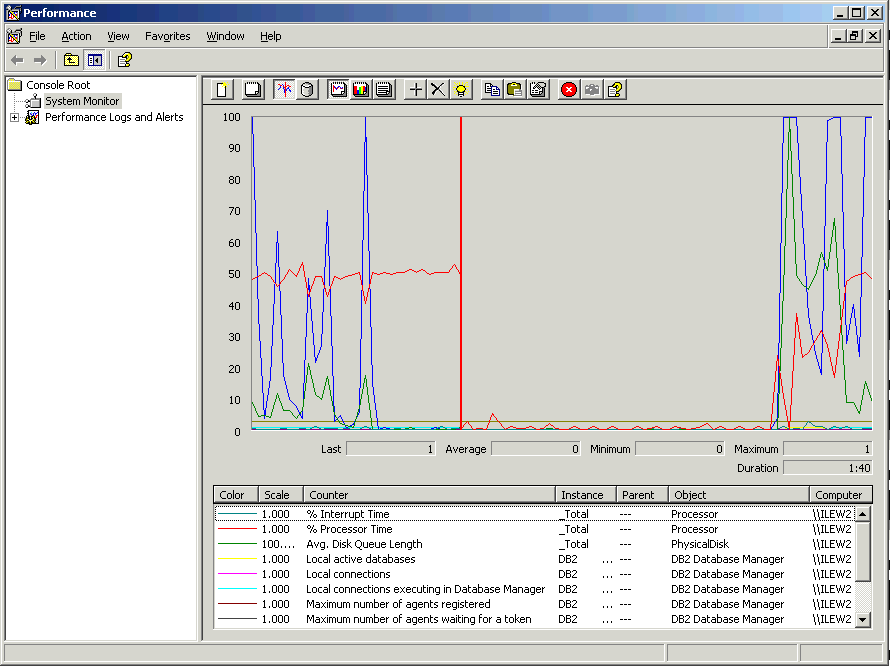
Performance Counters


Are there better options?
-
Fast centralized logging analytics
- Trends in errors, servers, application behavior
- High resolution live visualization of application behavior
- Detailed application performance metrics
- Long term trends / comparisons of user & application behavior
Elasticsearch
Kibana
Log -> Elasticsearch
LogStash
input {
    tcp {
        type => "log4j"
        port => 3333
    }
}
filter {
    grok {
        type => "log4j"
        pattern => "%{LOGLEVEL:severity}\s+%{WORD:category} ..."
        add_tag => "log4j"
    }
    date {
        type => "log4j"
        timestamp => "MM-dd-yyyy hh:mm:ss.SSS a Z"
    }
}
output {
    elasticsearch { host => "my-elasic-server" }
}
Inputs
input {
    file {
        'path' => '/var/log/apache2/*.log'
        'type' => 'apache-logs'
    }

    redis {
        host => "127.0.0.1"
        type => "redis-input"
        data_type => "list"
        key => "logstash"
        message_format => "json_event"
    }
}
Filters
filter {
  grok {
    pattern => "%{COMBINEDAPACHELOG}"
    singles => true
  }
  date {
    match => ["timestamp", "dd/MMM/yyyy:HH:mm:ss Z"]
    locale => "en"
  }
}
filter {
  geoip {
    source => "clientip"
  }
  useragent {
    source => "agent"
  }
}
Outputs
output {
    elasticsearch {
        host => "my-elasic-server"
    }

    redis {
    }

    mongodb {
    }

    rabbitmq {
    }
}
Demo
Metrics / Measurements
Metric vs Log Event
MetricKey Value Timestamp

Graphite
- Open source scalable time series database
- Composed of 3 components
- Carbon - receives and records metrics
- Whisper - Storage engine
- Graphite-web - Http frontend
- Large community
- Written in python
Input
prod.apps.server-1.counter.login.count 10 1398969187
prod.apps.*.counter.login.count

Functions!
sumSeries(apps.mysite.*.counter.login.count)
summarize(apps.mysite.*.counter.login.count, '1h')
movingAverage(apps.mysite.*.counter.login.count, 10)
timeShift(apps.mysite.*.counter.login.count, '7d')
Metric Libraries
- codahale metrics (java)
- metrics-net
- ostrich (scala)
- StatsD (all languages)
- github
Metric types
- Counters
- Timers
- Gauges
Metric.Increment("user.login");


Metric.Time("auction_search", 142);


Metric.Time("auction_search", () => search());
apps.devsum.server-01.counters.auction_search.count   15    123123123131
apps.devsum.server-02.counters.auction_search.count    1    123123123131
apps.devsum.server-03.counters.auction_search.count   35    123123123131

apps.devsum.server-01.timers.auction_search.count    5    123123123131
apps.devsum.server-01.timers.auction_search.mean    10    123123123131
apps.devsum.server-01.timers.auction_search.max     50    123123123131
apps.devsum.server-01.timers.auction_search.min      2    123123123131
Demo
play.grafana.org
Graphite configuration
[stats]
pattern = ^apps.*
retentions = 10s:6h,1min:7d,10min:5y

[stats]
pattern = ^highres.*
retentions = 1s:6h,1min:1d

[stats]
pattern = ^statsd.*
retentions = 1min:1d,10min:1y
Time measurements
Average is not god enough!
5
7
2
7
2400
20
15
10000
4
2
Avg = 1246
Percentiles
5
7
2
7
2400
20
15
10000
4
2
Percentiles
10000
2400
20
15
7
7
5
4
2
2
upper 20 = 2
upper 50 = 7
upper 70 = 15
upper 90 = 2400
StatsD
Summary
Great Logging and Metrics are Awesome
Elasticsearch Kibana Graphite
Datadog, Librato, New Relic, Splunk, AppDynamics, Scout
Thanks!
@torkelo
@grafana
grafana.org
github.com/grafana/grafana
DevOps Awesomeness With Elasticsearch, Kibana and Graphite
By torkelo
DevOps Awesomeness With Elasticsearch, Kibana and Graphite
- 4,709


